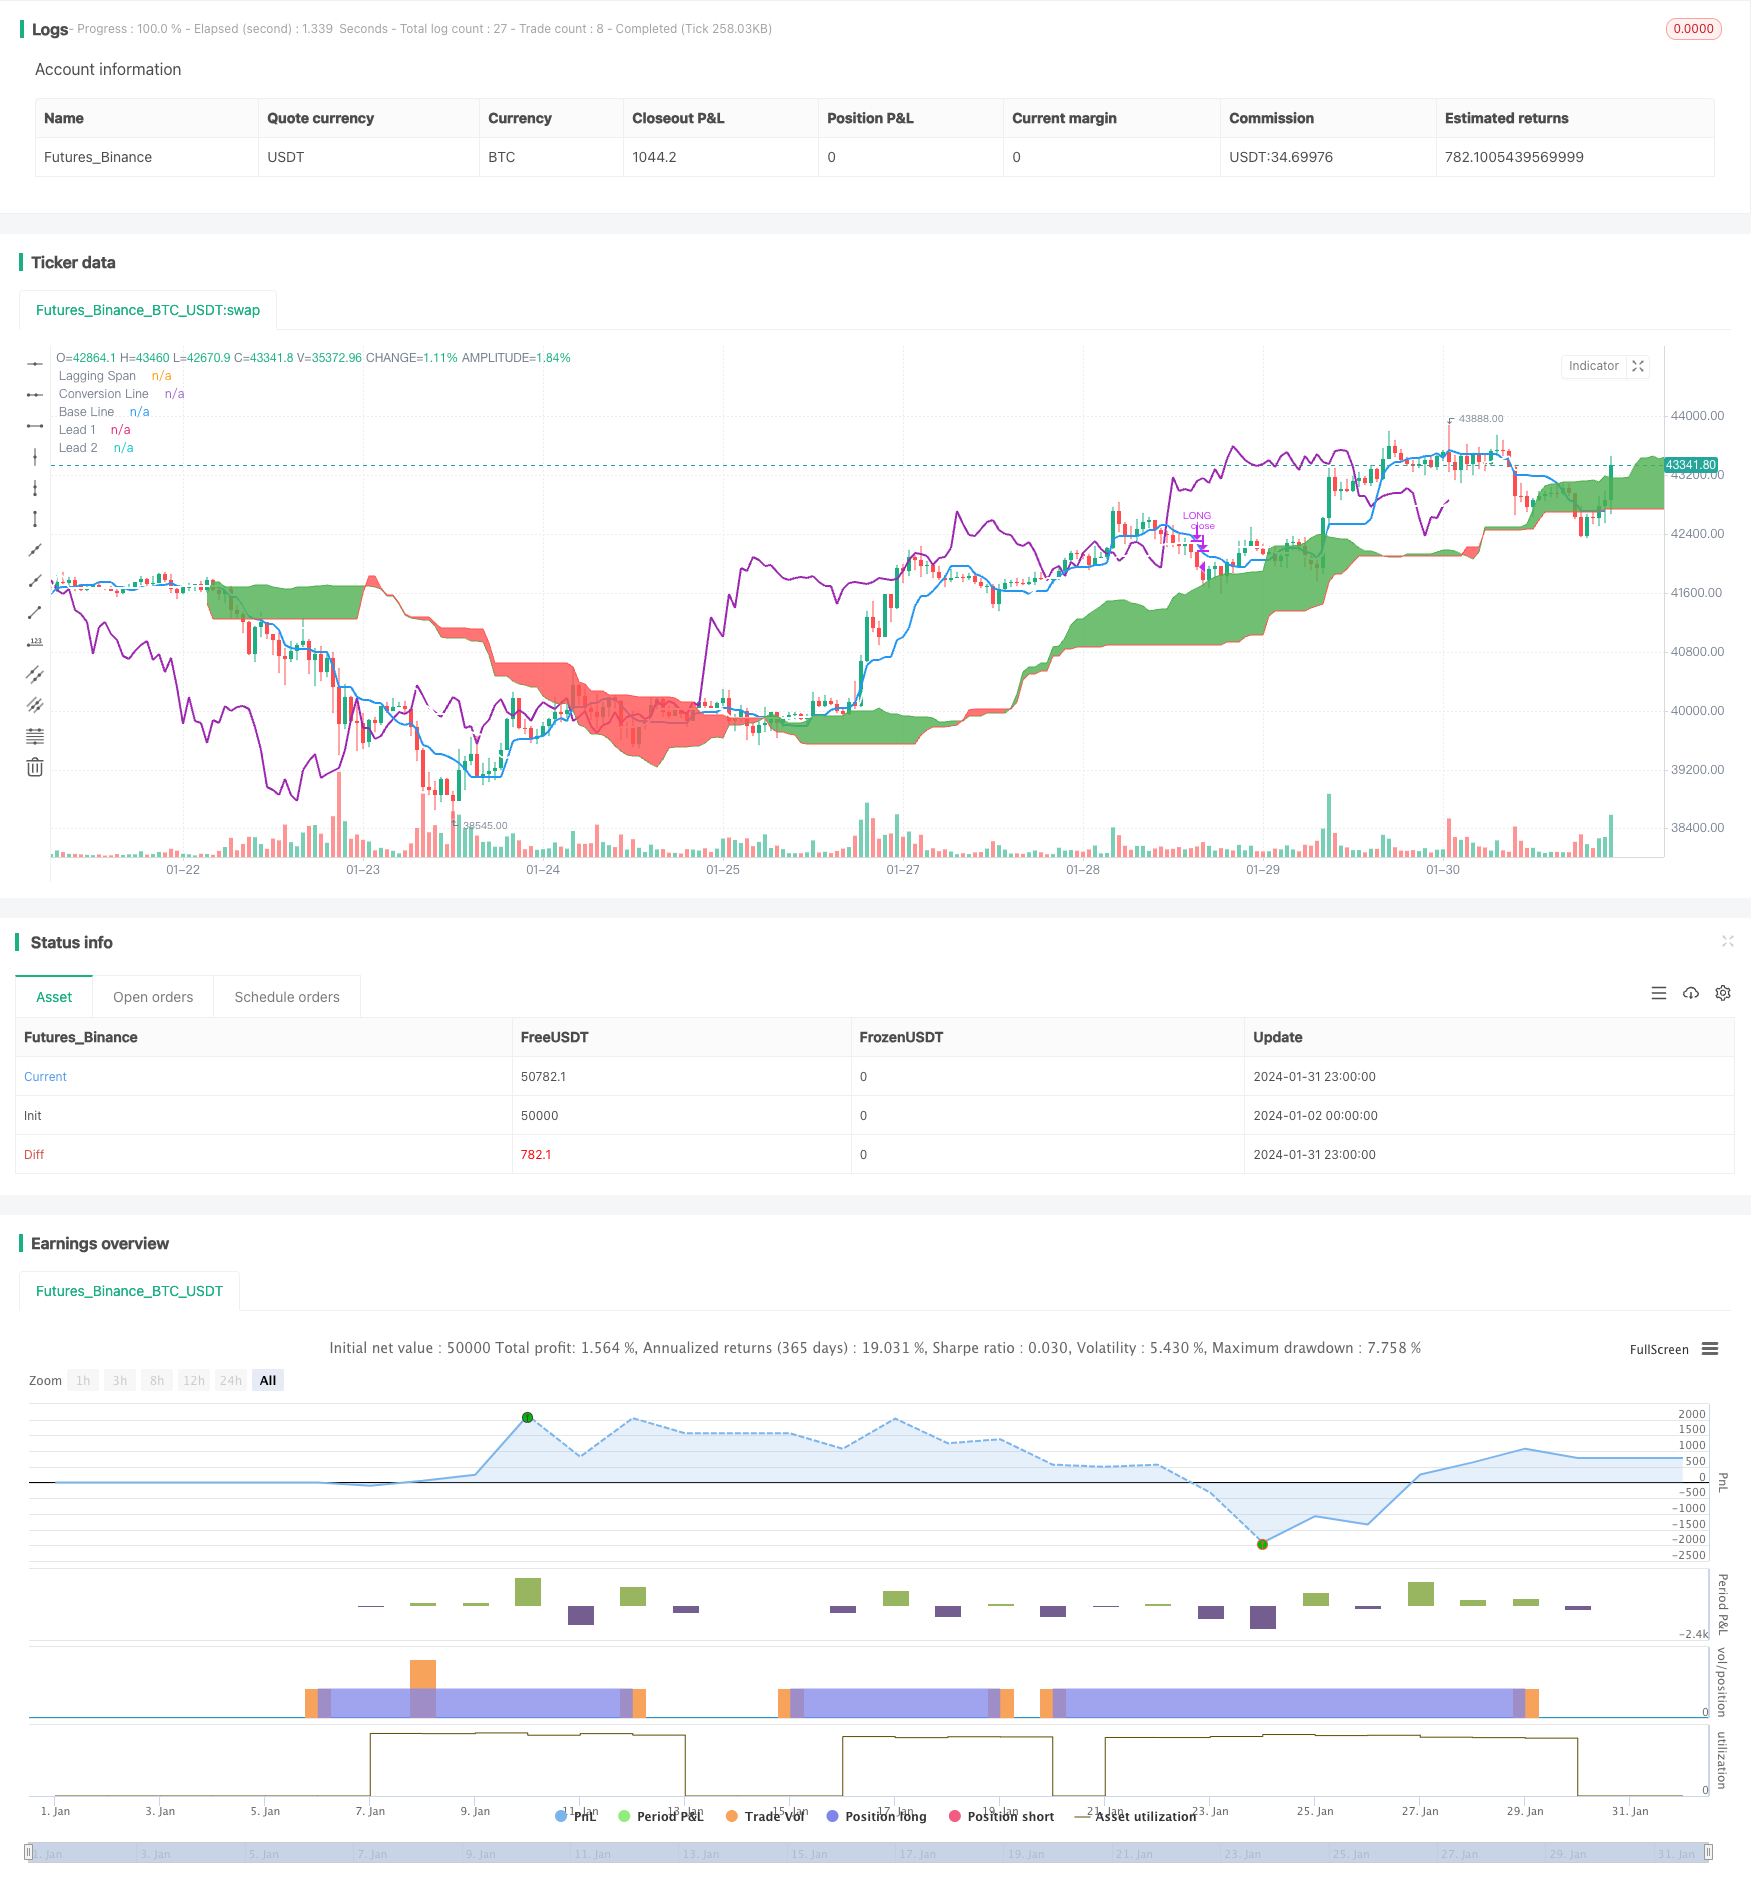
Market Potential Ichimoku Bullish Cloud Strategy
Author: ChaoZhang, Date: 2024-02-02 16:57:46Tags:

Overview
This strategy is a long-only Ichimoku cloud trading strategy. It goes long when the conversion line crosses above the base line, and closes position when the base line crosses below the conversion line. In addition, when opening or closing positions, it also checks the Lagging Span to see if it is above or below the cloud.
Strategy Logic
The strategy utilizes several lines from the Ichimoku indicator. Specifically:
Conversion Line: The average of the high and low over the past 9 days, representing short-term trend conversion.
Base Line: The average of the high and low over the past 26 days, representing the mean price movement over that period.
Leading Span A: The average of the conversion and base lines.
Leading Span B: The average of the high and low over the past 52 days, a leading indicator for medium to long term trends.
Lagging Span: The closing price lagging 26 days back, representing the momentum of the trend.
To open a position, the conversion line needs to cross above the base line AND the Lagging Span needs to be above the cloud. This signals an upward trend in both the short and medium/long term.
To close a position, the base line needs to cross below the conversion line AND the Lagging Span needs to be below the cloud. This signals a trend reversal and suggests exiting the position.
Advantages of the Strategy
Uses Ichimoku cloud to determine trend direction accurately.
Combining multiple lines avoids false signals.
Long-only matches the long term upside trends of most cryptocurrencies.
Strict condition filtering gives high quality signals.
Risks of the Strategy
Only allows full position or flat, cannot adjust position size.
Performs very well in bull market but risks heavy losses in bear market.
Default parameters tuned for crypto may need adjustments for other assets.
Fewer trade signals means some opportunities could be missed.
Improvements
Add position sizing functionality to close some of the position when loss reaches a threshold.
Add short selling signals when key support levels break to reduce losses.
Optimize parameters to fit more symbols and improve robustness.
Add stop loss when loss reaches a level to contain downside risk.
Summary
As a long-only Ichimoku strategy, this approach reliably determines trend reversals by combining multiple Ichimoku lines. It works especially well for assets with persistent upside trends like cryptocurrencies. Further enhancements to risk management like stop losses and position sizing can make this strategy more robust across different market environments and asset types.
/*backtest
start: 2024-01-02 00:00:00
end: 2024-02-01 00:00:00
period: 1h
basePeriod: 15m
exchanges: [{"eid":"Futures_Binance","currency":"BTC_USDT"}]
*/

// This source code is subject to the terms of the Mozilla Public License 2.0 at https://mozilla.org/MPL/2.0/
// Simple long-only Ichimoku Cloud Strategy
// Enter position when conversion line crosses base line up, and close it when the opposite happens.
// Additional condition for open / close the trade is lagging span, it should be higher than cloud to open position and below - to close it.
//@version=4
strategy("Ichimoku Cloud Strategy Long Only", shorttitle="Ichimoku Cloud Strategy (long only)", overlay=true )

conversion_length = input(9, minval=1, title="Conversion Line Periods"),
base_length = input(26, minval=1, title="Base Line Periods")
lagging_length = input(52, minval=1, title="Lagging Span 2 Periods"),
delta = input(26, minval=1, title="Delta")

average(len) => avg(lowest(len), highest(len))

conversion_line = average(conversion_length) // tenkan sen - trend
base_line = average(base_length) // kijun sen - movement
lead_line_a = avg(conversion_line, base_line) // senkou span A
lead_line_b = average(lagging_length) // senkou span B
lagging_span = close // chikou span - trend / move power

plot(conversion_line, color=color.blue, linewidth=2, title="Conversion Line")
plot(base_line, color=color.white, linewidth=2, title="Base Line")
plot(lagging_span, offset = -delta, color=color.purple, linewidth=2, title="Lagging Span")

lead_line_a_plot = plot(lead_line_a, offset = delta, color=color.green, title="Lead 1")
lead_line_b_plot = plot(lead_line_b, offset = delta, color=color.red, title="Lead 2")
fill(lead_line_a_plot, lead_line_b_plot, color = lead_line_a > lead_line_b ? color.green : color.red)

// Strategy logic

long_signal = crossover(conversion_line,base_line) and ((lagging_span) > (lead_line_a)) and ((lagging_span) > (lead_line_b))
short_signal = crossover(base_line, conversion_line) and ((lagging_span) < (lead_line_a)) and ((lagging_span) < (lead_line_b))

strategy.entry("LONG", strategy.long, when=strategy.opentrades == 0 and long_signal, alert_message='BUY')
strategy.close("LONG", when=strategy.opentrades > 0 and short_signal, alert_message='SELL')

    // === Backtesting Dates === thanks to Trost

testPeriodSwitch = input(true, "Custom Backtesting Dates")
testStartYear = input(2021, "Backtest Start Year")
testStartMonth = input(1, "Backtest Start Month")
testStartDay = input(1, "Backtest Start Day")
testStartHour = input(0, "Backtest Start Hour")
testPeriodStart = timestamp(testStartYear, testStartMonth, testStartDay, testStartHour, 0)
testStopYear = input(2021, "Backtest Stop Year")
testStopMonth = input(12, "Backtest Stop Month")
testStopDay = input(1, "Backtest Stop Day")
testStopHour = input(0, "Backtest Stop Hour")
testPeriodStop = timestamp(testStopYear, testStopMonth, testStopDay, testStopHour, 0)
testPeriod() => true
testPeriod_1 = testPeriod()
isPeriod = testPeriodSwitch == true ? testPeriod_1 : true
// === /END

if not isPeriod
    strategy.cancel_all()
    strategy.close_all()
- Lazy Bear Squeeze Momentum Strategy
- Trend Prediction Dual Moving Average Strategy
- Dual Moving Average Reversal Strategy
- Dual Breakthrough Moving Average Trading Strategy
- Dazzling Bolts Trend Following Strategy
- VRSI and MARSI Strategy
- Stop Loss and Take Profit Strategy Based on Doji Pattern
- Dual Exponential Moving Average Trend Following Strategy
- DMI Balance Buy/Sell Strategy
- Moving Average Displaced Envelope Strategy
- EMA RSI Hidden Divergence Trend Following Strategy
- Advanced Trend Tracking Strategy Based on Engulfing Pattern and Quantitative Indicators
- AlphaTrend Dual Tracking Strategy
- Fisher Yurik Trailing Stop Strategy
- Trend Following RSI Scalping Strategy
- Spiral Cross Strategy with Moving Average Confirmation
- Gold Cross Dead Cross Quantitative Trading Strategy
- Dual Moving Average Strategy 360°
- Open High Close Low Breakout Trading Strategy
- Double Exponential Moving Average Quant Trading Strategy