概述
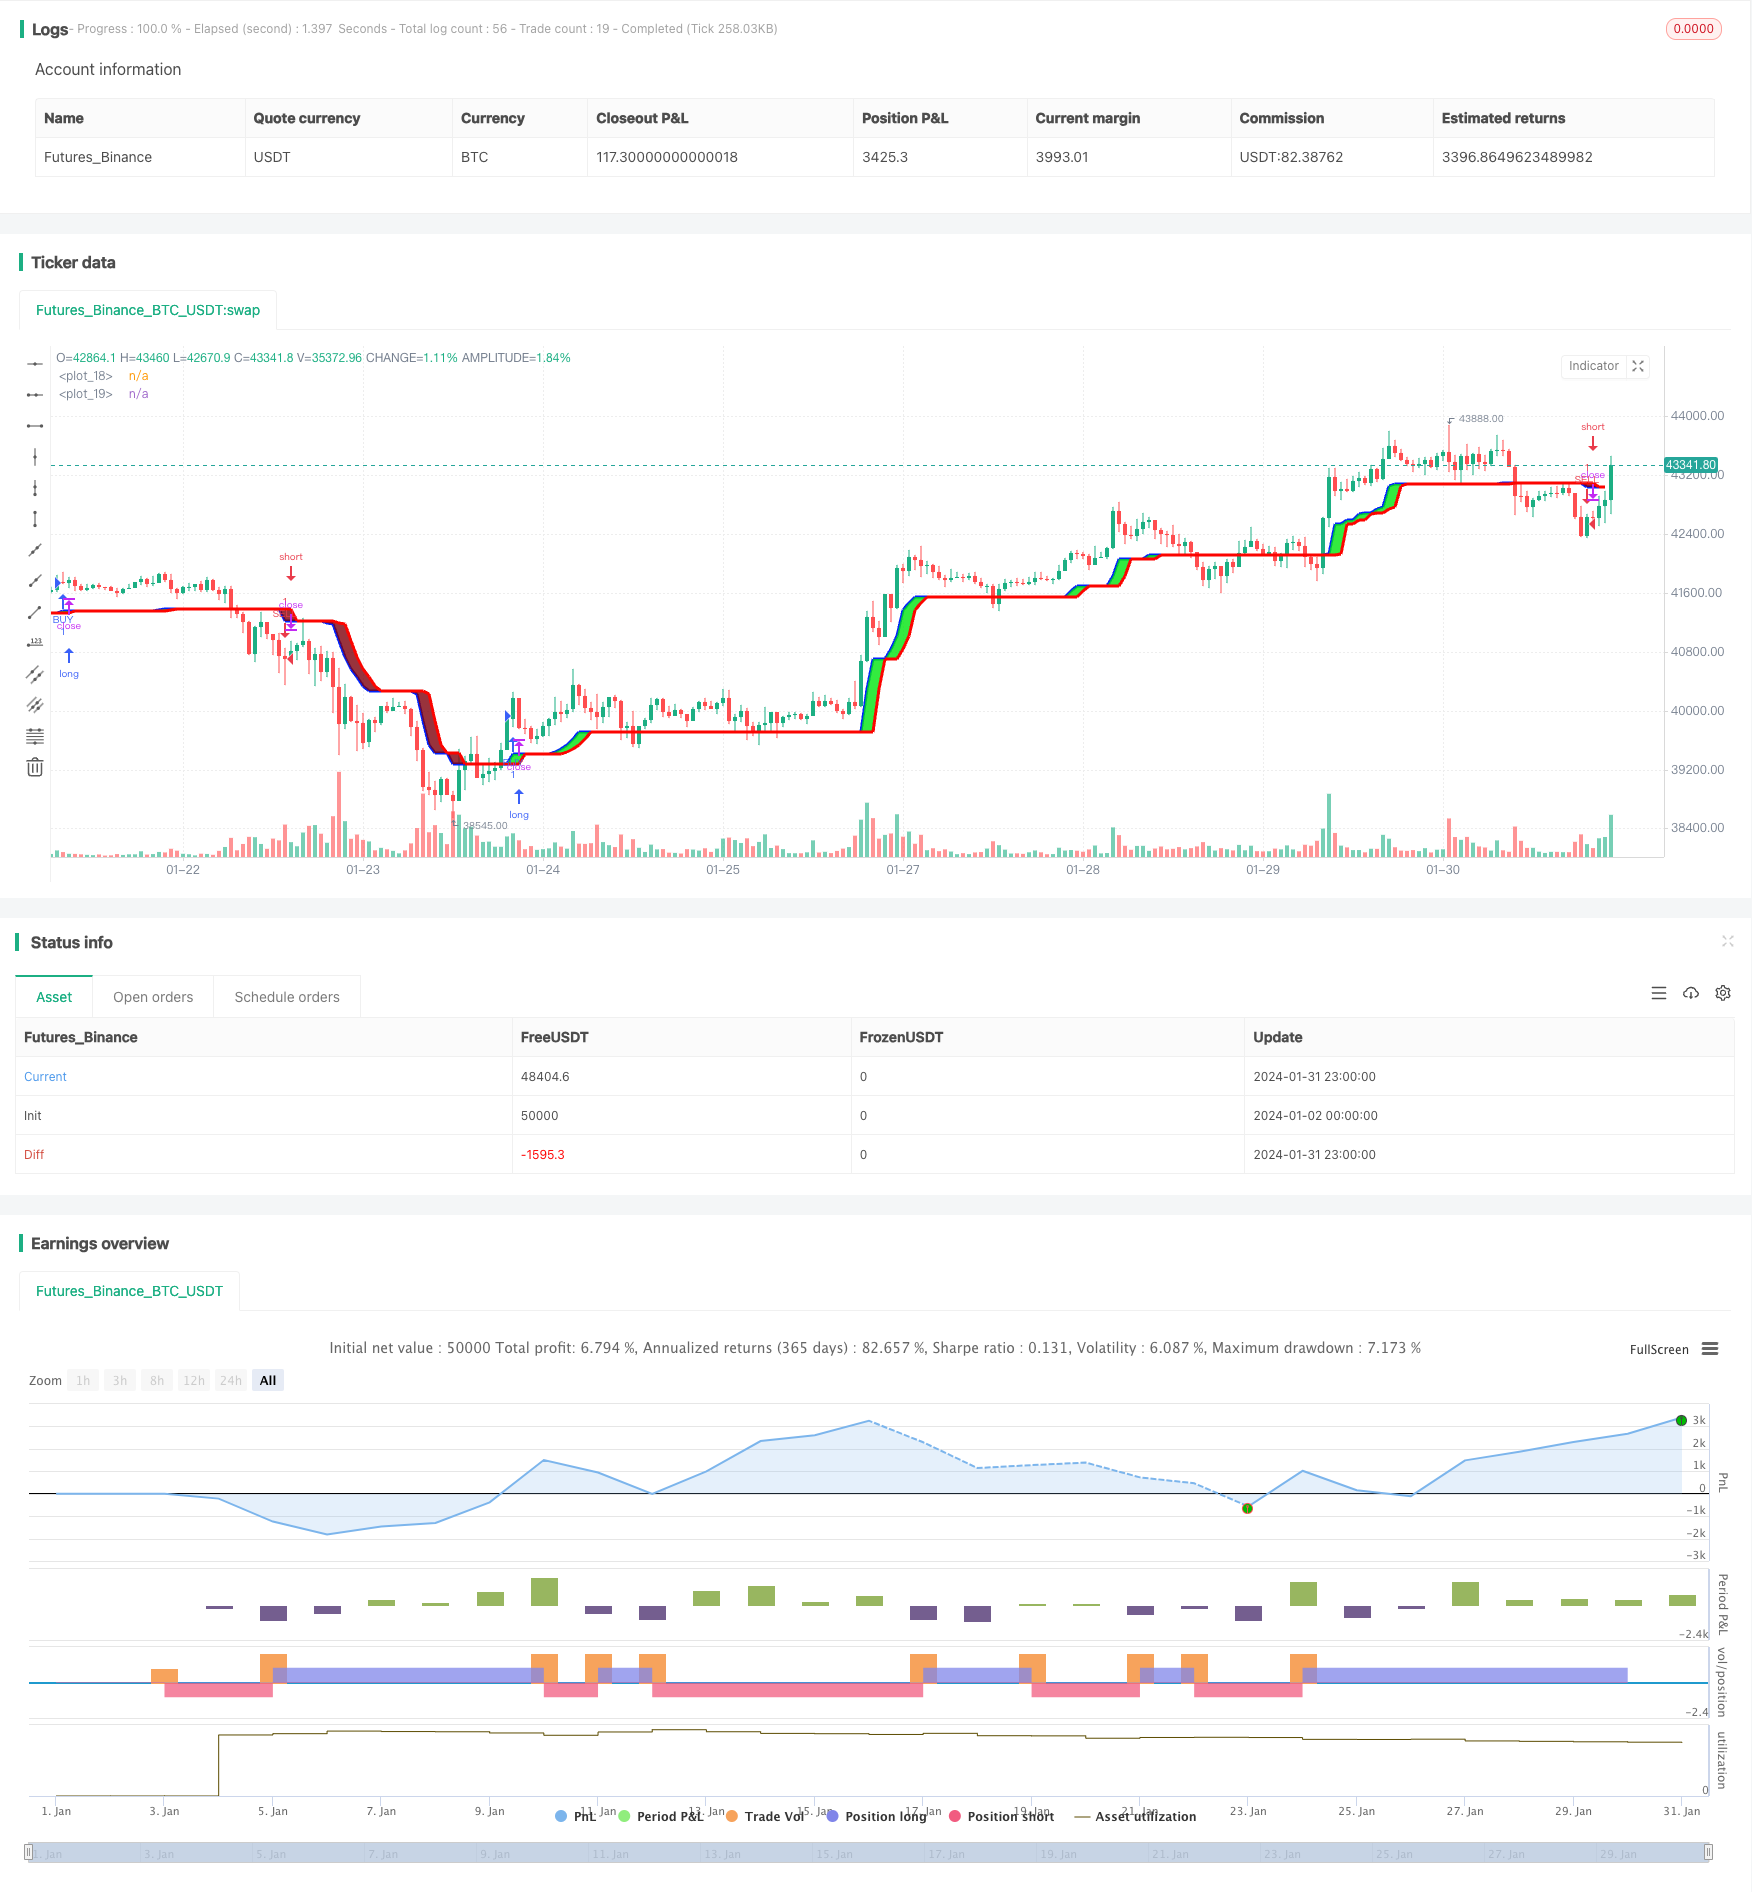
AlphaTrend双向跟踪策略是根据AlphaTrend指标的买入和卖出信号来进行交易的策略。该策略可以在AlphaTrend指标产生买入和卖出信号的区域打开多头和空头仓位。
策略原理
AlphaTrend双向跟踪策略的核心是AlphaTrend指标。AlphaTrend指标基于自适应平均真实波幅(ATR)和价格(收盘价或成交量加权平均价)的组合来计算上轨和下轨。具体计算方法是:
上轨 = 最低价 - ATR * 系数 下轨 = 最高价 + ATR * 系数
其中ATR是过去一定周期的平均真实波幅,系数是可调参数。当价格高于上轨时,指标线接近上轨;当价格低于下轨时,指标线接近下轨。这样AlphaTrend指标就形成了一个自适应的通道。
AlphaTrend双向跟踪策略则是基于AlphaTrend指标的信号来建立多头和空头仓位。具体逻辑是:
- 当价格上穿AlphaTrend指标时,做多;
- 当价格下穿AlphaTrend指标时,做空。
这样就完成了基于AlphaTrend指标动态通道的双向跟踪交易。
优势分析
AlphaTrend双向跟踪策略最大的优势在于能够跟踪市场趋势的变化。自适应ATR能够根据市场波动率的变化调整通道范围,避免了传统布林带等指标容易因波动率扩大而失效的问题。
另外,AlphaTrend指标同时结合价格和成交量(或势能),能够过滤掉一些假突破。这也提高了策略信号的质量。
风险分析
AlphaTrend双向跟踪策略的主要风险来自于巨大行情震荡对指标通道的冲击。当市场出现异常波动时,停损点有可能被突破,导致较大亏损。这需要通过适当调整ATR参数和停损点来控制风险。
此外,ALPHA指标本身会有一定滞后。所以在行情转折点附近也会产生错误信号。这需要辅助其他指标来确认。
优化方向
AlphaTrend双向跟踪策略可以从以下几个方面进行优化:
- 结合趋势指标判断市场主要趋势,避免逆势交易;
- 增加成交量限制,避免低量的假突破带来损失;
- 优化指标参数,使通道范围更加符合不同品种的特点;
- 增加机器学习算法,使通道更加智能化。
通过以上几点优化,可以进一步提高AlphaTrend策略的稳定性和盈利能力。
总结
AlphaTrend双向跟踪策略整体来说是一种跟踪市场变化的有效策略。它解决了传统技术指标容易失效的问题,也结合了成交量来过滤信号。通过适当优化,该策略可以成为量化交易体系中的有力工具。
/*backtest
start: 2024-01-02 00:00:00
end: 2024-02-01 00:00:00
period: 1h
basePeriod: 15m
exchanges: [{"eid":"Futures_Binance","currency":"BTC_USDT"}]
*/

// This source code is subject to the terms of the Mozilla Public License 2.0 at https://mozilla.org/MPL/2.0/
// author © KivancOzbilgic
// developer © KivancOzbilgic
//@version=5
strategy('AlphaTrend', shorttitle='AT', overlay=true, format=format.price, precision=2)
coeff = input.float(1, 'Multiplier', step=0.1)
AP = input(14, 'Common Period')
ATR = ta.sma(ta.tr, AP)
src = input(close)
showsignalsk = input(title='Show Signals?', defval=true)
novolumedata = input(title='Change calculation (no volume data)?', defval=false)
upT = low - ATR * coeff
downT = high + ATR * coeff
AlphaTrend = 0.0
AlphaTrend := (novolumedata ? ta.rsi(src, AP) >= 50 : ta.mfi(hlc3, AP) >= 50) ? upT < nz(AlphaTrend[1]) ? nz(AlphaTrend[1]) : upT : downT > nz(AlphaTrend[1]) ? nz(AlphaTrend[1]) : downT

color1 = AlphaTrend > AlphaTrend[2] ? #00E60F : AlphaTrend < AlphaTrend[2] ? #80000B : AlphaTrend[1] > AlphaTrend[3] ? #00E60F : #80000B
k1 = plot(AlphaTrend, color=color.new(#0022FC, 0), linewidth=3)
k2 = plot(AlphaTrend[2], color=color.new(#FC0400, 0), linewidth=3)

fill(k1, k2, color=color1)

buySignalk = ta.crossover(AlphaTrend, AlphaTrend[2])
sellSignalk = ta.crossunder(AlphaTrend, AlphaTrend[2])


K1 = ta.barssince(buySignalk)
K2 = ta.barssince(sellSignalk)
O1 = ta.barssince(buySignalk[1])
O2 = ta.barssince(sellSignalk[1])

//plotshape(buySignalk and showsignalsk and O1 > K2 ? AlphaTrend[2] * 0.9999 : na, title='BUY', text='BUY', location=location.absolute, style=shape.labelup, size=size.tiny, color=color.new(#0022FC, 0), textcolor=color.new(color.white, 0))

//plotshape(sellSignalk and showsignalsk and O2 > K1 ? AlphaTrend[2] * 1.0001 : na, title='SELL', text='SELL', location=location.absolute, style=shape.labeldown, size=size.tiny, color=color.new(color.maroon, 0), textcolor=color.new(color.white, 0))


longCondition = buySignalk and showsignalsk and O1 > K2
if (longCondition)

    strategy.entry("BUY", strategy.long, comment = "BUY ENTRY")

shortCondition = sellSignalk and showsignalsk and O2 > K1
if (shortCondition )

    strategy.entry("SELL", strategy.short, comment = "SELL ENTRY")


// alertcondition(buySignalk and O1 > K2, title='Potential BUY Alarm', message='BUY SIGNAL!')
// alertcondition(sellSignalk and O2 > K1, title='Potential SELL Alarm', message='SELL SIGNAL!')

// alertcondition(buySignalk[1] and O1[1] > K2, title='Confirmed BUY Alarm', message='BUY SIGNAL APPROVED!')
// alertcondition(sellSignalk[1] and O2[1] > K1, title='Confirmed SELL Alarm', message='SELL SIGNAL APPROVED!')


// alertcondition(ta.cross(close, AlphaTrend), title='Price Cross Alert', message='Price - AlphaTrend Crossing!')
// alertcondition(ta.crossover(low, AlphaTrend), title='Candle CrossOver Alarm', message='LAST BAR is ABOVE ALPHATREND')
// alertcondition(ta.crossunder(high, AlphaTrend), title='Candle CrossUnder Alarm', message='LAST BAR is BELOW ALPHATREND!')

// alertcondition(ta.cross(close[1], AlphaTrend[1]), title='Price Cross Alert After Bar Close', message='Price - AlphaTrend Crossing!')
// alertcondition(ta.crossover(low[1], AlphaTrend[1]), title='Candle CrossOver Alarm After Bar Close', message='LAST BAR is ABOVE ALPHATREND!')
// alertcondition(ta.crossunder(high[1], AlphaTrend[1]), title='Candle CrossUnder Alarm After Bar Close', message='LAST BAR is BELOW ALPHATREND!')