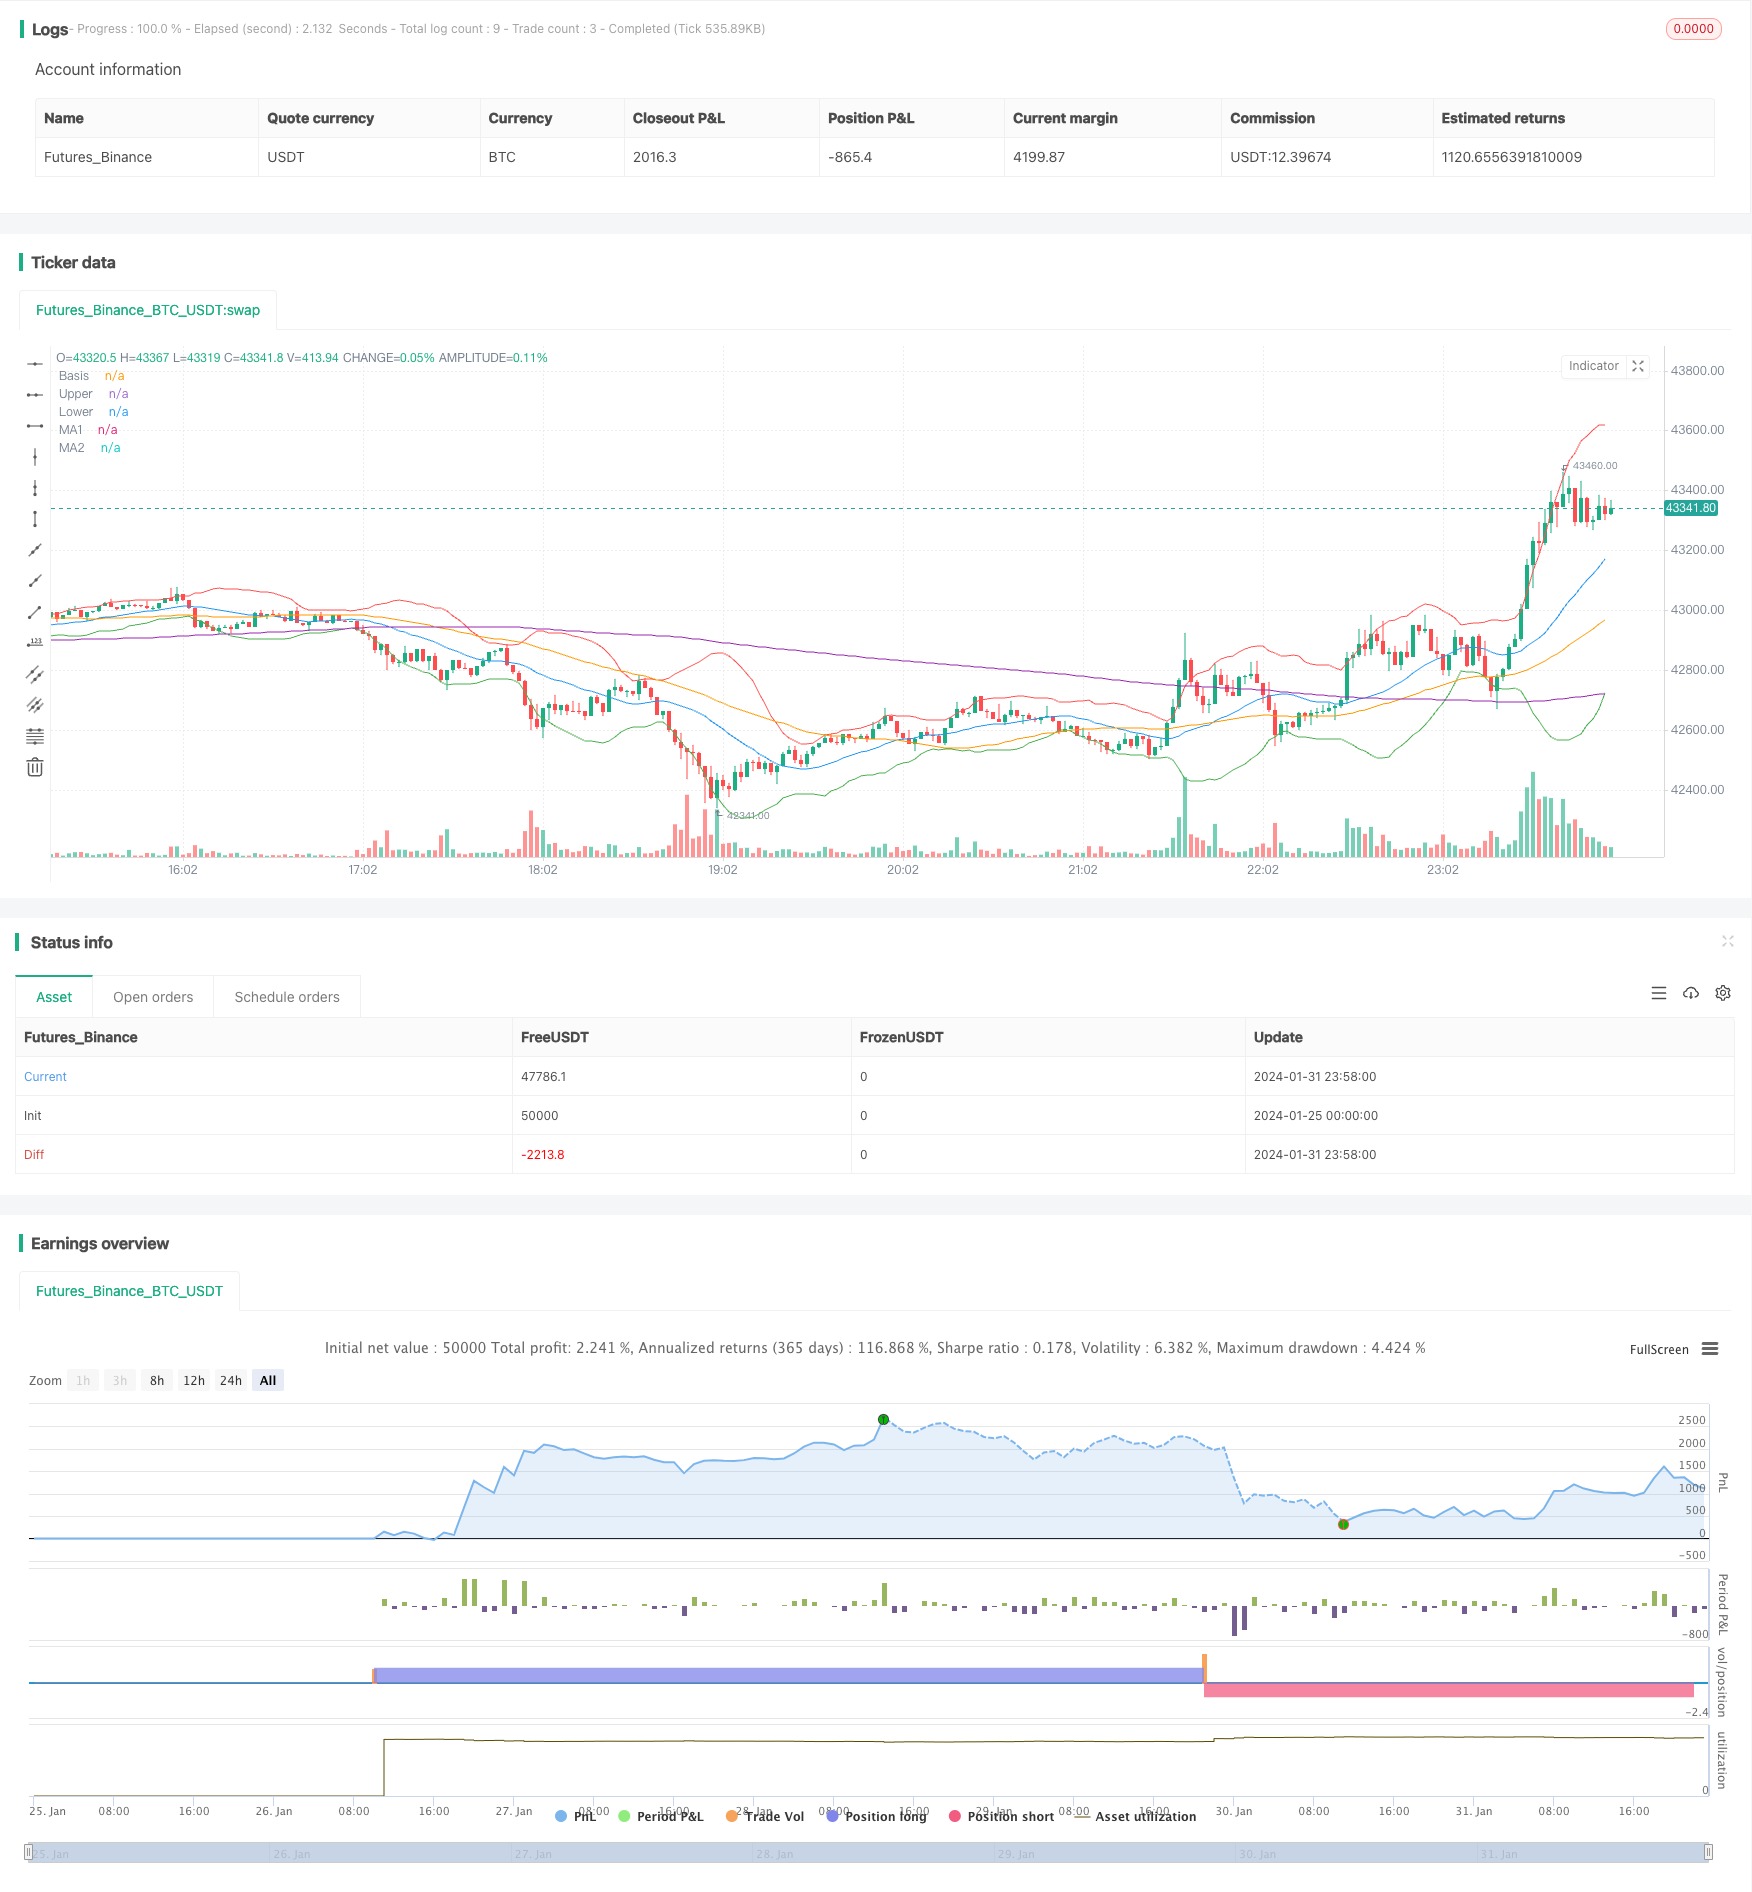
Bollinger Bands and Moving Averages Combination Strategy
Author: ChaoZhang, Date: 2024-02-02 17:47:12Tags:

Overview
This strategy combines Bollinger Bands and Moving Averages, using Bollinger Bands upper band and lower band to determine price breakouts and using fast moving average golden cross and death cross with slow moving average to determine trends. It goes long when price breaks above Bollinger upper band and fast moving average crosses above slow moving average. It goes short when price breaks below Bollinger lower band and fast moving average crosses below slow moving average. Using such double confirmation can effectively filter false breakouts.
Strategy Principle
This strategy mainly utilizes two technical indicators, Bollinger Bands to determine price levels and Moving Averages to determine trends.
Bollinger middle band is simple moving average of price, upper band is middle band + 2 standard deviation, lower band is middle band - 2 standard deviation. When price approaches upper band, it indicates an overbought condition. When price approaches lower band, it indicates an oversold condition.
Fast moving average is 50-period simple moving average of price and slow moving average is 200-period simple moving average. When fast MA crosses above slow MA, it signals an uptrend or a “golden cross”. When fast MA crosses below slow MA, it signals a downtrend or a “death cross”.
The entry signals require meeting both conditions simultaneously: price break above Bollinger upper band indicates breaking a resistance level AND fast MA cross above slow MA indicates uptrend; price break below Bollinger lower band indicates breaking a support level AND fast MA cross below slow MA indicates downtrend. This double confirmation can effectively filter the influence of false breakouts.
Advantages
Using double confirmation can effectively filter false breakouts and make entries more accurate.
Bollinger Bands visually determine support and resistance levels, Moving Averages reliably determine trends, combination complements each other.
High optimization flexibility on parameters like Bollinger period, standard deviation multiplier, MA periods etc. Fits more market environments.
Simple to implement, easy to understand, less code, can directly be used in live trading.
Risks
Both Bollinger Bands and MAs may fail in certain cases, double confirmation may also fail together, causing wrong entries.
MAs have lagging issue, may cause inaccurate entry timing or missing opportunities.
Inadequate parameter settings like too short BB period, unmatched MA periods etc. may undermine strategy performance.
Breakout strategies are prone to false breakout impact, even with double confirmation.
Methods like dynamic adjustment of parameters, strict stop loss, combining with other indicators can help reduce risks.
Optimization Directions
Introduce other indicators for condition checking, e.g. volume amplification on BB breakouts, MACD for trend determination, forming multiple confirmations.
Incorporate candlestick patterns to assist entry timing, e.g. hammer formed on BB upper touch.
Adopt dynamic MAs instead of static MAs to further improve trend determination.
Set parameter auto-optimization to find optimum parameter sets via historical backtests.
Adjust position sizing and stop loss levels, set strict stop loss to control loss.
Conclusion
This strategy combines Bollinger Bands and Moving Averages based on technical indicators, enters positions only when both price breakout of Bollinger Bands upper or lower band and golden/death cross of MAs are met. This utilizes Bollinger Bands’ intuitive support/resistance identification and Moving Averages’ reliable trend determination to complement each other and filters false breakouts effectively. In general, this is a practical strategy, easy to implement, and worthwhile to apply and optimize in live trading.
/*backtest
start: 2024-01-25 00:00:00
end: 2024-02-01 00:00:00
period: 2m
basePeriod: 1m
exchanges: [{"eid":"Futures_Binance","currency":"BTC_USDT"}]
*/

//@version=4
strategy("Bollinger Bands and Moving Averages Strategy", overlay=true)

// Bollinger Bands
length = input(20, minval=1, title="BB Length")
mult = input(2.0, minval=0.1, maxval=5, title="BB Standard Deviation")
src = close
basis = sma(src, length)
dev = mult * stdev(src, length)
upper = basis + dev
lower = basis - dev

// Moving Averages
ma1_length = input(50, minval=1, title="MA1 Length")
ma2_length = input(200, minval=1, title="MA2 Length")
ma1 = sma(src, ma1_length)
ma2 = sma(src, ma2_length)

// Strategy Conditions
longCondition = crossover(src, upper) and crossover(ma1, ma2)
shortCondition = crossunder(src, lower) and crossunder(ma1, ma2)

// Strategy Execution
strategy.entry("Long", strategy.long, when=longCondition)
strategy.entry("Short", strategy.short, when=shortCondition)
strategy.close("Long", when=shortCondition)
strategy.close("Short", when=longCondition)

// Plotting
plot(basis, color=color.blue, title="Basis")
plot(upper, color=color.red, title="Upper")
plot(lower, color=color.green, title="Lower")
plot(ma1, color=color.orange, title="MA1")
plot(ma2, color=color.purple, title="MA2")
- Optimized Moving Average Crossover Strategy
- Isolation Band Oscillation Tracking Strategy
- Double Donchian Channel Breakout Strategy
- CRSI Moving Average Strategy
- Self-adaptive Quant Grid Trading Strategy
- Multi-Timeframe Ichimoku, MACD and DMI Combined Strategy
- Price Divergence Based Trend Trading Strategy
- Supertrend Bitcoin Long Line Strategy
- Trend Following Strategy with Moving Average and Candlestick Patterns
- Quantitative Trading Strategy Based on Ichimoku Cloud Breakout and ADX Index
- Lazy Bear Squeeze Momentum Strategy
- Trend Prediction Dual Moving Average Strategy
- Dual Moving Average Reversal Strategy
- Dual Breakthrough Moving Average Trading Strategy
- Dazzling Bolts Trend Following Strategy
- VRSI and MARSI Strategy
- Stop Loss and Take Profit Strategy Based on Doji Pattern
- Dual Exponential Moving Average Trend Following Strategy
- DMI Balance Buy/Sell Strategy
- Moving Average Displaced Envelope Strategy