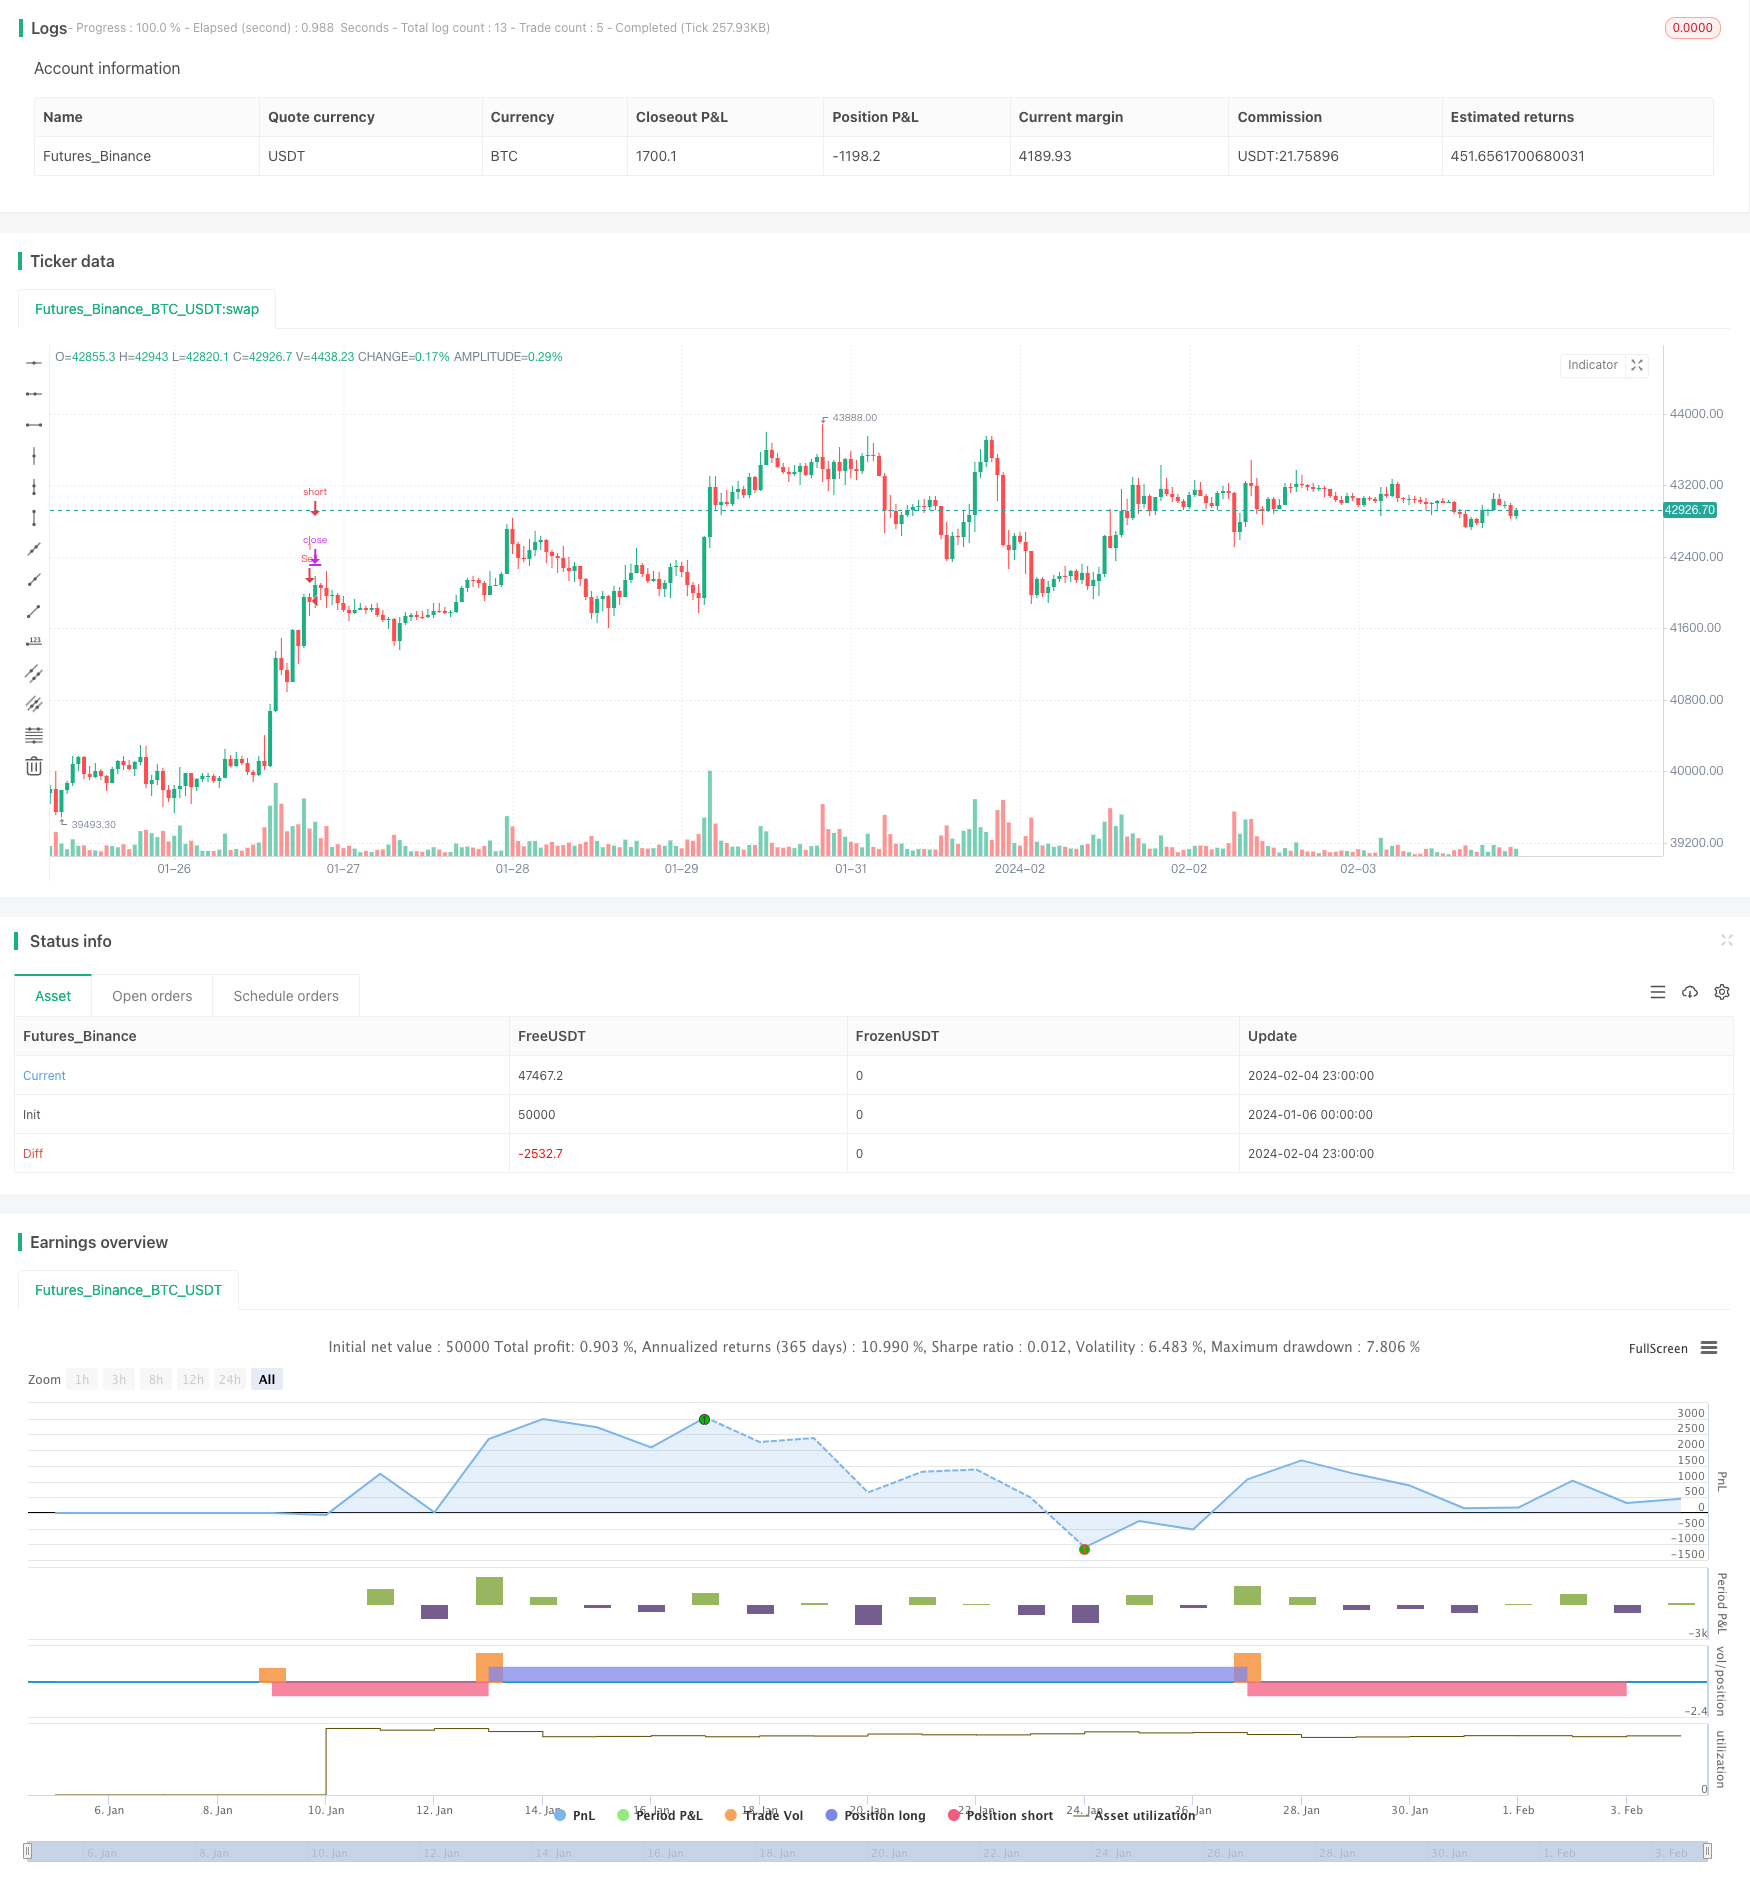
Overview
The strategy is named Bollinger Bands and RSI Double Confirmation Strategy. It aims to buy low and sell high by calculating the upper and lower bands of Bollinger Bands and combining the overbought and oversold signals from RSI.
Strategy Logic
The strategy is mainly based on two indicators: Bollinger Bands and RSI.
Bollinger Bands contain upper band, middle band and lower band, which are constructed by calculating the moving average and standard deviation over a certain period. When the price is close to the upper band, it indicates an overbought area. When close to the lower band, it indicates an oversold area.
RSI is used to determine the timing of bottom rebound and top callback. RSI above 70 is overbought zone and Below 30 is oversold zone.
The trading signals for this strategy are:
- Buy signal: Close price crosses above lower band + RSI below 30
- Sell signal: Close price crosses below upper band + RSI above 70
This avoids false signals from relying on a single indicator and achieves a more reliable low-buying and high-selling strategy.
Advantage Analysis
- Combining Bollinger Bands and RSI provides double confirmation for the signals and avoids false breakout.
- RSI determines overbought and oversold levels, Bollinger Bands determine breakout levels, improving decision accuracy.
- Parameterized Bollinger Bands and RSI parameters can be adjusted for different markets, resulting in strong adaptability.
- Real-time monitoring of price relative to Bollinger Bands, no time lag.
- Achieve low-buying and high-selling, tracking market trends with large profit space.
Risk Analysis
- Improper selection of Bollinger Bands standard deviation may lead to too frequent or too few signals.
- Improper RSI parameter settings may miss the best entry and exit timing.
- Relatively low signal frequency, may unable to open positions for a long time.
- Unable to determine trend direction, with risk of generating reverse signals.
Risk Management Solutions:
- Optimize parameters of Bollinger Bands and RSI to find the best combination.
- Incorporate other indicators to determine trend and signal quality.
- Adjust position sizing appropriately to control single trade loss.
Optimization Directions
- Incorporate moving average to determine trend direction and avoid reverse signals.
- Add stop loss strategies like trailing stop to avoid enlarging losses.
- Add position sizing mechanisms to pyramid along trends and lock short-term profits.
- Conduct parameter optimization for high frequency data to improve signal quality.
- Introduce machine learning models to judge signal quality and reduce false signals.
Summary
The strategy realizes low-buying and high-selling through the dual verification mechanism of Bollinger Bands and RSI, reducing false signals and avoiding missing best entry timing. Meanwhile, the parameterized design increases the adaptability and optimization space. But there are still some risks that need further optimization to improve stability. Overall, the strategy combines the advantages of tracking trends and overbought-oversold levels. With proper parameter tuning and risk control, it has decent profit potential.
/*backtest
start: 2024-01-06 00:00:00
end: 2024-02-05 00:00:00
period: 1h
basePeriod: 15m
exchanges: [{"eid":"Futures_Binance","currency":"BTC_USDT"}]
*/

// This source code is subject to the terms of the Mozilla Public License 2.0 at https://mozilla.org/MPL/2.0/
// © samuelarbos

//@version=4
strategy("Estrategia de Bandas de Bollinger y RSI", overlay=true)

// Definimos los parámetros de las bandas de Bollinger
source = input(close, title="Precio base")
length = input(20, minval=1, title="Longitud")
mult = input(2.0, minval=0.001, maxval=50, title="Desviación estándar")

// Calculamos las bandas de Bollinger
basis = sma(source, length)
dev = mult * stdev(source, length)
upper = basis + dev
lower = basis - dev

// Definimos el RSI y sus parámetros
rsi_source = input(close, title="RSI Fuente")
rsi_length = input(14, minval=1, title="RSI Longitud")
rsi_overbought = input(70, minval=0, maxval=100, title="RSI Sobrecompra")
rsi_oversold = input(30, minval=0, maxval=100, title="RSI Sobrevendido")

// Calculamos el RSI
rsi = rsi(rsi_source, rsi_length)

// Definimos las señales de compra y venta
buy_signal = crossover(close, lower) and rsi < rsi_oversold
sell_signal = crossunder(close, upper) and rsi > rsi_overbought

// Compramos cuando se da la señal de compra
if (buy_signal)
    strategy.entry("Buy", strategy.long)

// Vendemos cuando se da la señal de venta
if (sell_signal)
    strategy.entry("Sell", strategy.short)