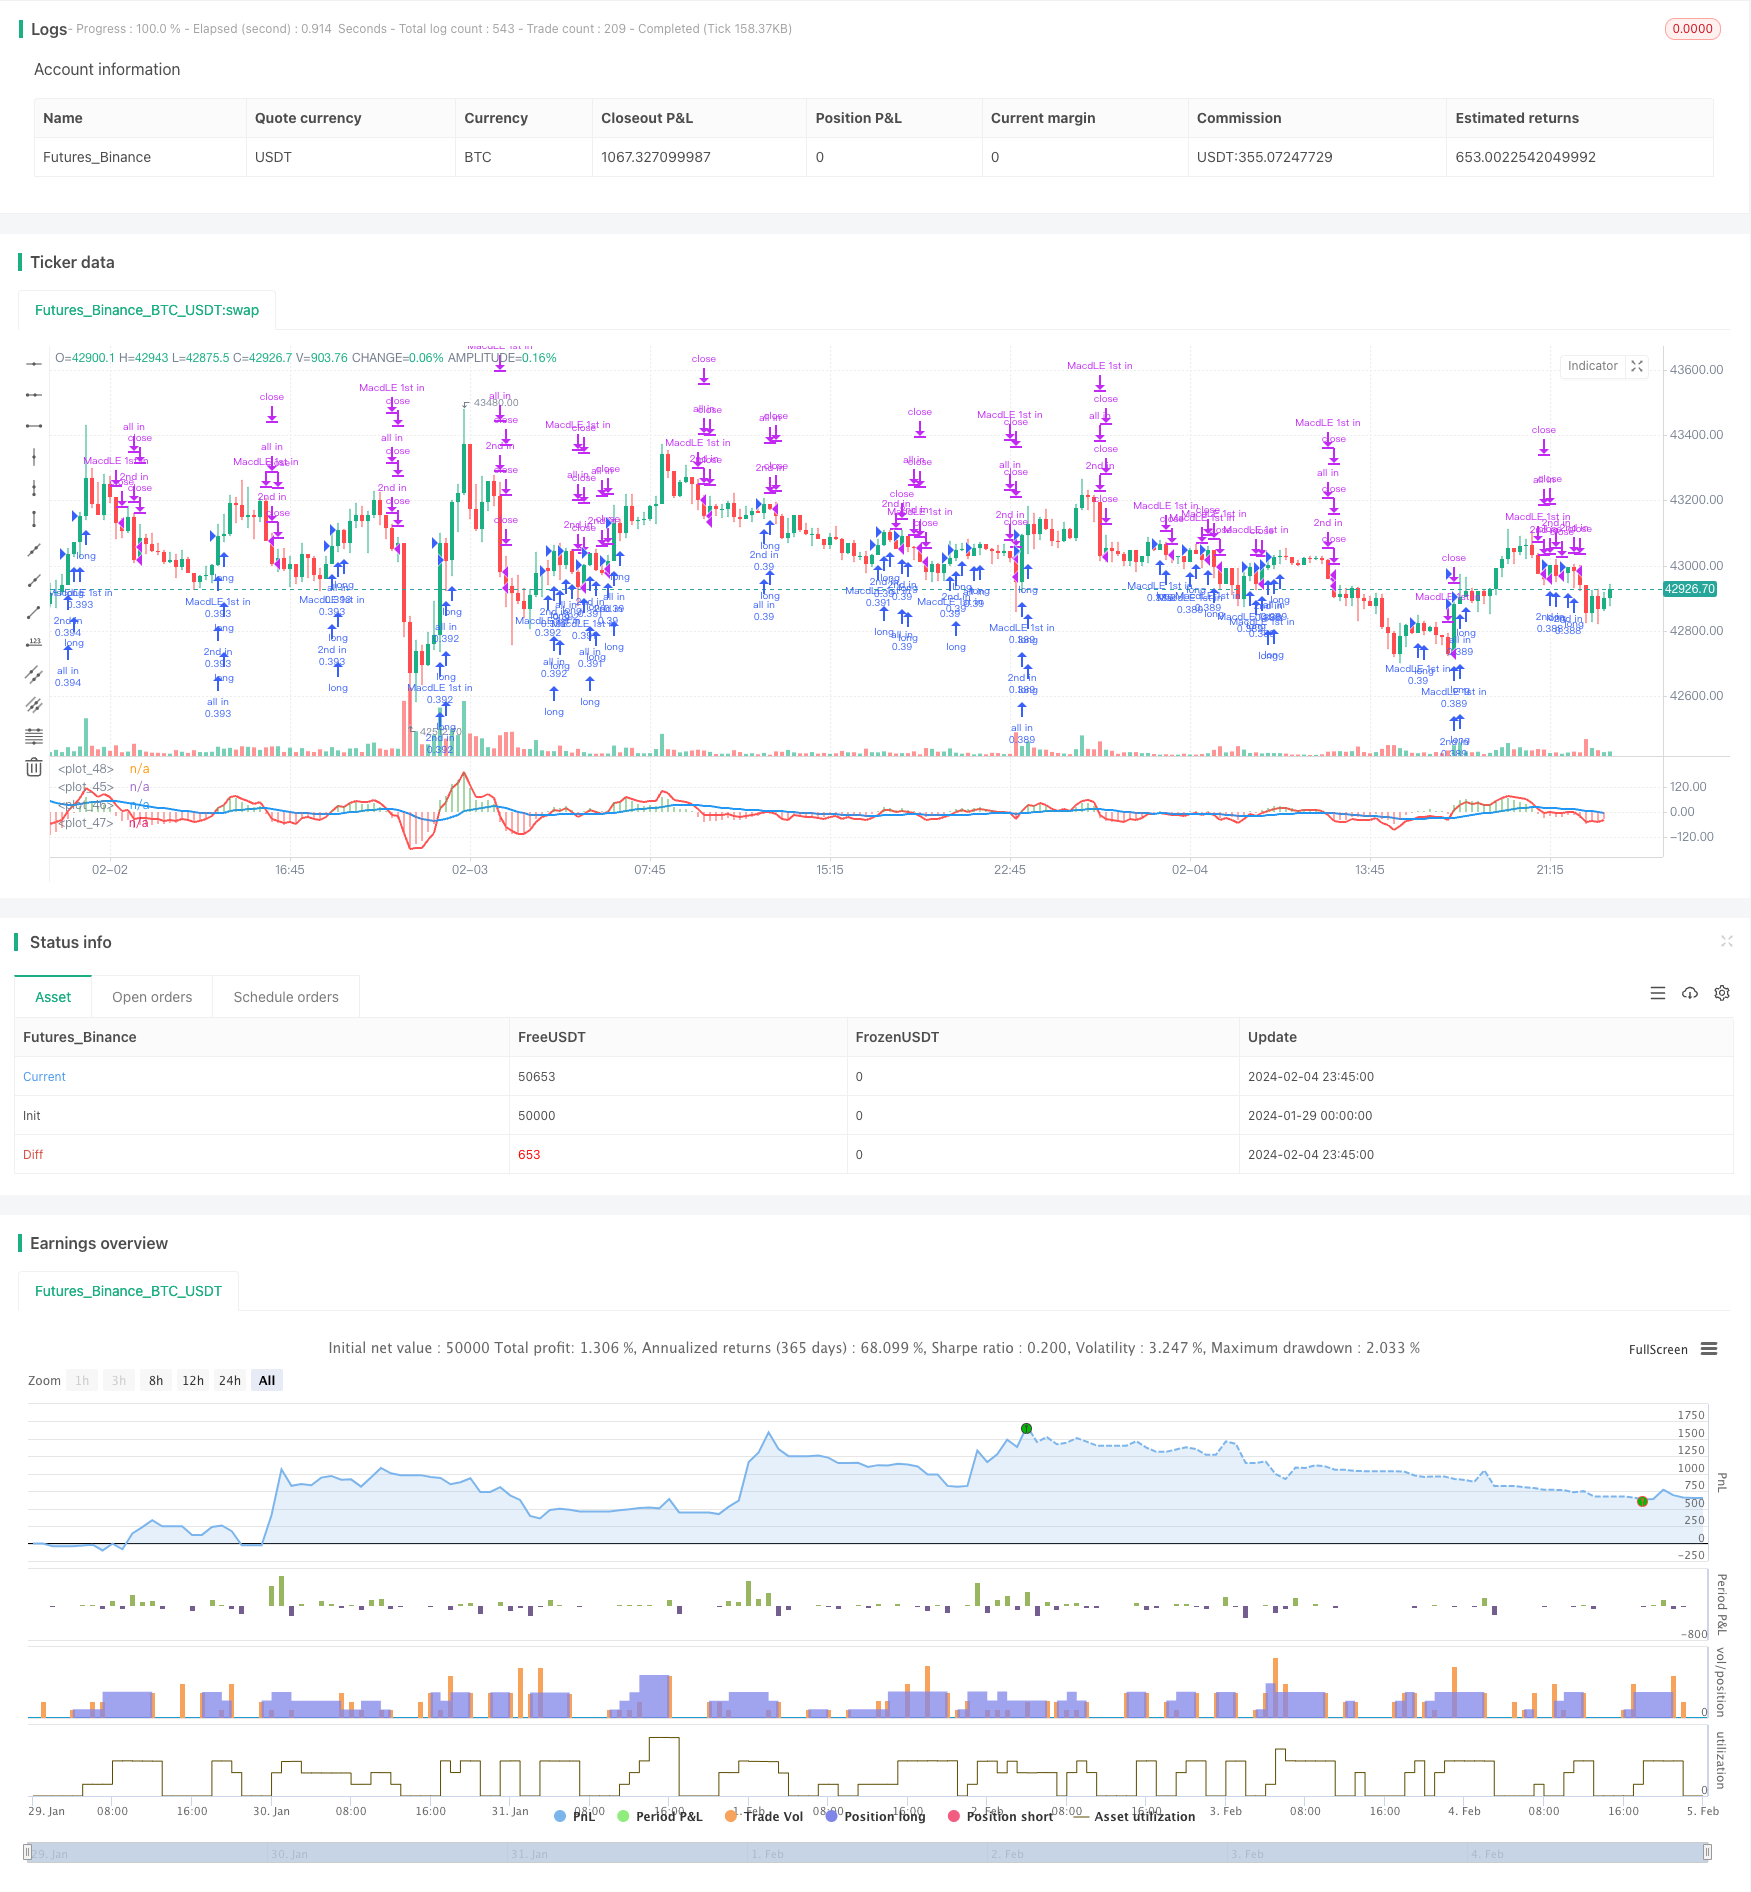
Dynamic EMA and MACD Crossover Strategy
Author: ChaoZhang, Date: 2024-02-06 14:29:23Tags:

Overview
This strategy determines entries and exits based on the crossover situations of the fast EMA line (3), slow EMA line (11) and slower EMA line (18), combined with MACD’s zero line crossovers. It is a dynamic strategy that utilizes the combination of dual EMA and MACD indicators for trading decisions.
Strategy Logic
The strategy is mainly based on two technical analysis indicators:
EMA Crossover. It uses the crossover of fast EMA (3), slow EMA (11) and slower EMA (18) to determine the trend and as entry and exit signals.
MACD Indicator and Its Zero Line Crossover. MACD consists of DIFF and DEA. DIFF is constructed by fast EMA (3) minus slow EMA (11). DEA is the EMA (27) of MACD. MACD>0 indicates bullishness and MACD indicates bearishness. Zero line crossover acts as the entry and exit signal.
According to the combination of EMA crossover and MACD zero line crossover, there are 3 entry opportunities and 2 exit opportunities:
- The first long opportunity occurs when MACD is above zero line and has an upward crossover.
- The second long opportunity occurs when fast EMA (3) crosses above slow EMA (11).
- The third long opportunity with full position occurs when fast EMA (3) crosses above slower EMA (18).
- The first exit signal occurs when fast EMA (3) crosses below slow EMA (11).
- The second exit signal occurs when MACD is below zero line and has a downward crossover.
In summary, this strategy makes full use of the advantages of dual EMA crossover system and MACD indicator. By dynamically tuning the parameters of moving averages and MACD, it can improve the profitability of the strategy.
Advantages of the Strategy
It utilizes the strengths of both EMA crossover and MACD indicator, improving accuracy through dual-indicator confirmation.
There are 3 long entry opportunities and 2 exit opportunities, increasing trading frequency and profit potential.
Large room for dynamic parameter optimization. The lengths of fast EMA, slow EMA, zero line EMA and MACD can all be optimized.
The clear logic makes it easy to debug and optimize.
Risks of the Strategy
Both EMA crossover and MACD indicator have some false signals, which may lead to unnecessary losses.
High trading frequency with small stop loss size in each trade, so losses could accumulate.
Difficulty in parameter optimization. Improper optimization may lead to overfitting.
Impact of trading costs needs to be fully considered.
To mitigate the risks:
Set proper stop loss to limit losses in single trades.
Adjust parameters appropriately to avoid overfitting.
Consider trading costs impact, like reducing trading frequency.
Directions for Optimization
Test alternatives like Bollinger Bands, KDJ etc.
Optimize EMA crossover parameters: Changing length of fast and slow EMA.
Optimize MACD parameters: Changing DIFF and DEA calculation EMA lengths.
Add stop loss strategies: number of trades stops, time stops, trailing stops etc.
Adjust entry frequency considering trading costs.
Summary
This strategy combines dual EMA crossover system and MACD indicator to construct a dynamic parameter strategy with high trading frequency and strong profitability. Also, the clear logic makes it easy to understand and optimize. But there are also risks of false signals and overfitting that need addressing via proper stop loss, anti-overfitting measures etc. Overall, the strategy has great practical utility.
/*backtest
start: 2024-01-29 00:00:00
end: 2024-02-05 00:00:00
period: 15m
basePeriod: 5m
exchanges: [{"eid":"Futures_Binance","currency":"BTC_USDT"}]
*/

//@version=4
strategy("MACD+EMA crossovers Strategy custom",initial_capital=10000,max_bars_back=150,commission_type=strategy.commission.percent , commission_value=0.1, shorttitle="MACD+EMAcross",pyramiding = 10,default_qty_type=strategy.percent_of_equity,default_qty_value=33,overlay=false)

short = ema(close,3)
long = ema(close, 11)
long2 = ema(close, 18)
//plot(short, color = red, linewidth = 4)
//plot(long, color = blue, linewidth = 4)
//plot(long2, color = green, linewidth = 4)

isCross1 = crossover(short, long)
isCross2 = crossover(short, long2)
isCrossSell = crossunder(short, long)
//isCross3 = crossover(long, long2)

//plotshape(isCross1 and not isCross2, color=lime, style=shape.arrowup, text="1st in",size = size.tiny, location = location.belowbar)
//plotshape(isCross2 , color=lime, style=shape.arrowup, text="2nd in",size = size.tiny, location = location.belowbar)

//plotshape(isCross3 , color=lime, style=shape.arrowdown, text="All in",size = size.normal, location = location.abovebar)

//plotshape(isCrossSell , color=red, style=shape.arrowdown, text="SELL",size = size.small, location = location.abovebar)

fastLength = input(3)
slowlength = input(11)
MACDLength = input(27)

MACD = ema(close, fastLength) - ema(close, slowlength)
aMACD = ema(MACD, MACDLength) //signal
delta = MACD - aMACD // histograma

strategy.entry("MacdLE 1st in", strategy.long, comment="MacdLE 1st in",when=crossover(delta, 0))

strategy.entry("2nd in", strategy.long, comment="2nd in",when=isCross1)

strategy.entry("all in", strategy.long, comment="all in",when=isCross2)

strategy.close("2nd in",when=isCrossSell)
strategy.close("all in",when=isCrossSell)
//strategy.close("2nd in",when=crossunder(delta, 0))
//strategy.close("all in",when=crossunder(delta, 0))
strategy.close("MacdLE 1st in",when=crossunder(delta, 0))

histColour = (delta > 0) ? green : (delta < 0) ? red :  #4169E1

plot(MACD,color=red,linewidth=2)
plot(aMACD,color=blue,linewidth=2)
plot(delta,style=histogram, color=histColour, linewidth=10)
plot(0,color=white)
- Three Candle Reversal Trend Strategy
- Adaptive Dual Breakthrough Trading Strategy
- Quantitative Trading Strategy for Bottom Reversal
- Momentum Trend Optimization Combination Strategy
- Multiple Moving Average Bollinger Bands Strategy
- Crossing Moving Average Breakout Strategy
- SuperTrend Trailing Stop Strategy Based on Heikin Ashi
- Dual Moving Average With Momentum Breakout Strategy
- Bollinger Band Breakout Strategy Based on VWAP
- Fibonacci Retracement Dynamic Stop Loss Strategy
- Double Momentum Index and Reversal Hybrid Strategy
- TD Sequential Dual-Direction S/R Trading Strategy
- SuperTrend Quantitative Trading Strategy for Bitcoin
- A Short-term Strategy Combining RSI Indicator and Price Breakthrough
- Richard's Turtle Trading Strategy
- Dynamic Slope Trend Line Trading Strategy
- Advanced RSI Indicator Trading Strategy
- RSI Indicator Cross Cycle Profit and Stop Loss Strategy
- Trend Tracking Strategy Based on Moving Average Crossover
- RSI and Bollinger Bands Fusion Trading Strategy for LTC