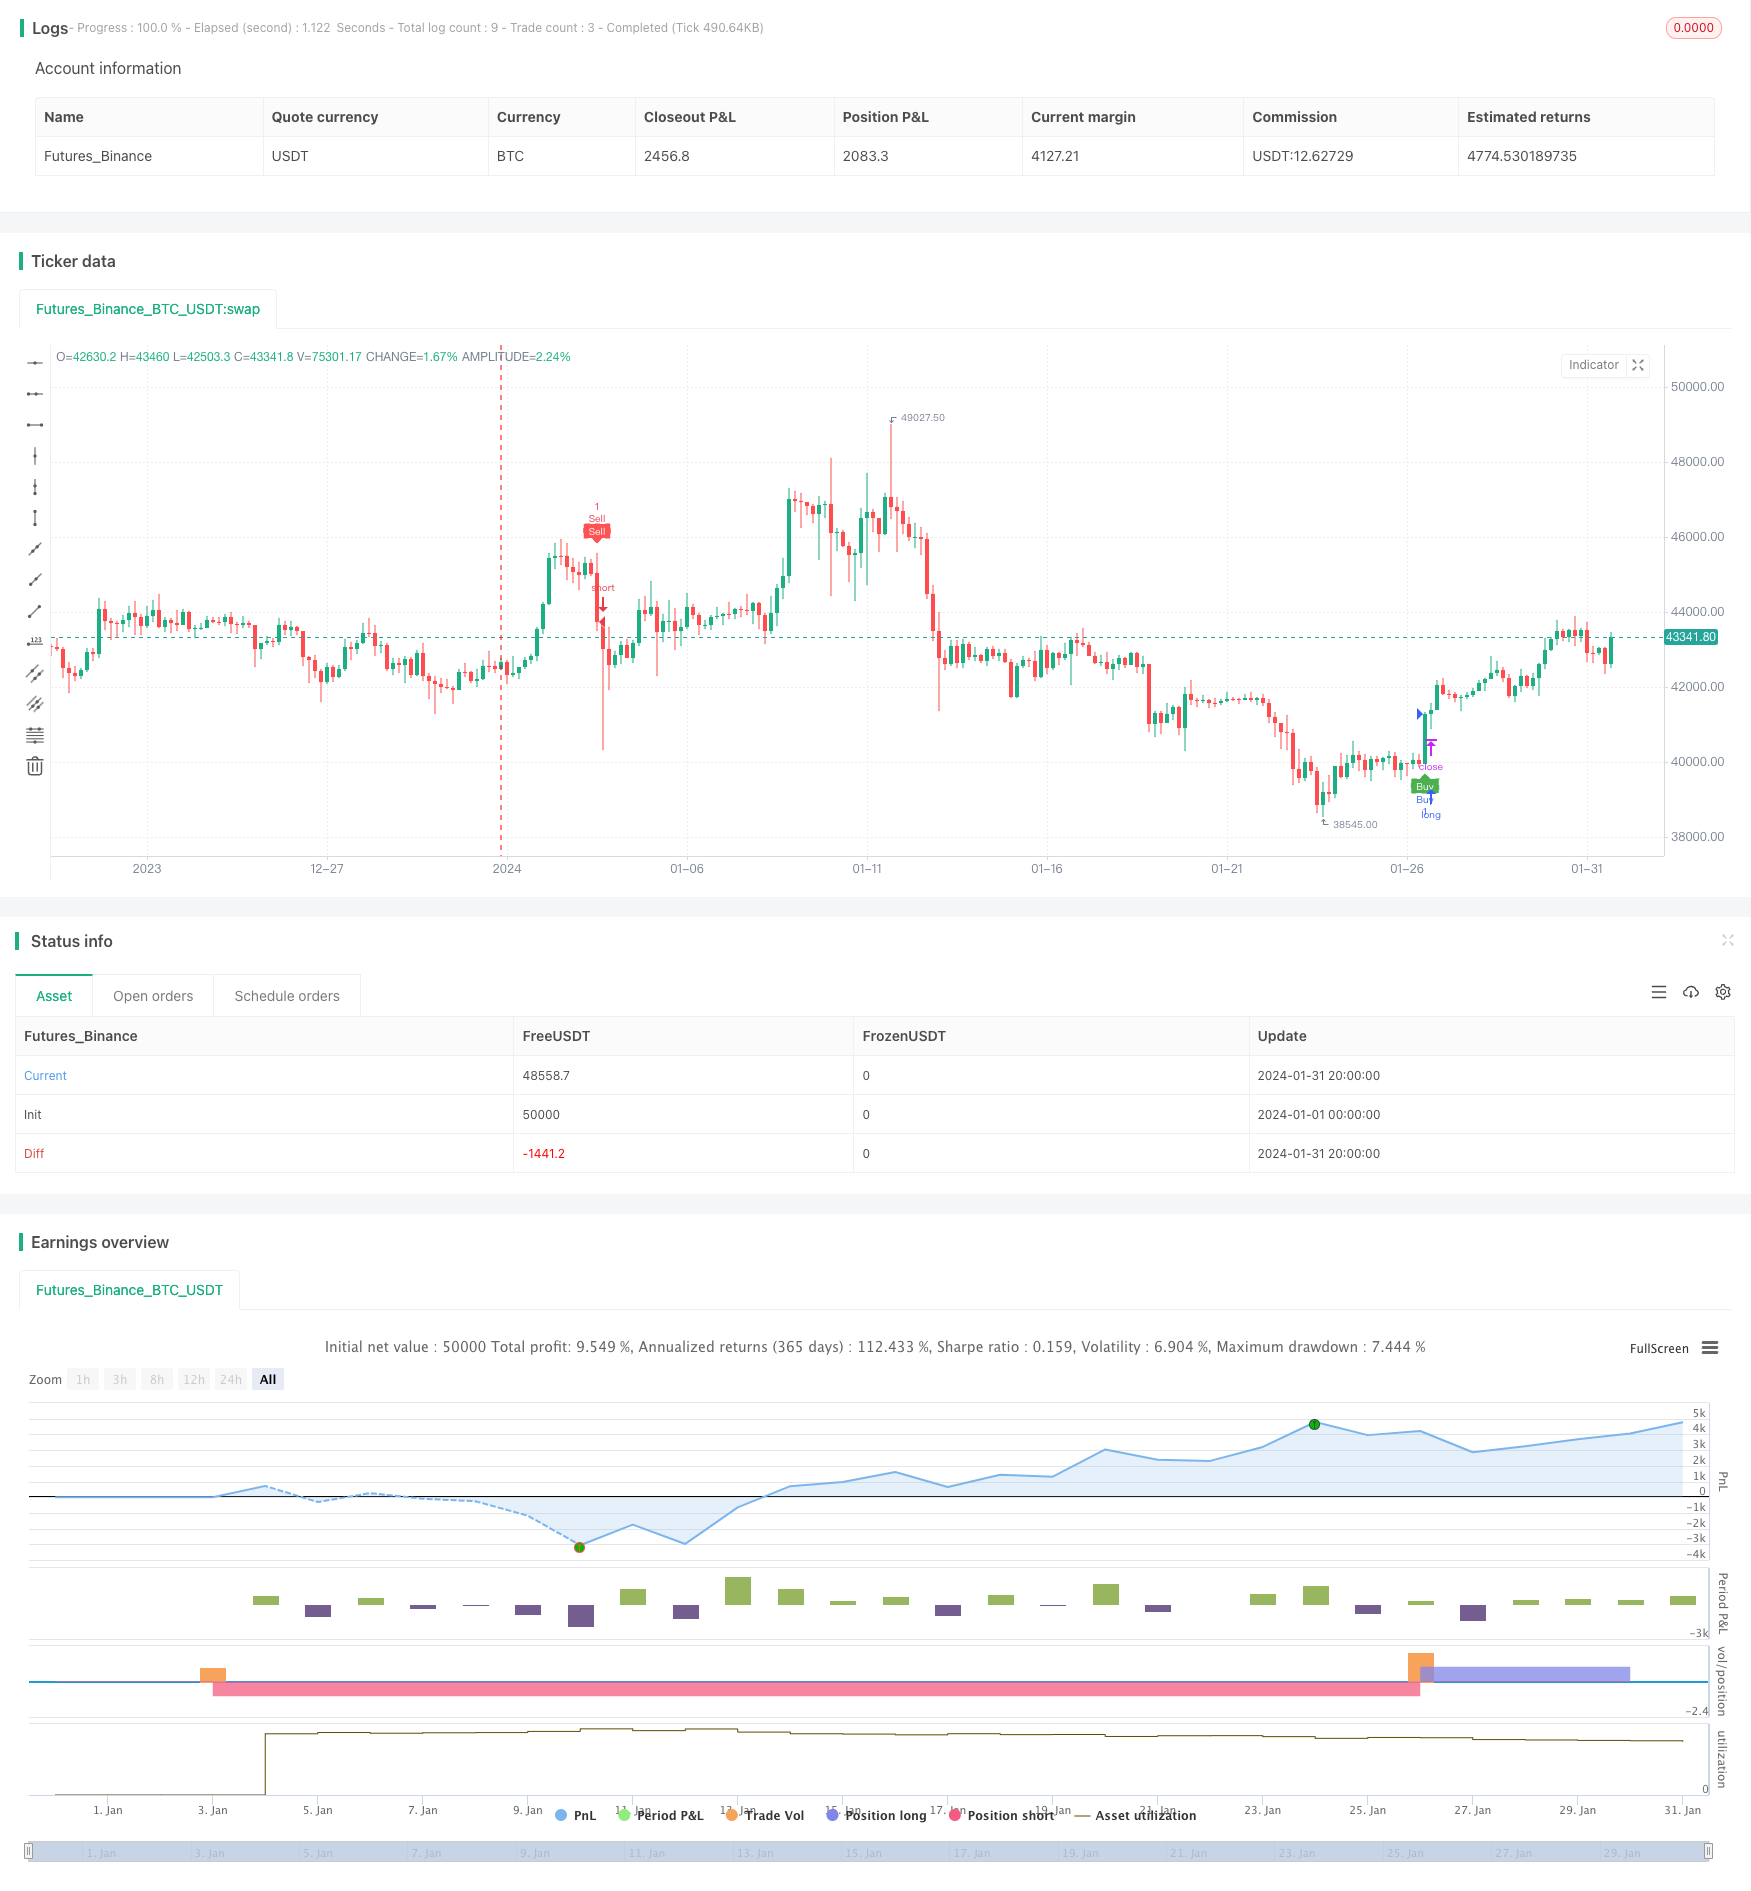
Overview
This strategy generates trading signals by calculating the Directional Movement Indexes (DMI) DI+ and DI- along with Average Directional Index (ADX) and Exponential Moving Average (EMA). It triggers a long signal when DI+ crosses above DI- and ADX is above 20. A short signal is triggered when DI- crosses below DI+ and ADX is above 25. The stop loss signal is when DI- crosses above DI+ with ADX above 30.
Strategy Logic
Calculate DI+, DI-, ADX
- Use ta.dmi() to compute DI+, DI-, ADX
- DI+/DI- measures directional price movement
- ADX measures strength of price movement
Calculate Exponential Moving Average
- Use custom my_ema() function to compute EMA
- EMA smoothes price data
Generate trading signals
- Long signal: DI+ crosses above DI- and ADX > 20 and close > EMA
- Indicates upward trend and increased volatility
- Indicates upward trend and increased volatility
- Short signal: DI- crosses below DI+ and ADX > 25 and close < EMA
- Indicates downward trend and high volatility
- Long signal: DI+ crosses above DI- and ADX > 20 and close > EMA
Set stop loss
- Long stop loss: DI- crosses above DI+ and ADX > 30
- Indicates trend reversal
- Indicates trend reversal
- Short stop loss: DI+ crosses below DI- and ADX > 30
- Indicates trend reversal
- Indicates trend reversal
- Long stop loss: DI- crosses above DI+ and ADX > 30
In summary, this strategy combines momentum and trend analysis indicators to trade when strong price trends emerge, with stop losses to limit losses.
Advantage Analysis
- Dual DI avoids false signals
- Single DI can give false signals, dual DI ensures trend
- Single DI can give false signals, dual DI ensures trend
- ADX threshold requires increased volatility
- Only trades high volatility moves, avoids ranging
- Only trades high volatility moves, avoids ranging
- EMA complements DI
- EMA identifies mid/long term trends
- Strict stop loss
- Cuts losses quickly
- Cuts losses quickly
Risk Analysis
- Frequent stop loss
- Volatile swings may trigger frequent stops
- Parameter dependence
- Optimal DI and ADX parameters need to be found
- Low trade frequency
- Strict rules reduce trades
Can optimize by expanding stop loss, tuning parameters, adding filters to increase frequency.
Optimization Opportunities
- Parameter optimization
- Optimize DI and ADX parameters
- Optimize DI and ADX parameters
- Add filters
- Volume, divergence etc.
- Widen stop loss
- Relax stops to reduce frequency
- Relax stops to reduce frequency
Conclusion
This strategy combines momentum and trend analysis indicators to trade strong trends, with strict stops to control risk. Can further improve performance through parameter optimization, additional filters, and relaxed stops.
/*backtest
start: 2024-01-01 00:00:00
end: 2024-01-31 23:59:59
period: 4h
basePeriod: 15m
exchanges: [{"eid":"Futures_Binance","currency":"BTC_USDT"}]
*/

// This Pine Script™ code is subject to the terms of the Mozilla Public License 2.0 at https://mozilla.org/MPL/2.0/
// © Tamil_FNO_Trader

//@version=5
strategy("Overlay Signals by TFOT", overlay=true)

// Calculate DMI
len = input.int(14, minval=1, title="DI Length")
lensig = input.int(14, title="ADX Smoothing", minval=1, maxval=50)
[diplus, diminus, adx] = ta.dmi(len, lensig)

// Get EMA
emalen = input.int(26, minval=1, title = "EMA Length")
emasrc = input.source(close, title = "EMA Source")

my_ema(src, length) =>
    alpha = 2 / (length + 1)
    sum = 0.0
    sum := na(sum[1]) ? src : alpha * src + (1 - alpha) * nz(sum[1])
EMA2 = my_ema(emasrc, emalen)

// Variables
var bool buycondition1 = false
var bool sellcondition1 = false

var int firstbuybar = na
var int firstsellbar = na

var int buyexitbar = na
var int sellexitbar = na

var bool buyexit1 = false
var bool sellexit1 = false

// Buy & Sell Conditions
buycondition1 := (ta.crossover(diplus, diminus)) and (adx > 20) and (close > EMA2) and na(firstbuybar)
sellcondition1 := (ta.crossover(diminus, diplus)) and (adx > 25) and (close < EMA2) and na(firstsellbar)

buyexit1 := ta.crossover(diminus, diplus) and (adx > 30) and na(buyexitbar)
sellexit1 := ta.crossover(diplus, diminus) and (adx > 30) and na(sellexitbar)

if buycondition1
    if(na(firstbuybar))
        firstbuybar := bar_index
        buyexitbar := na
        firstsellbar := na
        strategy.entry("Buy", strategy.long)

if sellcondition1
    if(na(firstsellbar))
        firstsellbar := bar_index
        sellexitbar := na
        firstbuybar := na
        strategy.entry("Sell", strategy.short)

if buyexit1 and not na(firstbuybar)
    if(na(buyexitbar))
        buyexitbar := bar_index
        firstbuybar := na
        firstsellbar := na
        strategy.close("Buy")

if sellexit1 and not na(firstsellbar)
    if(na(sellexitbar))
        sellexitbar := bar_index
        firstsellbar := na
        firstbuybar := na
        strategy.close("Sell")

// Plot signals on chart
hl = input.bool(defval = true, title = "Signal Labels")

plotshape(hl and buycondition1 and bar_index == firstbuybar ? true : na, "Buy", style = shape.labelup, location = location.belowbar, color = color.green, text = "Buy", textcolor = color.white, size = size.tiny)
plotshape(hl and sellcondition1 and bar_index == firstsellbar ? true : na, "Sell", style = shape.labeldown, location = location.abovebar, color = color.red, text = "Sell", textcolor = color.white, size = size.tiny)

plotshape(hl and buyexit1 and bar_index == buyexitbar ? true : na, "Buy Exit", style = shape.labelup, location = location.belowbar, color = color.red, text = "Buy X", textcolor = color.white, size = size.tiny)
plotshape(hl and sellexit1 and bar_index == sellexitbar ? true : na, "Sell Exit", style = shape.labeldown, location = location.abovebar, color = color.red, text = "Sell X", textcolor = color.white, size = size.tiny)