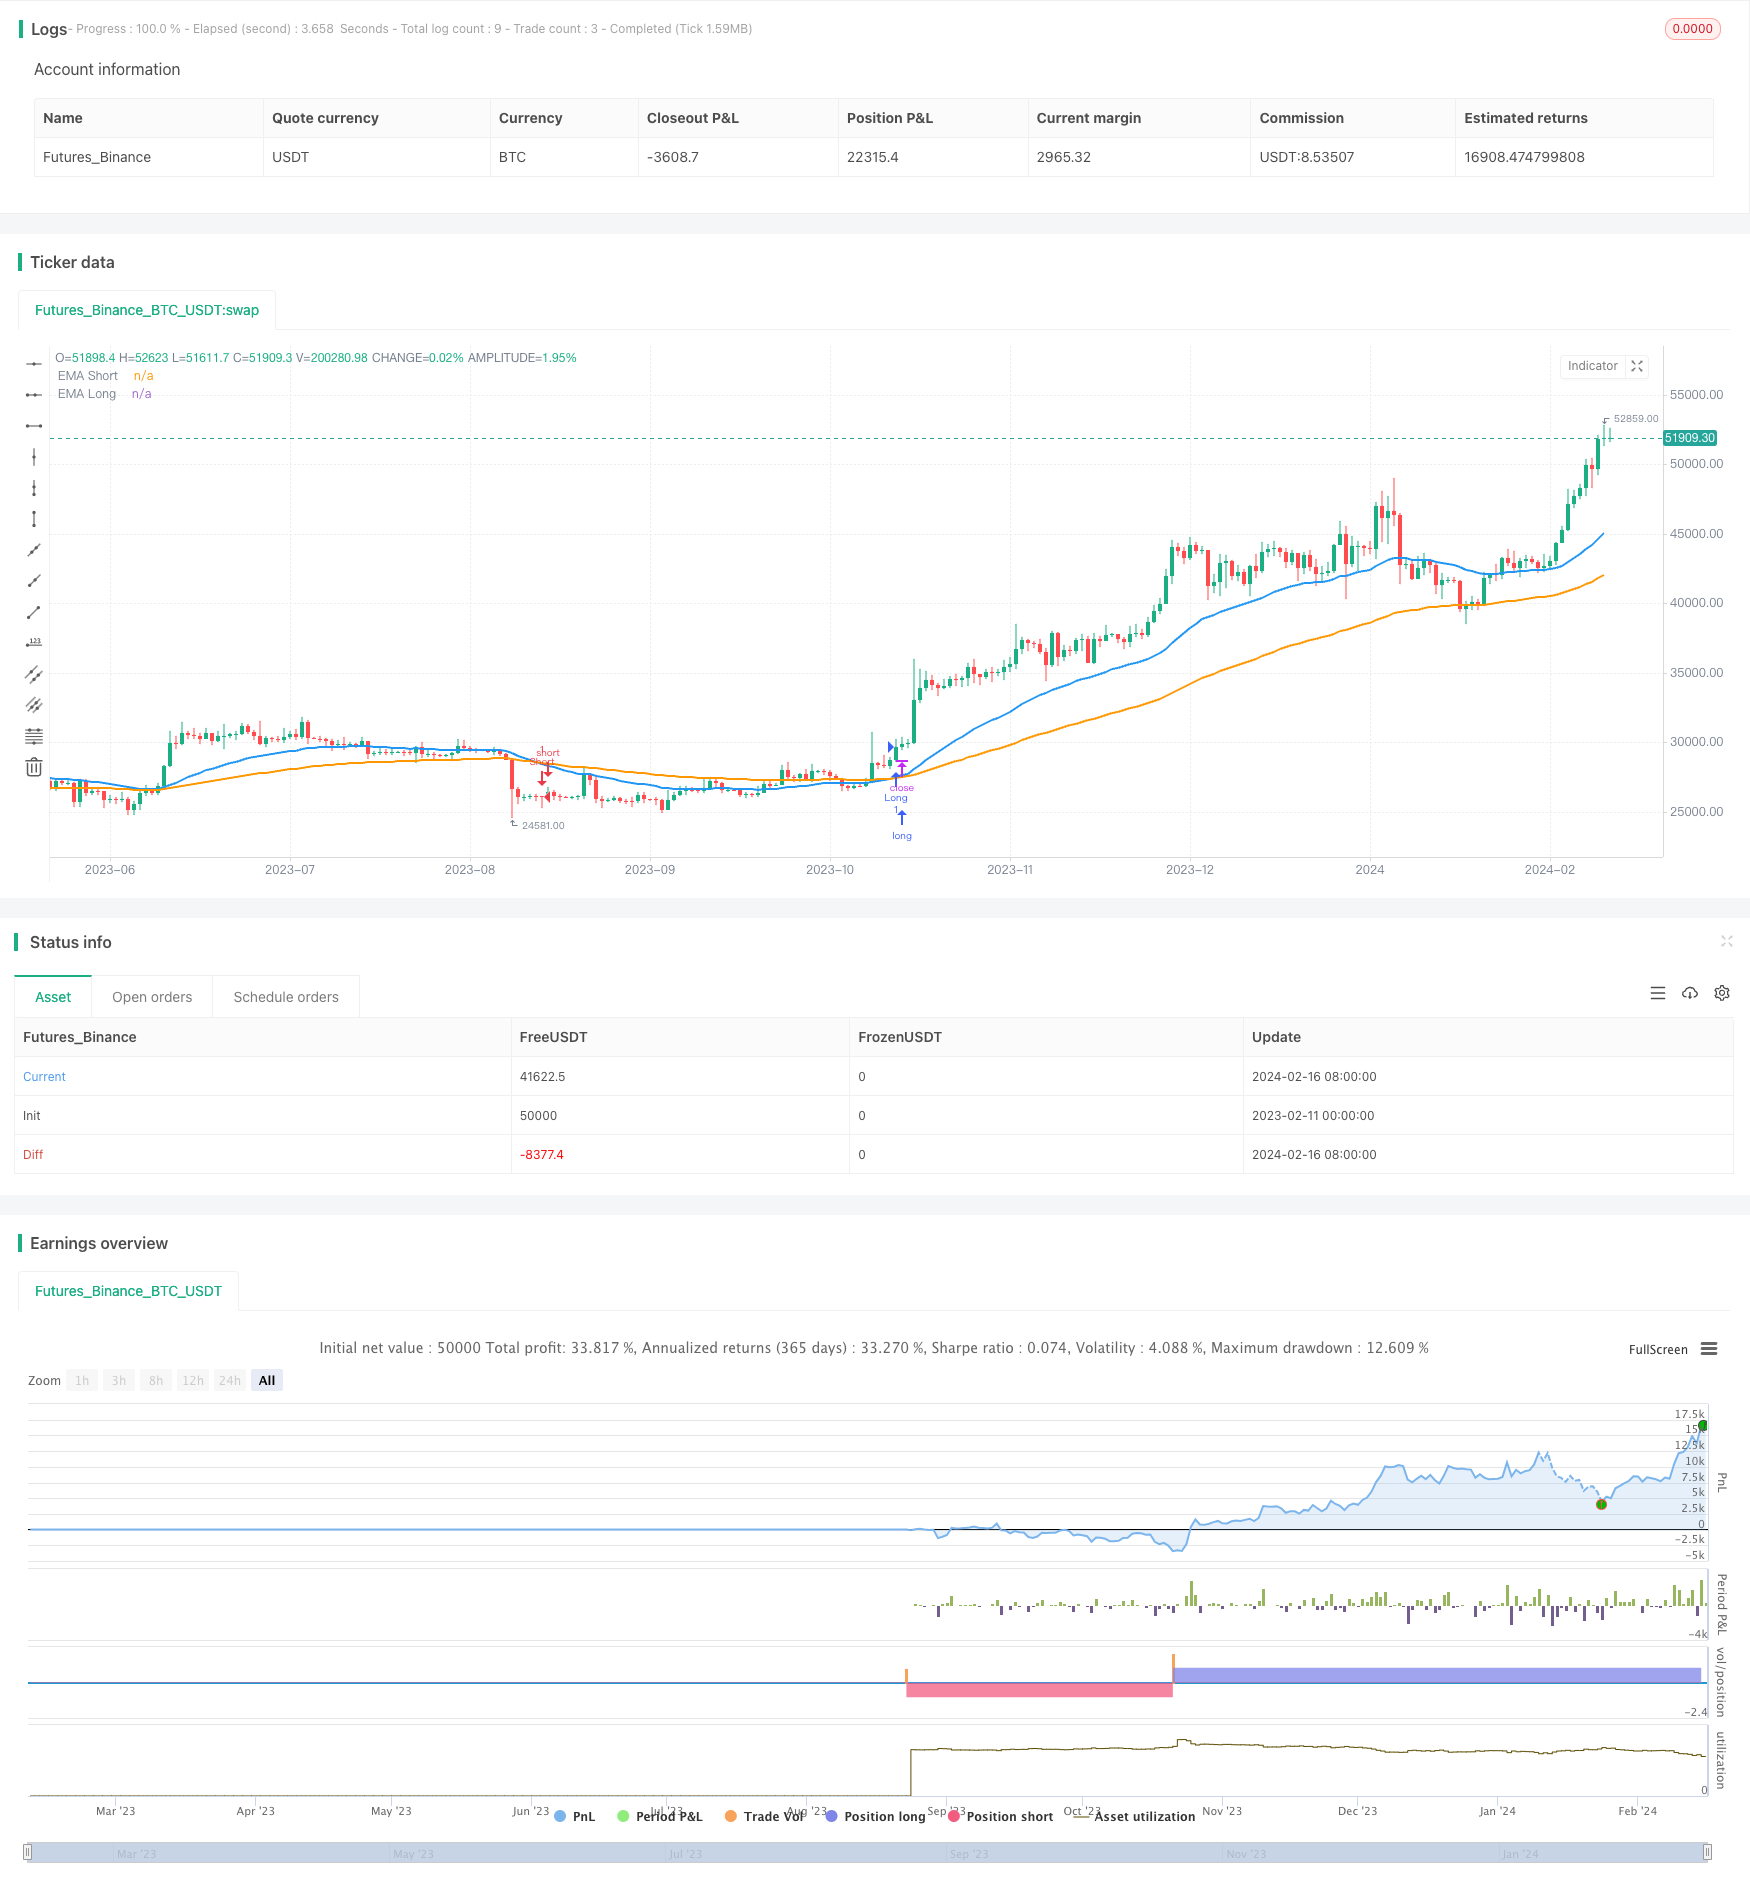
Overview
This strategy calculates two EMAs with different periods and compares their size relationship to determine the trend of the market and achieve trend following. When the short-period EMA crosses above the long-period EMA, the market is judged to be in an upward trend and the strategy goes long. When the short-period EMA crosses below the long-period EMA, the market is judged to be in a downward trend and the strategy goes short.
Strategy Principle
The core indicator of this strategy is the Exponential Moving Average (EMA). The EMA indicator can filter out market noise and reflect true trend changes. This strategy uses two EMAs with different parameters, a 34-period short-term EMA and an 89-period long-term EMA.
When the short-term EMA crosses above the long-term EMA from below, it indicates that the short-term trend begins to dominate the long-term trend and prices enter an upward channel. This is the strategy’s long signal. When the short-term EMA crosses below the long-term EMA from above, it indicates that the short-term trend begins to reverse the long-term trend and prices enter a downward channel. This is the strategy’s short signal. In this way, the strategy takes full advantage of the crossover of the two EMAs to capture trend signals from price changes.
After going long or short, the strategy will hold the position until the opposite signal appears. For example, after going long, when the short EMA crosses below the long EMA, which is a short signal, the long position will be closed and a short position will be opened. This allows smoothly exiting profitable long positions and timely shorting in the reverse direction to maximize locking in trend profits.
Advantage Analysis
The biggest advantage of this strategy is that it fully utilizes EMA cross formations to determine changes in market trends, accurately going long and short, so as to better track trends. Specifically, the main advantages are reflected in the following aspects:
Use the EMA tool to determine the main price trend change. The moving average is better than the basic moving average tools in terms of trend and additional smoothing.
Adopt a dual EMA structure to filter out some noise and make the signal more stable and reliable.
The EMA cycle parameters are adjustable and can be flexibly adapted to market characteristics to obtain more precise trading signals.
Hold positions along the trend to avoid trading against the trend, which can reduce trading risk.
Make full use of trend profits. Once profitable, take profits in time to avoid reversal losses.
Risk Analysis
The main risks faced by this strategy are:
Although EMAs can effectively filter out noise and determine the trend direction, frequent losing signals interspersed may occur in range-bound markets, leading to excessively frequent trading, increasing transaction costs and risks.
Improper selection of EMA cycle parameters may cause signal lag, missing the best entry point.
Unable to determine the inflection point and reversal time of the trend, there is a risk of being trapped before the turn comes.
In response to the above risks, the following countermeasures can be taken:
In range-bound markets, appropriately loosen the stop loss to reduce losses, or skip trading altogether waiting for a clear trend.
Optimize the selection of EMA cycle parameters to find the optimal parameter combination. Introduce an adaptive EMA to dynamically adjust the cycle.
Increase additional indicators to determine the end of the trend and structural turning points to avoid being trapped. Typical combinations can consider introducing MACD, KDJ, MA and so on.
Optimization Directions
There is room for further optimization of this strategy, which can be done mainly from the following aspects:
Further optimize the selection of EMA cycles to find the optimal parameter combination. Dynamic cycles and adaptive EMAs can be considered.
Increase stop loss strategies such as moving stop loss, time stop loss, volatility stop loss, etc. to control the risk of single trades.
Increase additional indicators to determine market structure and avoid the risk of being trapped. Typical ones include MACD, KDJ, MA and so on.
Adjust strategy parameters according to structural fluctuations at large cycle levels. Specifically, multi-parameter combinations for trending markets and short parameter combinations for range-bound markets.
Incorporate position management to dynamically adjust position size based on capital utilization, return rate and other indicators.
Summary
The core idea of this strategy is simple and clear, using EMA indicator crosses to determine market trend changes for going long and short. The strategy has advantages in using EMA tools to determine trends, holding positions along the trend, and taking advantage of trends. But there are also problems such as cycle selection and capturing inflection points. These issues all provide direction for further optimization of the strategy. By introducing a variety of technical indicators to enrich the basis for the strategy’s judgments, the strategy can be made more stable and efficient.
/*backtest
start: 2023-02-11 00:00:00
end: 2024-02-17 00:00:00
period: 1d
basePeriod: 1h
exchanges: [{"eid":"Futures_Binance","currency":"BTC_USDT"}]
*/

//@version=5
strategy("Simple Moving Average Strategy", overlay=true)

// Input for EMA lengths
emaShortLength = input.int(34, title="Short EMA Length")
emaLongLength = input.int(89, title="Long EMA Length")

// Calculate EMAs based on inputs
emaShort = ta.ema(close, emaShortLength)
emaLong = ta.ema(close, emaLongLength)

// Plot the EMAs
plot(emaShort, color=color.blue, linewidth=2, title="EMA Short")
plot(emaLong, color=color.orange, linewidth=2, title="EMA Long")

// Generate long and short signals
longCondition = ta.crossover(emaShort, emaLong)
shortCondition = ta.crossunder(emaShort, emaLong)

// Enter long positions
if (longCondition)
    strategy.entry("Long", strategy.long)

// Enter short positions
if (shortCondition)
    strategy.entry("Short", strategy.short)

// Close long positions
if (shortCondition)
    strategy.close("Long")

// Close short positions
if (longCondition)
    strategy.close("Short")