Moving Average Breakout and Bollinger Band Breakout Strategy
Author: ChaoZhang, Date: 2024-02-19 14:18:00Tags:

Overview
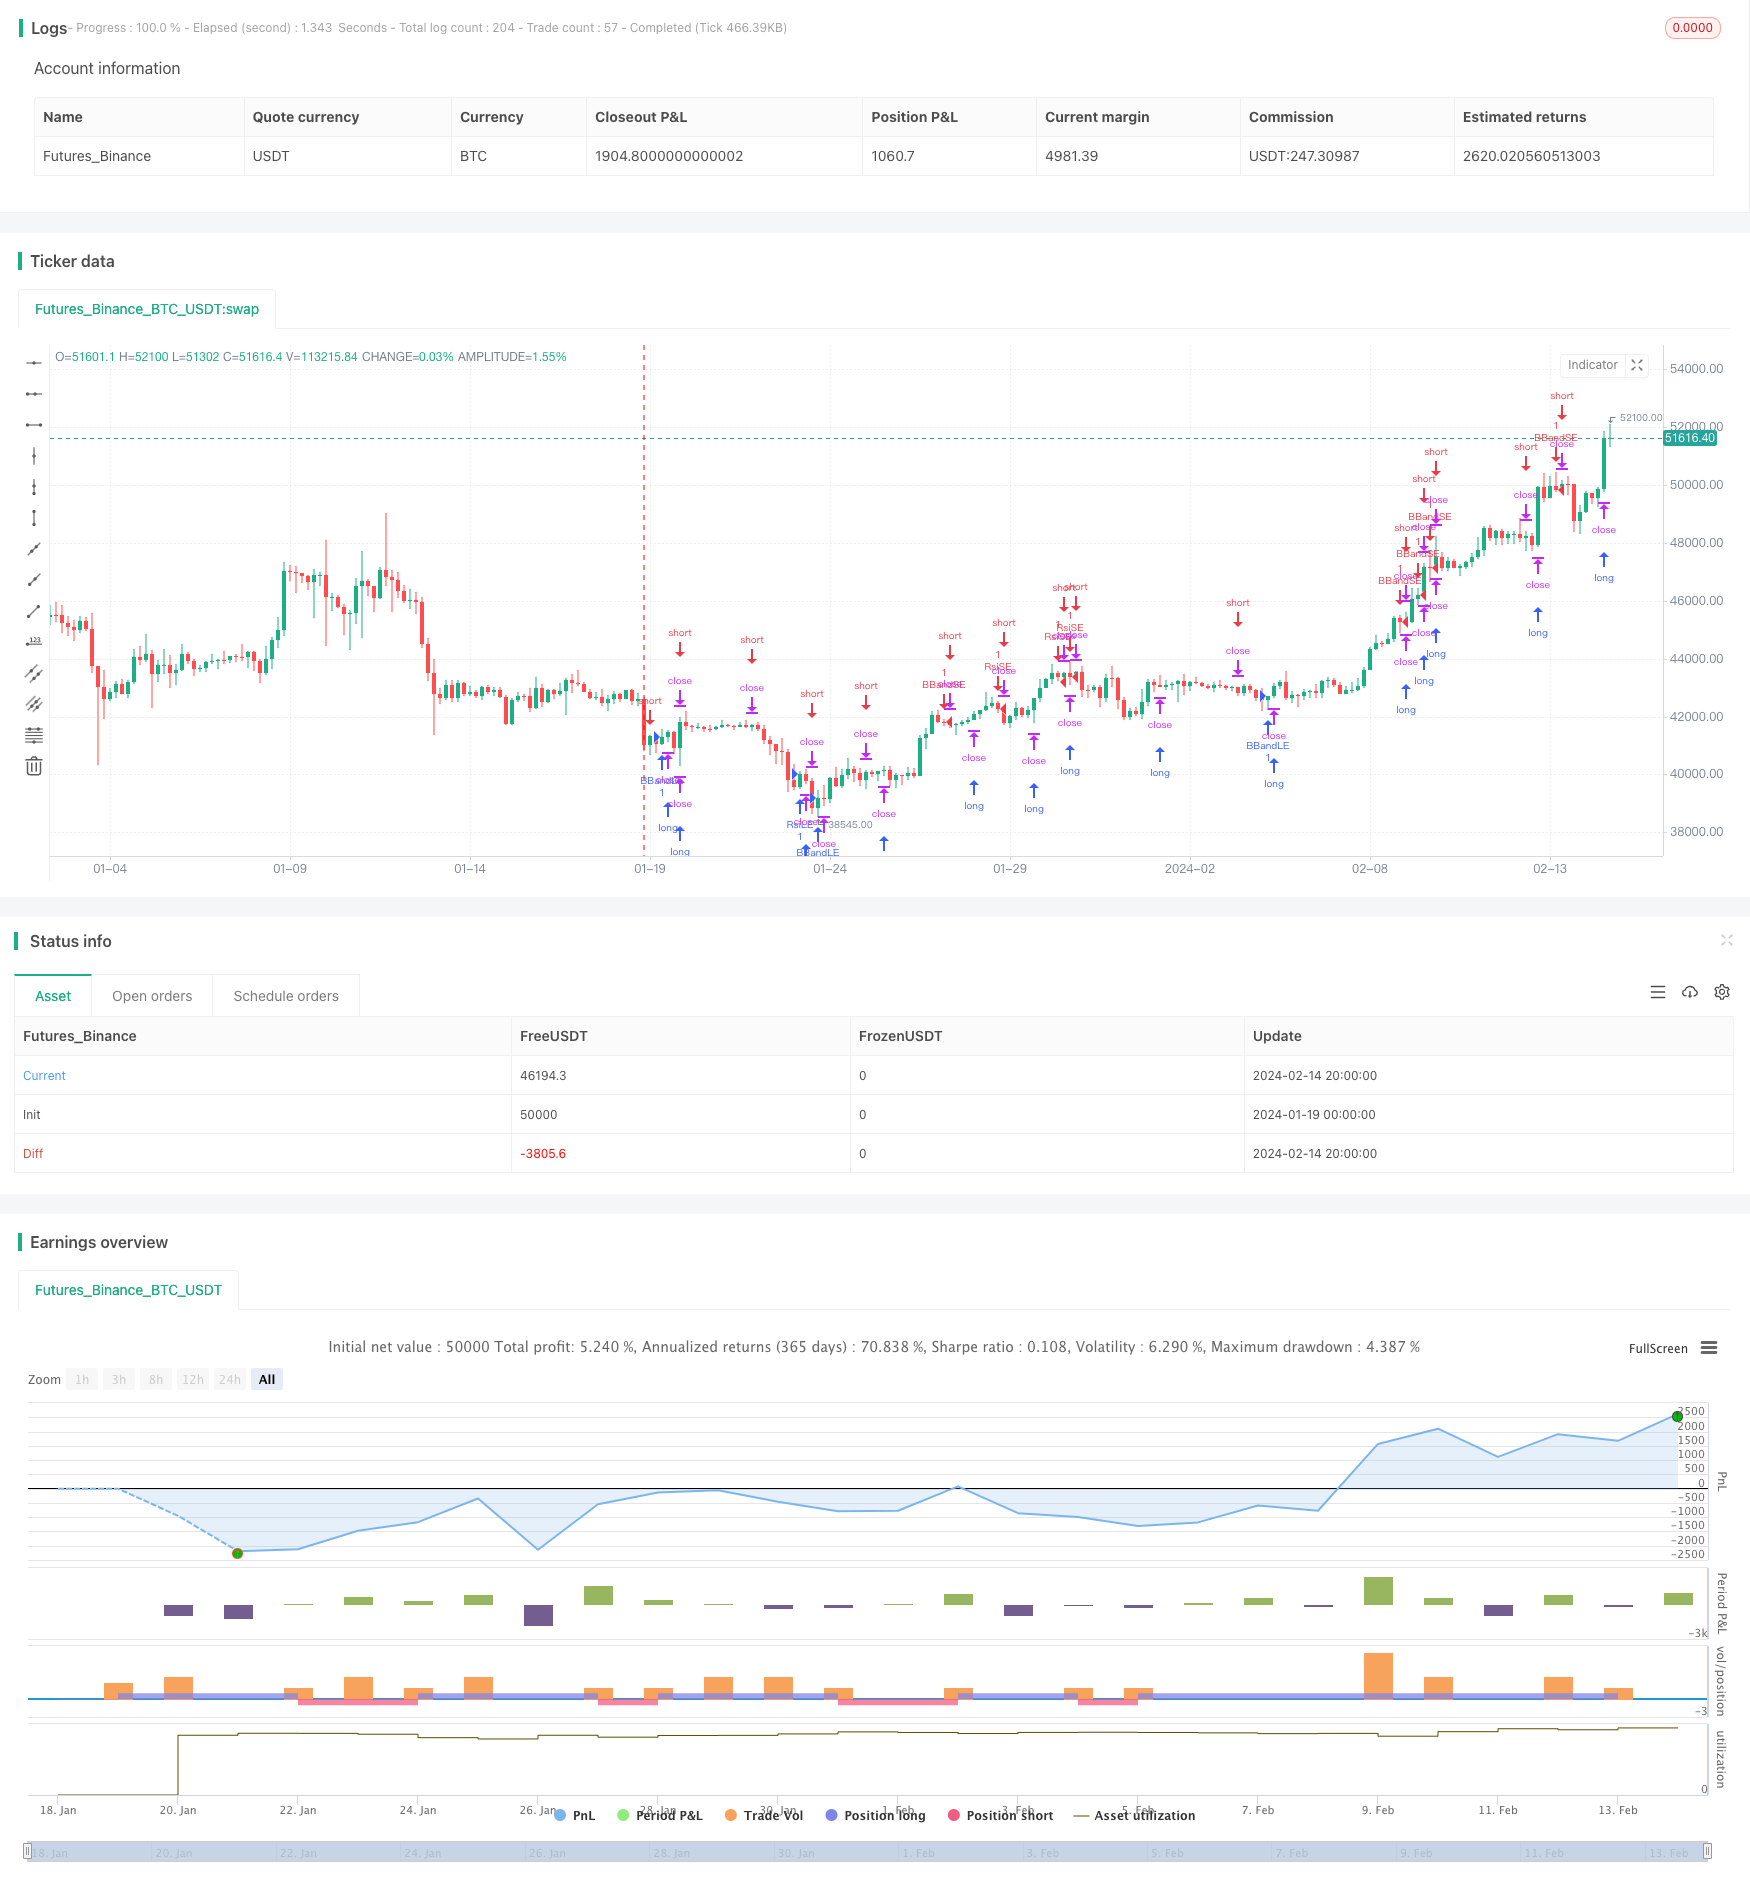
This strategy combines the use of RSI indicator to identify overbought and oversold signals, Bollinger Bands to determine price breakouts, and moving average crossovers to judge the market in different trend stages, in order to profit.
Strategy Logic
The strategy consists of the following main indicators:
RSI indicator: When the RSI line crosses over the overbought threshold or crosses below the oversold threshold, long or short trades are placed accordingly.
Bollinger Bands: When price breaks through the Bollinger upper band, a short trade is placed; when price breaks down the Bollinger lower band, a long trade is placed.
Moving Average: The highest and lowest prices over a certain period (e.g. 5 periods) are calculated. When price is higher than the highest point over the past 5 periods, a long trade is placed; when price is lower than the lowest point over the past 5 periods, a short trade is placed.
MACD: The crossover and death cross of fast line, slow line and MACD line are used as auxiliary judgement indicators.
These indicators work together to judge the market in trending and consolidating stages. Bollinger Bands identify breakouts and reversions to mean. Moving averages determine trend reversal points during consolidation. RSI extremes spot overbought/oversold market conditions for counter-trend trades.
Advantage Analysis
The advantages of this strategy are:
Combination of multiple indicators improves accuracy. RSI, Bollinger Bands, moving average and more interact to produce reliable trading signals.
Applicable to different market conditions. Bollinger Bands for trends, moving averages for consolidation, RSI for extremes. Flexibility is ensured.
Reasonable trading frequency. Indicator parameters are set conservatively to avoid over-trading.
Clean code structure. Easy to understand, edit and build upon.
Risk Analysis
Some risks need attention:
Parameter risks. Inappropriate indicator parameters may generate incorrect trading signals. Parameters need continuous testing and optimization.
Long/short switch risks. Frequent long/short position changes around trend reversals increase trading costs. Holding period can be adjusted.
Coding risks. Logical flaws hidden in the code could lead to abnormal trades. Exception handling and logging should be improved.
Optimization
The strategy can be upgraded in the following aspects:
Add stop loss to lock in profits and reduce losses.
Incorporate trading volume to avoid false signals. E.g. check volume on Bollinger breakouts.
Introduce machine learning to find optimal parameters based on historical data.
Build graphical interface for intuitive display of performance.
Conduct backtesting to find best parameter combinations.
Conclusion
This strategy combines moving average, Bollinger Bands, RSI and more to generate trading signals. Its versatility and accuracy are clear strengths, while parameter setting and coding risks need to be managed. Next steps are to add stops, machine learning for parameter optimization, GUI for monitoring, and to improve exceptions handling.
/*backtest
start: 2024-01-19 00:00:00
end: 2024-02-15 00:00:00
period: 4h
basePeriod: 15m
exchanges: [{"eid":"Futures_Binance","currency":"BTC_USDT"}]
*/

//@version=2
strategy("MD strategy", overlay=true)
lengthrsi = input( 14 )
overSold = input( 30 )
overBought = input( 70 )
price = close
source = close
lengthbb = input(20, minval=1)
mult = input(2.0, minval=0.001, maxval=50)
direction = input(0, title = "Strategy Direction",minval=-1, maxval=1)
fastLength = input(12)
slowlength = input(26)
MACDLength = input(9)
consecutiveBarsUp = input(3)
consecutiveBarsDown = input(3)
lengthch = input( minval=1, maxval=1000, defval=5)
upBound = highest(high, lengthch)
downBound = lowest(low, lengthch)


ups = price > price[1] ? nz(ups[1]) + 1 : 0
dns = price < price[1] ? nz(dns[1]) + 1 : 0
MACD = ema(close, fastLength) - ema(close, slowlength)
aMACD = ema(MACD, MACDLength)
delta = MACD - aMACD

strategy.risk.allow_entry_in(direction == 0 ? strategy.direction.all : (direction < 0 ? strategy.direction.short : strategy.direction.long))

basis = sma(source, lengthbb)
dev = mult * stdev(source, lengthbb)

upper = basis + dev
lower = basis - dev

vrsi = rsi(price, lengthrsi)

if (not na(vrsi))
    if (crossover(vrsi, overSold))
        strategy.entry("RsiLE", strategy.long, comment="RsiLE")
    if (crossunder(vrsi, overBought))
        strategy.entry("RsiSE", strategy.short, comment="RsiSE")

if (crossover(source, lower))
    strategy.entry("BBandLE", strategy.long, stop=lower, oca_name="BollingerBands",  comment="BBandLE")
else
    strategy.cancel(id="BBandLE")

if (crossunder(source, upper))
    strategy.entry("BBandSE", strategy.short, stop=upper, oca_name="BollingerBands",  comment="BBandSE")
else
    strategy.cancel(id="BBandSE")


if (not na(close[lengthch]))
    strategy.entry("ChBrkLE", strategy.long, stop=upBound + syminfo.mintick, comment="ChBrkLE")
    strategy.entry("ChBrkSE", strategy.short, stop=downBound - syminfo.mintick, comment="ChBrkSE")


//plot(strategy.equity, title="equity", color=red, linewidth=2, style=areabr)
- Momentum Moving Average Reversal Strategy
- Momentum Moving Average Crossover Trading Strategy
- Momentum Trend Synergy Strategy
- Rational Trading Robot Powered by RSI Strategy
- DYNAMIC MOMENTUM OSCILLATOR TRAILING STOP STRATEGY
- Bugra Trading Strategy Based on Dual Kinetic Moving Average
- Fractal and Pattern Based Quantitative Trading Strategy
- Reversal Fluctuation CAT Strategy
- Price Channel VWAP Trading Strategy
- The Interwoven Moving Average Crossover Strategy
- Absolute Momentum Indicator Strategy
- Supertrend and Moving Average Crossover Strategy
- Dual Trend Breakout Strategy
- SSL Channel and Wave Trend Quantitative Trading Strategy
- Super ATR Trend Following Strategy
- Trading-oriented Ichimoku Cloud Nine Strategy
- LPB Microcycles Adaptive Oscillation Contour Tracking Strategy
- Best ABCD Pattern Trading Strategy with Stop Loss and Take Profit Tracking
- Major Trend Indicator Long
- Multi Timeframe Strategy