概述
该策略主要基于SSL通道指标和波浪趋势指标,结合其他辅助指标,实现了一个较为完整的量化交易策略。该策略名称包含了核心指标SSL通道和波浪趋势,以及量化交易的关键词,符合要求。
策略原理
该策略的交易入场依据有六个条件,其中前两个为核心条件,具体如下:
- SSL混合指标的基线为蓝色(看涨)或红色(看跌)
- SSL通道指标上叉(看涨)或下叉(看跌)
- 波浪趋势指标上叉(看涨)或下叉(看跌)
- 入场K线高度不超过阈值
- 入场K线位于布林通道内部
- 止盈点不碰触均线
当这6个条件同时满足时,策略会入场做多或做空。止损距离根据ATR指标的数值计算,止盈距离则为止损的Risk Reward Ratio倍。
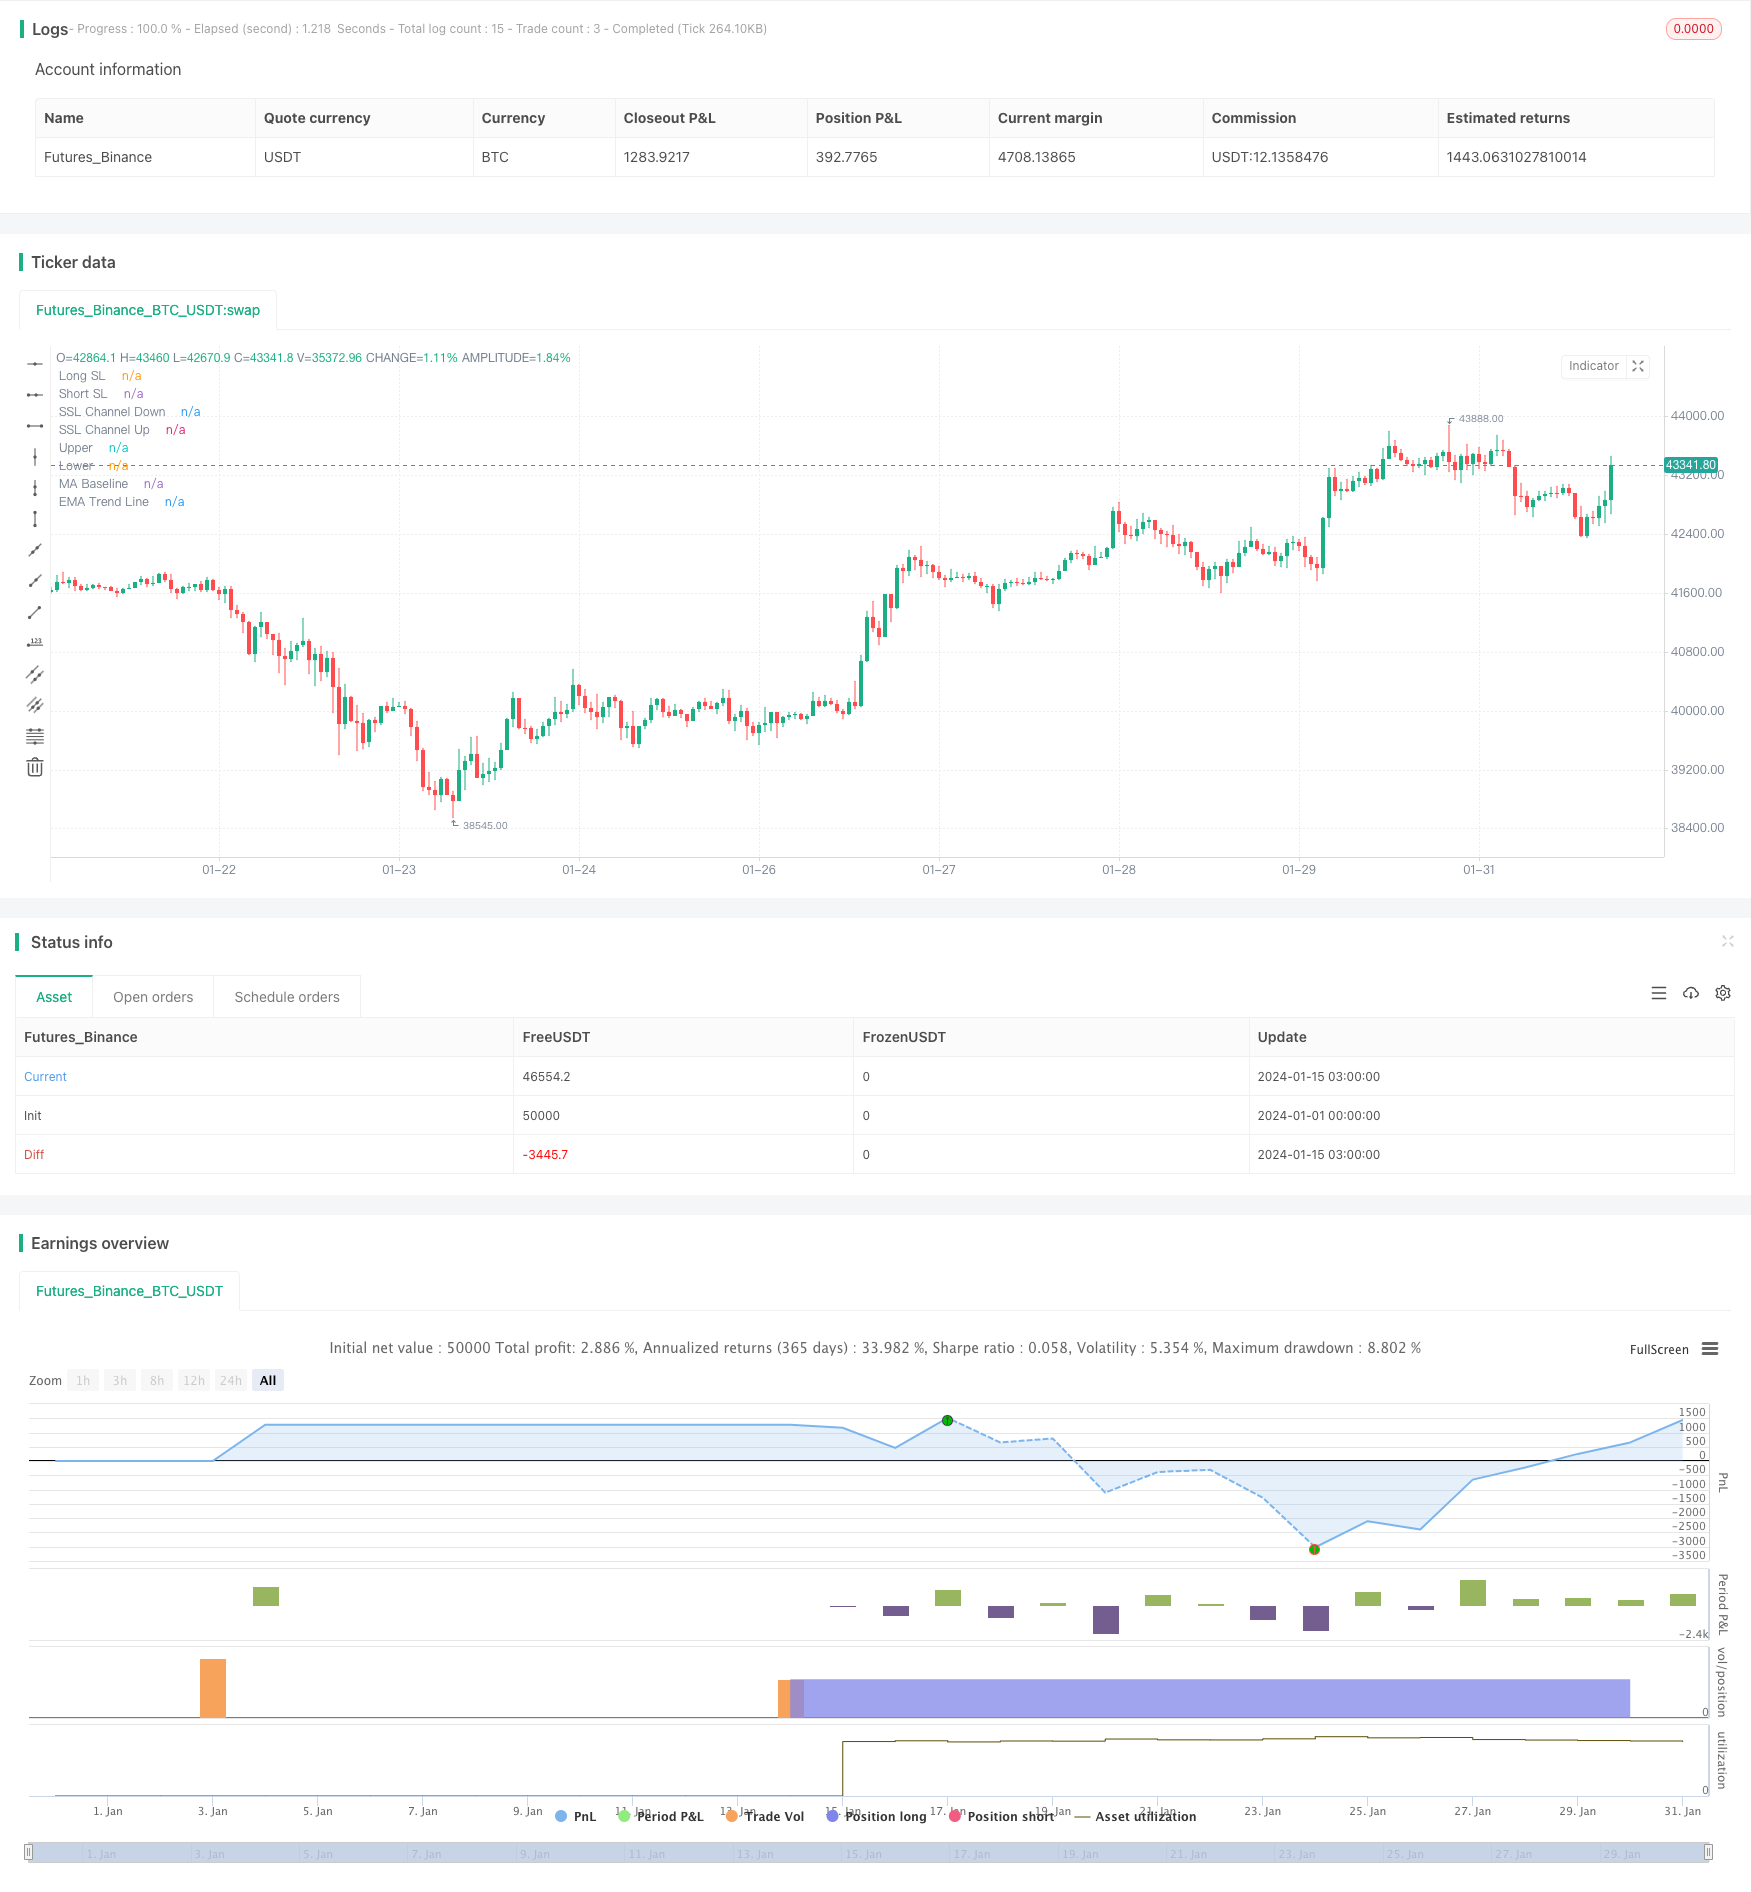
该策略同时具有完善的风险管理机制,包括止损设置、仓位规模控制,以及最大回撤控制。同时,该策略在图表上绘制了辅助线,可以直观看到每次的止损位和止盈位,以及具体的盈亏情况。这对于分析和优化策略都非常有帮助。
优势分析
该策略最大的优势在于利用SSL通道指标判断趋势方向的准确性非常高,再配合波浪趋势等指标进行确认,可以大幅度减少假信号。同时,严格的入场条件也可以避免不必要的交易,从而减少交易次数,降低交易成本。
另外,该策略的完善的风险和资金管理机制也是一个很大的优势。事先设置好的止损和止盈策略,可以有效控制单笔交易的最大损失。再配合仓位规模的控制,可以将账户最大回撤控制在可承受的范围内。
风险分析
该策略最大的风险在于,严格的入场条件会错过一些交易机会,导致盈利能力受到一定的影响。当市场处于震荡状态的时候,该策略的盈利能力也会打折扣。
另外,波浪趋势等指标判断市场趋势的效果,也会受到假突破等市场异常的影响。这时就需要调整参数,或增加其他指标进行确认。
总的来说,该策略的风险还是可控的。通过参数调整和优化,可以使策略更加适应不同的市场环境。
优化方向
该策略还有以下几个可以优化的方向:
优化波浪趋势的参数,使其能更准确判断趋势转折点
增加其他指标进行确认,如KDJ、MACD等,避免假突破的影响
可以根据不同品种、不同周期进行参数调整优化,提高策略稳定性
增加机器学习算法,利用历史数据训练,实时优化策略参数
利用高频因子等算法提高策略的交易频率和盈利能力
通过这些优化措施的实施,有望使该策略的盈利能力和稳定性达到更高的水平。
总结
总的来说,该策略整合了多种指标和严格的入场机制,在确保高胜率的同时,也实现了良好的风险控制效果。结合未来的优化方向,该策略有很大的发展潜力,是一种值得推荐的量化交易策略。
/*backtest
start: 2024-01-01 00:00:00
end: 2024-01-31 23:59:59
period: 1h
basePeriod: 15m
exchanges: [{"eid":"Futures_Binance","currency":"BTC_USDT"}]
*/
// This source code is subject to the terms of the Mozilla Public License 2.0 at https://mozilla.org/MPL/2.0/
// © kevinmck100
// @credits
// - Wave Trend: Indicator: WaveTrend Oscillator [WT] by @LazyBear
// - SSL Channel: SSL channel by @ErwinBeckers
// - SSL Hybrid: SSL Hybrid by @Mihkel00
// - Keltner Channels: Keltner Channels Bands by @ceyhun
// - Candle Height: Candle Height in Percentage - Columns by @FreeReveller
// - NNFX ATR: NNFX ATR by @sueun123
//
// Strategy: Based on the YouTube video "This Unique Strategy Made 47% Profit in 2.5 Months [SSL + Wave Trend Strategy Tested 100 Times]" by TradeSmart.
// @description
//
// Strategy incorporates the following features:
//
// - Risk management: Configurable X% loss per stop loss
// Configurable R:R ratio
//
// - Trade entry: Based on strategy conditions below
//
// - Trade exit: Based on strategy conditions below
//
// - Backtesting: Configurable backtesting range by date
//
// - Chart drawings: Each entry condition indicator can be turned on and off
// TP/SL boxes drawn for all trades. Can be turned on and off
// Trade exit information labels. Can be turned on and off
// NOTE: Trade drawings will only be applicable when using overlay strategies
//
// - Alerting: Alerts on LONG and SHORT trade entries
//
// - Debugging: Includes section with useful debugging techniques
//
// Strategy conditions:
//
// - Trade entry: LONG: C1: SSL Hybrid baseline is BLUE
// C2: SSL Channel crosses up (green on top)
// C3: Wave Trend crosses up (represented by pink candle body)
// C4: Entry candle height is not greater than configured threshold
// C5: Entry candle is inside Keltner Channel (wicks or body depending on configuration)
// C6: Take Profit target does not touch EMA (represents resistance)
//
// SHORT: C1: SSL Hybrid baseline is RED
// C2: SSL Channel crosses down (red on top)
// C3: Wave Trend crosses down (represented by orange candle body)
// C4: Entry candle height is not greater than configured threshold
// C5: Entry candle is inside Keltner Channel (wicks or body depending on configuration)
// C6: Take Profit target does not touch EMA (represents support)
//
// - Trade exit: Stop Loss: Size configurable with NNFX ATR multiplier
// Take Profit: Calculated from Stop Loss using R:R ratio
//@version=5
INITIAL_CAPITAL = 1000
DEFAULT_COMMISSION = 0.02
MAX_DRAWINGS = 500
IS_OVERLAY = true
strategy("SSL + Wave Trend Strategy", overlay = IS_OVERLAY, initial_capital = INITIAL_CAPITAL, currency = currency.NONE, max_labels_count = MAX_DRAWINGS, max_boxes_count = MAX_DRAWINGS, max_lines_count = MAX_DRAWINGS, default_qty_type = strategy.cash, commission_type = strategy.commission.percent, commission_value = DEFAULT_COMMISSION)
// =============================================================================
// INPUTS
// =============================================================================
// ----------------------
// Trade Entry Conditions
// ----------------------
useSslHybrid = input.bool (true, "Use SSL Hybrid Condition", group = "Strategy: Entry Conditions", inline = "SC1")
useKeltnerCh = input.bool (true, "Use Keltner Channel Condition ", group = "Strategy: Entry Conditions", inline = "SC2")
keltnerChWicks = input.bool (true, "Keltner Channel Include Wicks", group = "Strategy: Entry Conditions", inline = "SC2")
useEma = input.bool (true, "Target not touch EMA Condition", group = "Strategy: Entry Conditions", inline = "SC3")
useCandleHeight = input.bool (true, "Use Candle Height Condition", group = "Strategy: Entry Conditions", inline = "SC4")
candleHeight = input.float (1.0, "Candle Height Threshold ", group = "Strategy: Entry Conditions", inline = "SC5", minval = 0, step = 0.1, tooltip = "Percentage difference between high and low of a candle. Expressed as a decimal. Lowering this value will filter out trades on volatile candles.")
// ---------------------
// Trade Exit Conditions
// ---------------------
slAtrMultiplier = input.float (1.7, "Stop Loss ATR Multiplier ", group = "Strategy: Exit Conditions", inline = "EC1", minval = 0, step = 0.1, tooltip = "Size of StopLoss is determined by multiplication of ATR value. Take Profit is derived from this also by multiplying the StopLoss value by the Risk:Reward multiplier.")
// ---------------
// Risk Management
// ---------------
riskReward = input.float (2.5, "Risk : Reward 1 :", group = "Strategy: Risk Management", inline = "RM1", minval = 0, step = 0.1, tooltip = "Used to determine Take Profit level. Take Profit will be Stop Loss multiplied by this value.")
accountRiskPercent = input.float (1, "Portfolio Risk % ", group = "Strategy: Risk Management", inline = "RM2", minval = 0, step = 0.1, tooltip = "Percentage of portfolio you lose if trade hits SL.\n\nYou then stand to gain\n Portfolio Risk % * Risk : Reward\nif trade hits TP.")
// ----------
// Date Range
// ----------
startYear = input.int (2022, "Start Date ", group = "Strategy: Date Range", inline = "DR1", minval = 1900, maxval = 2100)
startMonth = input.int (1, "", group = "Strategy: Date Range", inline = "DR1", options = [1, 2, 3, 4, 5, 6, 7, 8, 9, 10, 11, 12])
startDate = input.int (1, "", group = "Strategy: Date Range", inline = "DR1", options = [1, 2, 3, 4, 5, 6, 7, 8, 9, 10, 11, 12, 13, 14, 15, 16, 17, 18, 19, 20, 21, 22, 23, 24, 25, 26, 27, 28, 29, 30, 31])
endYear = input.int (2100, "End Date ", group = "Strategy: Date Range", inline = "DR2", minval = 1900, maxval = 2100)
endMonth = input.int (1, "", group = "Strategy: Date Range", inline = "DR2", options = [1, 2, 3, 4, 5, 6, 7, 8, 9, 10, 11, 12])
endDate = input.int (1, "", group = "Strategy: Date Range", inline = "DR2", options = [1, 2, 3, 4, 5, 6, 7, 8, 9, 10, 11, 12, 13, 14, 15, 16, 17, 18, 19, 20, 21, 22, 23, 24, 25, 26, 27, 28, 29, 30, 31])
// ----------------
// Display Settings
// ----------------
showTpSlBoxes = input.bool (true, "Show TP / SL Boxes", group = "Strategy: Drawings", inline = "D1", tooltip = "Show or hide TP and SL position boxes.\n\nNote: TradingView limits the maximum number of boxes that can be displayed to 500 so they may not appear for all price data under test.")
showLabels = input.bool (false, "Show Trade Exit Labels", group = "Strategy: Drawings", inline = "D2", tooltip = "Useful labels to identify Profit/Loss and cumulative portfolio capital after each trade closes.\n\nAlso note that TradingView limits the max number of 'boxes' that can be displayed on a chart (max 500). This means when you lookback far enough on the chart you will not see the TP/SL boxes. However you can check this option to identify where trades exited.")
// ------------------
// Indicator Settings
// ------------------
// Indicator display options
showSslHybrid = input.bool (true, "Show SSL Hybrid", group = "Indicators: Drawings", inline = "ID1")
showSslChannel = input.bool (true, "Show SSL Channel", group = "Indicators: Drawings", inline = "ID2")
showEma = input.bool (true, "Show EMA", group = "Indicators: Drawings", inline = "ID3")
showKeltner = input.bool (true, "Show Keltner Channel", group = "Indicators: Drawings", inline = "ID4")
showWaveTrend = input.bool (true, "Show Wave Trend Flip Candles", group = "Indicators: Drawings", inline = "ID5")
showAtrSl = input.bool (true, "Show ATR Stop Loss Bands", group = "Indicators: Drawings", inline = "ID6")
// Wave Trend Settings
n1 = input.int (10, "Channel Length ", group = "Indicators: Wave Trend", inline = "WT1")
n2 = input.int (21, "Average Length ", group = "Indicators: Wave Trend", inline = "WT2")
obLevel1 = input.int (60, "Over Bought Level 1 ", group = "Indicators: Wave Trend", inline = "WT3")
obLevel2 = input.int (53, "Over Bought Level 2 ", group = "Indicators: Wave Trend", inline = "WT4")
osLevel1 = input.int (-60, "Over Sold Level 1 ", group = "Indicators: Wave Trend", inline = "WT5")
osLevel2 = input.int (-53, "Over Sold Level 2 ", group = "Indicators: Wave Trend", inline = "WT6")
// SSL Channel Settings
sslChLen = input.int (10, "Period ", group = "Indicators: SSL Channel", inline = "SC1")
// SSL Hybrid Settings
// Show/hide Inputs
show_color_bar = input.bool (false, "Show Color Bars", group = "Indicators: SSL Hybrid", inline = "SH2")
// Baseline Inputs
maType = input.string ("HMA", "Baseline Type ", group = "Indicators: SSL Hybrid", inline = "SH3", options=["SMA", "EMA", "DEMA", "TEMA", "LSMA", "WMA", "MF", "VAMA", "TMA", "HMA", "JMA", "Kijun v2", "EDSMA", "McGinley"])
len = input.int (60, "Baseline Length ", group = "Indicators: SSL Hybrid", inline = "SH4")
src = input.source (close, "Source ", group = "Indicators: SSL Hybrid", inline = "SH5")
kidiv = input.int (1, "Kijun MOD Divider ", group = "Indicators: SSL Hybrid", inline = "SH6", maxval=4)
jurik_phase = input.int (3, "* Jurik (JMA) Only - Phase ", group = "Indicators: SSL Hybrid", inline = "SH7")
jurik_power = input.int (1, "* Jurik (JMA) Only - Power ", group = "Indicators: SSL Hybrid", inline = "SH8")
volatility_lookback = input.int (10, "* Volatility Adjusted (VAMA) Only - Volatility lookback length", group = "Indicators: SSL Hybrid", inline = "SH9")
//Modular Filter Inputs
beta = input.float (0.8, "Modular Filter, General Filter Only - Beta ", group = "Indicators: SSL Hybrid", inline = "SH10", minval=0, maxval=1, step=0.1)
feedback = input.bool (false, "Modular Filter Only - Feedback", group = "Indicators: SSL Hybrid", inline = "SH11")
z = input.float (0.5, "Modular Filter Only - Feedback Weighting ", group = "Indicators: SSL Hybrid", inline = "SH12", step=0.1, minval=0, maxval=1)
//EDSMA Inputs
ssfLength = input.int (20, "EDSMA - Super Smoother Filter Length ", group = "Indicators: SSL Hybrid", inline = "SH13", minval=1)
ssfPoles = input.int (2, "EDSMA - Super Smoother Filter Poles ", group = "Indicators: SSL Hybrid", inline = "SH14", options=[2, 3])
///Keltner Baseline Channel Inputs
useTrueRange = input.bool (true, "Use True Range?", group = "Indicators: SSL Hybrid", inline = "SH15")
multy = input.float (0.2, "Base Channel Multiplier ", group = "Indicators: SSL Hybrid", inline = "SH16", step=0.05)
// EMA Settings
emaLength = input.int (200, "EMA Length ", group = "Indicators: EMA", inline = "E1", minval = 1)
// Keltner Channel Settings
kcLength = input.int (20, "Length ", group = "Indicators: Keltner Channel", inline = "KC1", minval=1)
kcMult = input.float (1.5, "Multiplier ", group = "Indicators: Keltner Channel", inline = "KC2")
kcSrc = input.source (close, "Source ", group = "Indicators: Keltner Channel", inline = "KC3")
alen = input.int (10, "ATR Length ", group = "Indicators: Keltner Channel", inline = "KC4", minval=1)
// Candle Height in Percentage Settings
chPeriod = input.int (20, "Period ", group = "Indicators: Candle Height", inline = "CH1")
// NNFX ATR Settings
nnfxAtrLength = input.int (14, "Length ", group = "Indicators: NNFX ATR (Stop Loss Settings)", inline = "ATR1", minval = 1)
nnfxSmoothing = input.string ("RMA", "Smoothing ", group = "Indicators: NNFX ATR (Stop Loss Settings)", inline = "ATR3", options = ["RMA", "SMA", "EMA", "WMA"])
// =============================================================================
// INDICATORS
// =============================================================================
// ----------
// Wave Trend
// ----------
ap = hlc3
esa = ta.ema(ap, n1)
d = ta.ema(math.abs(ap - esa), n1)
ci = (ap - esa) / (0.015 * d)
tci = ta.ema(ci, n2)
wt1 = tci
wt2 = ta.sma(wt1, 4)
// Show Wave Trend crosses on chart as colour changes (pink bullish, orange bearish)
wtBreakUp = ta.crossover (wt1, wt2)
wtBreakDown = ta.crossunder (wt1, wt2)
barColour = showWaveTrend ? wtBreakUp ? color.fuchsia : wtBreakDown ? color.orange : na : na
barcolor(color = barColour)
// -----------
// SSL Channel
// -----------
smaHigh = ta.sma(high, sslChLen)
smaLow = ta.sma(low, sslChLen)
var int sslChHlv = na
sslChHlv := close > smaHigh ? 1 : close < smaLow ? -1 : sslChHlv[1]
sslChDown = sslChHlv < 0 ? smaHigh : smaLow
sslChUp = sslChHlv < 0 ? smaLow : smaHigh
plot(showSslChannel ? sslChDown : na, "SSL Channel Down", linewidth=1, color=color.new(color.red, 30))
plot(showSslChannel ? sslChUp : na, "SSL Channel Up", linewidth=1, color=color.new(color.lime, 30))
// ----------
// SSL Hybrid
// ----------
//EDSMA
get2PoleSSF(src, length) =>
PI = 2 * math.asin(1)
arg = math.sqrt(2) * PI / length
a1 = math.exp(-arg)
b1 = 2 * a1 * math.cos(arg)
c2 = b1
c3 = -math.pow(a1, 2)
c1 = 1 - c2 - c3
ssf = 0.0
ssf:= c1 * src + c2 * nz(ssf[1]) + c3 * nz(ssf[2])
ssf
get3PoleSSF(src, length) =>
PI = 2 * math.asin(1)
arg = PI / length
a1 = math.exp(-arg)
b1 = 2 * a1 * math.cos(1.738 * arg)
c1 = math.pow(a1, 2)
coef2 = b1 + c1
coef3 = -(c1 + b1 * c1)
coef4 = math.pow(c1, 2)
coef1 = 1 - coef2 - coef3 - coef4
ssf = 0.0
ssf := coef1 * src + coef2 * nz(ssf[1]) + coef3 * nz(ssf[2]) + coef4 * nz(ssf[3])
ssf
ma(type, src, len) =>
float result = 0
if type == "TMA"
result := ta.sma(ta.sma(src, math.ceil(len / 2)), math.floor(len / 2) + 1)
result
if type == "MF"
ts = 0.
b = 0.
c = 0.
os = 0.
//----
alpha = 2 / (len + 1)
a = feedback ? z * src + (1 - z) * nz(ts[1], src) : src
//----
b := a > alpha * a + (1 - alpha) * nz(b[1], a) ? a : alpha * a + (1 - alpha) * nz(b[1], a)
c := a < alpha * a + (1 - alpha) * nz(c[1], a) ? a : alpha * a + (1 - alpha) * nz(c[1], a)
os := a == b ? 1 : a == c ? 0 : os[1]
//----
upper = beta * b + (1 - beta) * c
lower = beta * c + (1 - beta) * b
ts := os * upper + (1 - os) * lower
result := ts
result
if type == "LSMA"
result := ta.linreg(src, len, 0)
result
if type == "SMA" // Simple
result := ta.sma(src, len)
result
if type == "EMA" // Exponential
result := ta.ema(src, len)
result
if type == "DEMA" // Double Exponential
e = ta.ema(src, len)
result := 2 * e - ta.ema(e, len)
result
if type == "TEMA" // Triple Exponential
e = ta.ema(src, len)
result := 3 * (e - ta.ema(e, len)) + ta.ema(ta.ema(e, len), len)
result
if type == "WMA" // Weighted
result := ta.wma(src, len)
result
if type == "VAMA" // Volatility Adjusted
/// Copyright © 2019 to present, Joris Duyck (JD)
mid = ta.ema(src, len)
dev = src - mid
vol_up = ta.highest(dev, volatility_lookback)
vol_down= ta.lowest(dev, volatility_lookback)
result := mid + math.avg(vol_up, vol_down)
result
if type == "HMA" // Hull
result := ta.wma(2 * ta.wma(src, len / 2) - ta.wma(src, len), math.round(math.sqrt(len)))
result
if type == "JMA" // Jurik
/// Copyright © 2018 Alex Orekhov (everget)
/// Copyright © 2017 Jurik Research and Consulting.
phaseRatio = jurik_phase < -100 ? 0.5 : jurik_phase > 100 ? 2.5 : jurik_phase / 100 + 1.5
beta = 0.45 * (len - 1) / (0.45 * (len - 1) + 2)
alpha = math.pow(beta, jurik_power)
jma = 0.0
e0 = 0.0
e0 := (1 - alpha) * src + alpha * nz(e0[1])
e1 = 0.0
e1 := (src - e0) * (1 - beta) + beta * nz(e1[1])
e2 = 0.0
e2 := (e0 + phaseRatio * e1 - nz(jma[1])) * math.pow(1 - alpha, 2) + math.pow(alpha, 2) * nz(e2[1])
jma := e2 + nz(jma[1])
result := jma
result
if type == "Kijun v2"
kijun = math.avg(ta.lowest(len), ta.highest(len)) //, (open + close)/2)
conversionLine = math.avg(ta.lowest(len / kidiv), ta.highest(len / kidiv))
delta = (kijun + conversionLine) / 2
result := delta
result
if type == "McGinley"
mg = 0.0
mg := na(mg[1]) ? ta.ema(src, len) : mg[1] + (src - mg[1]) / (len * math.pow(src / mg[1], 4))
result := mg
result
if type == "EDSMA"
zeros = src - nz(src[2])
avgZeros = (zeros + zeros[1]) / 2
// Ehlers Super Smoother Filter
ssf = ssfPoles == 2 ? get2PoleSSF(avgZeros, ssfLength) : get3PoleSSF(avgZeros, ssfLength)
// Rescale filter in terms of Standard Deviations
stdev = ta.stdev(ssf, len)
scaledFilter= stdev != 0 ? ssf / stdev : 0
alpha = 5 * math.abs(scaledFilter) / len
edsma = 0.0
edsma := alpha * src + (1 - alpha) * nz(edsma[1])
result := edsma
result
result
///Keltner Baseline Channel
BBMC = ma(maType, close, len)
Keltma = ma(maType, src, len)
range_1 = useTrueRange ? ta.tr : high - low
rangema = ta.ema(range_1, len)
upperk = Keltma + rangema * multy
lowerk = Keltma - rangema * multy
//COLORS
color_bar = close > upperk ? #00c3ff : close < lowerk ? #ff0062 : color.gray
//PLOTS
p1 = plot(showSslHybrid ? BBMC : na, color=color.new(color_bar, 0), linewidth=4, title="MA Baseline")
barcolor(show_color_bar ? color_bar : na)
// ---
// EMA
// ---
ema = ta.ema(close, emaLength)
plot(showEma ? ema : na, "EMA Trend Line", color.white)
// ----------------
// Keltner Channels
// ----------------
kcMa = ta.ema(kcSrc, kcLength)
KTop2 = kcMa + kcMult * ta.atr(alen)
KBot2 = kcMa - kcMult * ta.atr(alen)
upperPlot = plot(showKeltner ? KTop2 : na, color=color.new(color.blue, 0), title="Upper", style = plot.style_stepline)
lowerPlot = plot(showKeltner ? KBot2 : na, color=color.new(color.blue, 0), title="Lower", style = plot.style_stepline)
// ---------------------------
// Candle Height in Percentage
// ---------------------------
percentHL = (high - low) / low * 100
percentRed = open > close ? (open - close) / close * 100 : 0
percentGreen= open < close ? (close - open) / open * 100 : 0
// --------
// NNFX ATR
// --------
function(source, length) =>
if nnfxSmoothing == "RMA"
ta.rma(source, nnfxAtrLength)
else
if nnfxSmoothing == "SMA"
ta.sma(source, nnfxAtrLength)
else
if nnfxSmoothing == "EMA"
ta.ema(source, nnfxAtrLength)
else
ta.wma(source, nnfxAtrLength)
formula(number, decimals) =>
factor = math.pow(10, decimals)
int(number * factor) / factor
nnfxAtr = formula(function(ta.tr(true), nnfxAtrLength), 5) * slAtrMultiplier
//Sell
longSlAtr = nnfxAtrLength ? close - nnfxAtr : close + nnfxAtr
shortSlAtr = nnfxAtrLength ? close + nnfxAtr : close - nnfxAtr
plot(showAtrSl ? longSlAtr : na, "Long SL", color = color.new(color.red, 35), linewidth = 1, trackprice = true, editable = true, style = plot.style_stepline)
plot(showAtrSl ? shortSlAtr : na, "Short SL", color = color.new(color.red, 35), linewidth = 1, trackprice = true, editable = true, style = plot.style_stepline)
// =============================================================================
// FUNCTIONS
// =============================================================================
percentAsPoints(pcnt) =>
math.round(pcnt / 100 * close / syminfo.mintick)
calcStopLossPrice(pointsOffset, isLong) =>
priceOffset = pointsOffset * syminfo.mintick
if isLong
close - priceOffset
else
close + priceOffset
calcProfitTrgtPrice(pointsOffset, isLong) =>
calcStopLossPrice(-pointsOffset, isLong)
printLabel(barIndex, msg) => label.new(barIndex, close, msg)
printTpSlHitBox(left, right, slHit, tpHit, entryPrice, slPrice, tpPrice) =>
if showTpSlBoxes
box.new (left = left, top = entryPrice, right = right, bottom = slPrice, bgcolor = slHit ? color.new(color.red, 60) : color.new(color.gray, 90), border_width = 0)
box.new (left = left, top = entryPrice, right = right, bottom = tpPrice, bgcolor = tpHit ? color.new(color.green, 60) : color.new(color.gray, 90), border_width = 0)
line.new(x1 = left, y1 = entryPrice, x2 = right, y2 = entryPrice, color = color.new(color.yellow, 20))
line.new(x1 = left, y1 = slPrice, x2 = right, y2 = slPrice, color = color.new(color.red, 20))
line.new(x1 = left, y1 = tpPrice, x2 = right, y2 = tpPrice, color = color.new(color.green, 20))
printTpSlNotHitBox(left, right, entryPrice, slPrice, tpPrice) =>
if showTpSlBoxes
box.new (left = left, top = entryPrice, right = right, bottom = slPrice, bgcolor = color.new(color.gray, 90), border_width = 0)
box.new (left = left, top = entryPrice, right = right, bottom = tpPrice, bgcolor = color.new(color.gray, 90), border_width = 0)
line.new(x1 = left, y1 = entryPrice, x2 = right, y2 = entryPrice, color = color.new(color.yellow, 20))
line.new(x1 = left, y1 = slPrice, x2 = right, y2 = slPrice, color = color.new(color.red, 20))
line.new(x1 = left, y1 = tpPrice, x2 = right, y2 = tpPrice, color = color.new(color.green, 20))
printTradeExitLabel(x, y, posSize, entryPrice, pnl) =>
if showLabels
labelStr = "Position Size: " + str.tostring(math.abs(posSize), "#.##") + "\nPNL: " + str.tostring(pnl, "#.##") + "\nCapital: " + str.tostring(strategy.equity, "#.##") + "\nEntry Price: " + str.tostring(entryPrice, "#.##")
label.new(x = x, y = y, text = labelStr, color = pnl > 0 ? color.new(color.green, 60) : color.new(color.red, 60), textcolor = color.white, style = label.style_label_down)
// =============================================================================
// STRATEGY LOGIC
// =============================================================================
// See strategy description at top for details on trade entry/exit logis
// ----------
// CONDITIONS
// ----------
// Trade entry and exit variables
var tradeEntryBar = bar_index
var profitPoints = 0.
var lossPoints = 0.
var slPrice = 0.
var tpPrice = 0.
var inLong = false
var inShort = false
// Exit calculations
slAmount = nnfxAtr
slPercent = math.abs((1 - (close - slAmount) / close) * 100)
tpPercent = slPercent * riskReward
tpPoints = percentAsPoints(tpPercent)
tpTarget = calcProfitTrgtPrice(tpPoints, wtBreakUp)
inDateRange = true
// Condition 1: SSL Hybrid blue for long or red for short
bullSslHybrid = useSslHybrid ? close > upperk : true
bearSslHybrid = useSslHybrid ? close < lowerk : true
// Condition 2: SSL Channel crosses up for long or down for short
bullSslChannel = ta.crossover(sslChUp, sslChDown)
bearSslChannel = ta.crossover(sslChDown, sslChUp)
// Condition 3: Wave Trend crosses up for long or down for short
bullWaveTrend = wtBreakUp
bearWaveTrend = wtBreakDown
// Condition 4: Entry candle heignt <= 0.6 on Candle Height in Percentage
candleHeightValid = useCandleHeight ? percentGreen <= candleHeight and percentRed <= candleHeight : true
// Condition 5: Entry candle is inside Keltner Channel
withinCh = keltnerChWicks ? high < KTop2 and low > KBot2 : open < KTop2 and close < KTop2 and open > KBot2 and close > KBot2
insideKeltnerCh = useKeltnerCh ? withinCh : true
// Condition 6: TP target does not touch 200 EMA
bullTpValid = useEma ? not (close < ema and tpTarget > ema) : true
bearTpValid = useEma ? not (close > ema and tpTarget < ema) : true
// Combine all entry conditions
goLong = inDateRange and bullSslHybrid and bullSslChannel and bullWaveTrend and candleHeightValid and insideKeltnerCh and bullTpValid
goShort = inDateRange and bearSslHybrid and bearSslChannel and bearWaveTrend and candleHeightValid and insideKeltnerCh and bearTpValid
// Entry decisions
openLong = (goLong and not inLong)
openShort = (goShort and not inShort)
flippingSides = (goLong and inShort) or (goShort and inLong)
enteringTrade = openLong or openShort
inTrade = inLong or inShort
// Risk calculations
riskAmt = strategy.equity * accountRiskPercent / 100
entryQty = math.abs(riskAmt / slPercent * 100) / close
if openLong
if strategy.position_size < 0
printTpSlNotHitBox(tradeEntryBar + 1, bar_index + 1, strategy.position_avg_price, slPrice, tpPrice)
printTradeExitLabel(bar_index + 1, math.max(tpPrice, slPrice), strategy.position_size, strategy.position_avg_price, strategy.openprofit)
strategy.entry("Long", strategy.long, qty = entryQty, alert_message = "Long Entry")
enteringTrade := true
inLong := true
inShort := false
alert(message="BUY Trade Entry Alert", freq=alert.freq_once_per_bar_close)
if openShort
if strategy.position_size > 0
printTpSlNotHitBox(tradeEntryBar + 1, bar_index + 1, strategy.position_avg_price, slPrice, tpPrice)
printTradeExitLabel(bar_index + 1, math.max(tpPrice, slPrice), strategy.position_size, strategy.position_avg_price, strategy.openprofit)
strategy.entry("Short", strategy.short, qty = entryQty, alert_message = "Short Entry")
enteringTrade := true
inShort := true
inLong := false
alert(message="SELL Trade Entry Alert", freq=alert.freq_once_per_bar_close)
if enteringTrade
profitPoints := percentAsPoints(tpPercent)
lossPoints := percentAsPoints(slPercent)
slPrice := calcStopLossPrice(lossPoints, openLong)
tpPrice := calcProfitTrgtPrice(profitPoints, openLong)
tradeEntryBar := bar_index
strategy.exit("TP/SL", profit = profitPoints, loss = lossPoints, comment_profit = "TP Hit", comment_loss = "SL Hit", alert_profit = "TP Hit Alert", alert_loss = "SL Hit Alert")
// =============================================================================
// DRAWINGS
// =============================================================================
// -----------
// TP/SL Boxes
// -----------
slHit = (inShort and high >= slPrice) or (inLong and low <= slPrice)
tpHit = (inLong and high >= tpPrice) or (inShort and low <= tpPrice)
exitTriggered = slHit or tpHit
entryPrice = strategy.closedtrades.entry_price (strategy.closedtrades - 1)
pnl = strategy.closedtrades.profit (strategy.closedtrades - 1)
posSize = strategy.closedtrades.size (strategy.closedtrades - 1)
// Print boxes for trades closed at profit or loss
if (inTrade and exitTriggered)
inShort := false
inLong := false
// printTpSlHitBox(tradeEntryBar + 1, bar_index, slHit, tpHit, entryPrice, slPrice, tpPrice)
// printTradeExitLabel(bar_index, math.max(tpPrice, slPrice), posSize, entryPrice, pnl)
// Print TP/SL box for current open trade
if barstate.islastconfirmedhistory and strategy.position_size != 0
printTpSlNotHitBox(tradeEntryBar + 1, bar_index + 1, strategy.position_avg_price, slPrice, tpPrice)
// =============================================================================
// DEBUGGING
// =============================================================================
// Data window plots
plotchar(goLong, "Enter Long", "")
plotchar(goShort, "Enter Short", "")