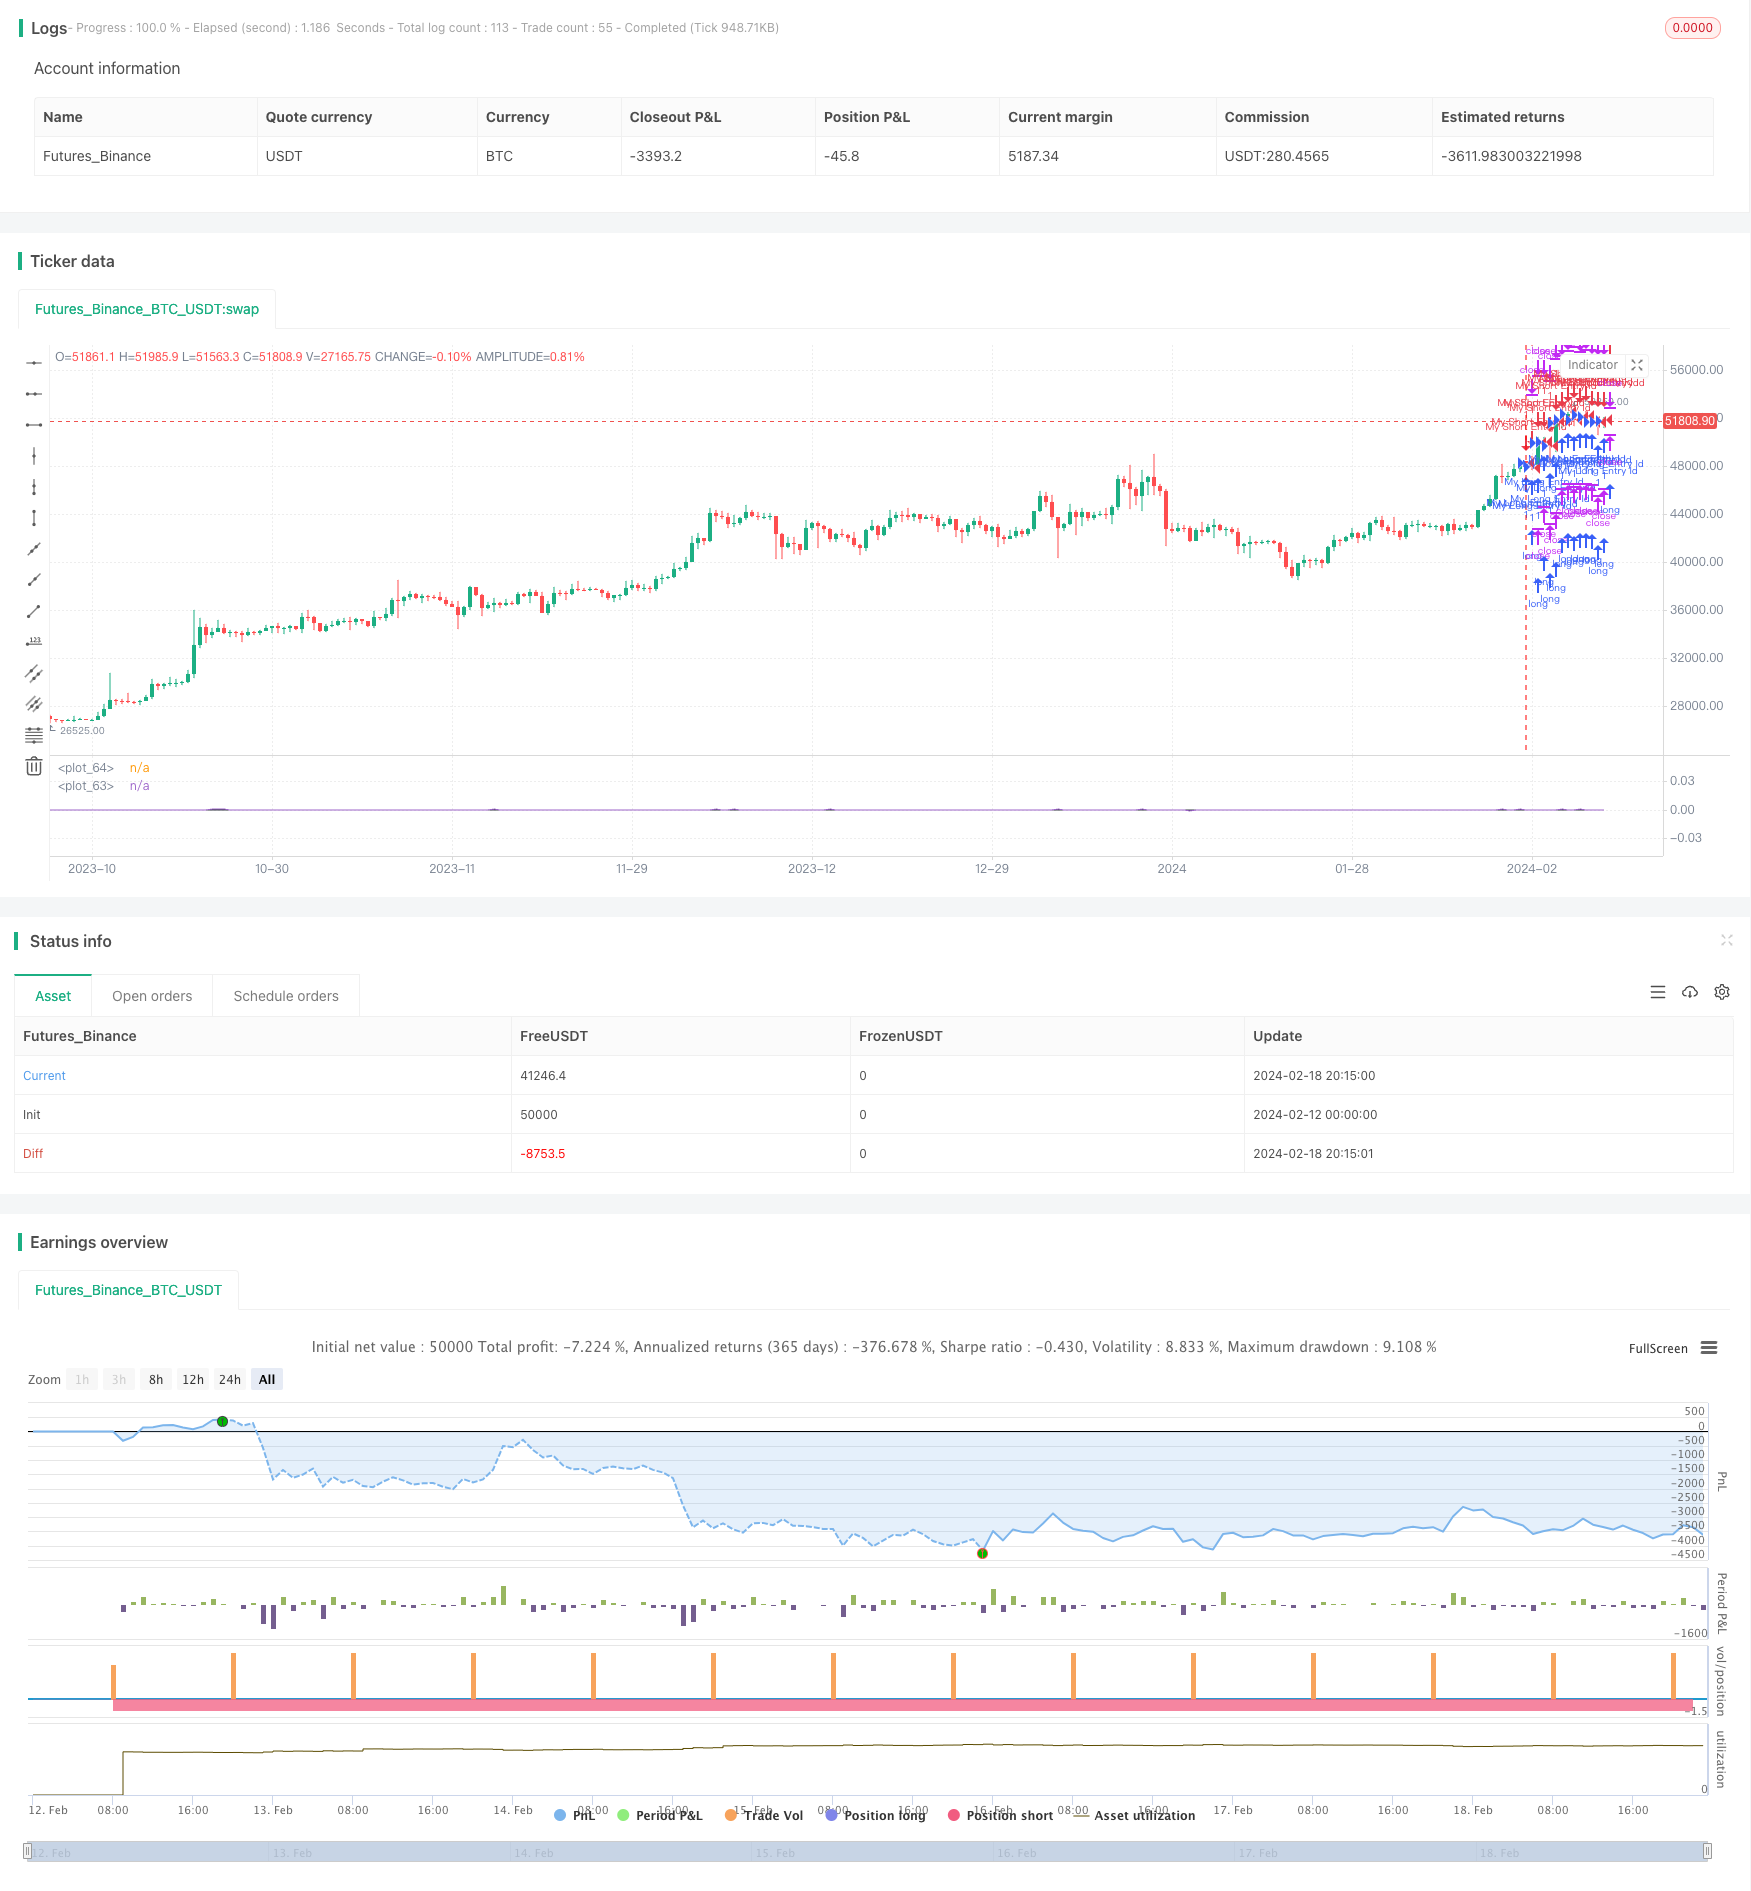
Parabola Oscillator Seeking Highs and Lows Strategy
Author: ChaoZhang, Date: 2024-02-20 16:01:12Tags:

Overview
This strategy identifies price highs and lows by calculating moving averages and variances over different time periods to determine trend and volatility.
Strategy Logic
The core logic of this strategy is to compute moving averages and variances over recent different time periods. Specifically, it calculates 5-day, 4-day and 3-day moving averages (ma, mb, mc) and variances (da, db, dc). It then compares the sizes and selects the period with the highest variance to represent the current trend. Finally, it multiplies the squared variance of the representative period by its moving average to output the final curve wg.
Thus, when price breaks out upward or downward, the representative period and its variance will change significantly, causing wg to change markedly as well, achieving identification of highs and lows.
Advantage Analysis
This idea of judging trend changes based on different periods is effective and can clearly identify price inflection points. Compared to single period judgment, combining multiple periods can improve accuracy and timeliness.
Calculating moving average and variance is also simple and efficient. With small code size, it is highly sensitive to sudden price changes and can detect breakouts quickly.
Risk Analysis
The periods used in this strategy are short. For mid- to long-term purposes, the judgment may not be accurate and comprehensive enough. Short-term price fluctuations may cause misjudgments.
Also, the weighting of moving averages and variances affects the judgment results. If set improperly, the signals could be biased.
Optimization Directions
More time periods of different lengths could be added to form a combination to make the judgment more comprehensive, e.g. 10-day, 20-day for mid- to long-term purposes.
Different schemes of weights could also be tested to make the weighting setting more flexible. Parameter optimization could be introduced to auto-adjust the weights based on market conditions to reduce misjudgment probability.
In addition, other indicators could be incorporated, like abnormal trading volume, to avoid being misled by arbitrage trading.
Conclusion
The overall logic of this strategy is clear and easy to understand, using moving averages and variances to judge price trend and volatility, and then combining them to output a curve that can clearly identify highs and lows. Such multi-period combined judgment can effectively capture both short- and long-term market characteristics, improving the accuracy of inflection point detection. There is also large room for optimization, from aspects like periods, weights and indicators etc, to make the strategy more robust and comprehensive.
/*backtest
start: 2024-02-12 00:00:00
end: 2024-02-19 00:00:00
period: 12h
basePeriod: 15m
exchanges: [{"eid":"Futures_Binance","currency":"BTC_USDT"}]
*/

//@version=3
strategy("x²", overlay=false)


a1=(close[2]-close[3])/1
a2=(close[1]-close[3])/4
a3=(close[0]-close[3])/9

b1=(close[3]-close[4])/1
b2=(close[2]-close[4])/4
b3=(close[1]-close[4])/9
b4=(close[0]-close[4])/16

c1=(close[4]-close[5])/1
c2=(close[3]-close[5])/4
c3=(close[2]-close[5])/9
c4=(close[1]-close[5])/16
c5=(close[0]-close[5])/25

ma=(a1+a2+a3)/3
da=(a1-ma)*(a1-ma)
da:=da+(a2-ma)*(a2-ma)
da:=da+(a3-ma)*(a3-ma)
da:=sqrt(da)
da:=min(2, da)
da:=1-da/2
da:=max(0.001, da)


mb=(b1+b2+b3+b4)/4
db=(b1-mb)*(b1-mb)
db:=db+(b2-mb)*(b2-mb)
db:=db+(b3-mb)*(b3-mb)
db:=db+(b4-mb)*(b4-mb)
db:=sqrt(db)
db:=min(2, db)
db:=1-db/2
db:=max(0.001, db)

mc=(c1+c2+c3+c4+c5)/5
dc=(c1-mc)*(c1-mc)
dc:=dc+(c2-mc)*(c2-mc)
dc:=dc+(c3-mc)*(c3-mc)
dc:=dc+(c4-mc)*(c4-mc)
dc:=dc+(c5-mc)*(c5-mc)
dc:=sqrt(dc)
dc:=min(2, dc)
dc:=1-dc/2
dc:=max(0.001, dc)


g=close
if(da>db and da>dc)
    g:=da*da*ma
else
    if(db > da and db > dc)
        g:=db*db*mb
    else
        g:=dc*dc*mc

wg=wma(g, 2)
plot(wg)
plot(0, color=black)


longCondition = true //crossover(sma(close, 14), sma(close, 28))
if (longCondition)
    strategy.entry("My Long Entry Id", strategy.long)

shortCondition = true //crossunder(sma(close, 14), sma(close, 28))
if (shortCondition)
    strategy.entry("My Short Entry Id", strategy.short)
- Golden Cross Dead Cross Trading Strategy
- Supertrend Based Multitimeframe Trend Tracking Strategy
- Manual Buy & Sell Alerts Strategy
- Quantitative Breakthrough Uptrend Reference Strategy
- Adaptive Grid Trading Strategy Based on Quantitative Trading Platform
- Quantitative Trading Strategy Based on Ichimoku Cloud and Moving Average
- Dual Moving Average Reversal Tracking Strategy
- Bollinger Bands Reversal Strategy
- Ichimoku Kinko Hyo Cloud + QQE Quantitative Strategy
- All About Momentum Trading Strategy with Stop Loss for Gold
- Bollinger Bands Breakout Strategy
- Breakthrough Fair Value Gap Strategy
- Adaptive Moving Average Crossover System with Momentum Breakout
- Peak-to-Peak Pattern Based Trading Strategy
- Multiple EMA Buy Strategy
- OBV EMA Crossover Trend Following Strategy
- RSI and MA Crossover Trend Tracking Strategy
- Reversal Momentum Strategy with Double Confirmation
- EMA Crossover for Long Line Quant Strategy
- Extremum Reversion Tracking Strategy