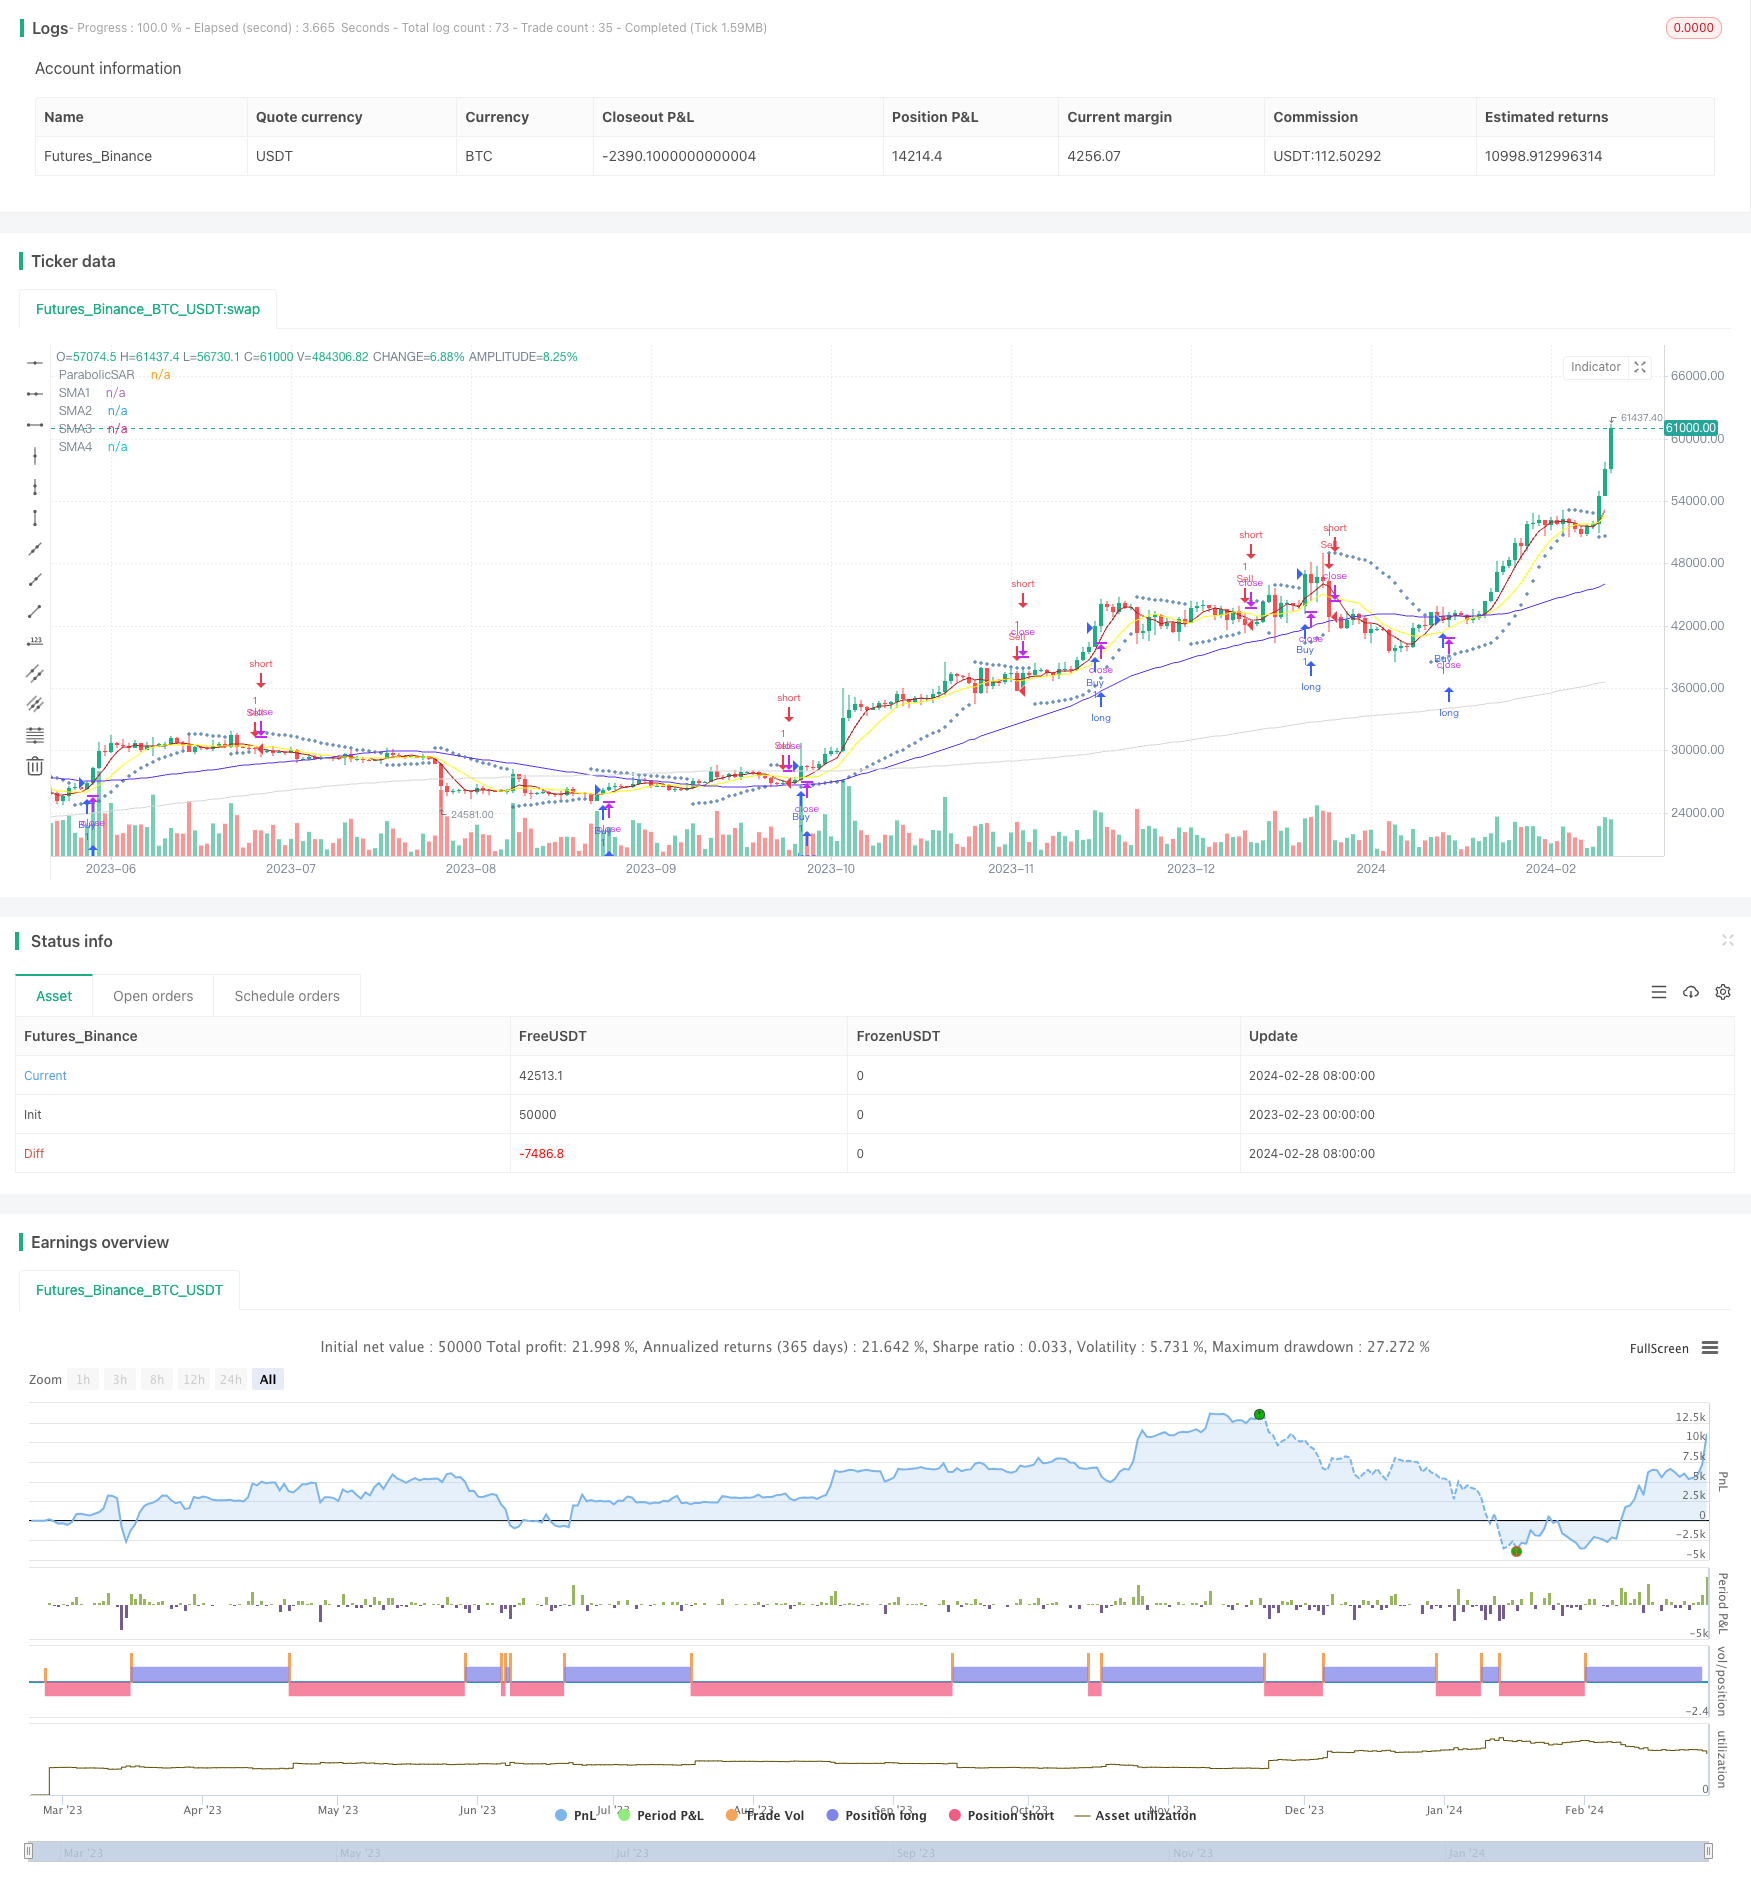
MACD, RSI and EMA Strategy
Author: ChaoZhang, Date: 2024-03-01 12:23:38Tags:

Overview
This strategy combines Simple Moving Average (SMA), Average True Range (ATR), Commodity Channel Index (CCI) and Bollinger Bands to identify short-term and mid-term price trends and provide support for trading decisions.
Strategy Principle
The strategy uses four SMA lines with different periods to recognize price trend direction, including 5-day, 10-day, 50-day and 200-day lines. ATR is used to measure market volatility and set stop-loss points. CCI is used to identify overbought and oversold conditions. The upper and lower rails of Bollinger Bands can serve as support/resistance levels.
Go long when the short-term SMA (5-day and 10-day lines) crosses above the long-term SMA (50-day and 200-day lines). Go short when the short-term SMA crosses below the long-term SMA. Sell when CCI is greater than 100; Buy when CCI is less than -100. Set stop loss based on ATR values.
Advantage Analysis
By combining the trend judgment of moving average lines and the overbought/oversold judgment of CCI, this strategy can effectively seize market opportunities. It works especially well for medium and short-term trading. In addition, the risk control is relatively scientific, which can maximize the avoidance of losses.
Risk Analysis
This strategy is relatively conservative and likely to miss trading signals. When there is range-bound market or trend reversal, profit-taking may be triggered prematurely. In addition, improper parameter settings can also affect performance.
Optimization Directions
Try to optimize the parameters of SMA to make them closer to current market conditions. The standard deviation of Bollinger Bands can also be adjusted for better performance as support/resistance levels. In addition, consider adding other indicators to assist judgment, such as KDJ, MACD etc. This may improve win rate of the strategy.
Summary
Integrating a variety of analytical tools to judge the market, this strategy can yield satisfactory investment returns when parameters are set appropriately. Its stop loss rules also make risks controllable. It is worthwhile to verify and optimize in paper trading and live trading.
/*backtest
start: 2023-02-23 00:00:00
end: 2024-02-29 00:00:00
period: 1d
basePeriod: 1h
exchanges: [{"eid":"Futures_Binance","currency":"BTC_USDT"}]
*/

// This source code is subject to the terms of the Mozilla Public License 2.0 at https://mozilla.org/MPL/2.0/
// © maizirul959

//@version=4
strategy("MACD,RSI & EMA strategy with MA+PSAR by MAM", overlay=true)

//Input Data
_ema_len1 = input(5, title="EMA1 length")
_ema_len2 = input(20, title="EMA2 length")

_macd_fast = input(12, title="MACD Fast")
_macd_slow = input(26, title="MACD Slow")
_macd_signal_len = input(20, title="MACD Signal length")

//MAM add SMA
_sma_len1 = input(5, title="SMA1 Length")
_sma_len2 = input(10, title="SMA2 Length")
_sma_len3 = input(50, title="SMA3 Length")
_sma_len4 = input(200, title="SMA4 Length")

lineWidth = input(1, minval=1, title="Line width")

src = input(close, title="Source")

SMA1 = if _sma_len1 != 0
    sma(src, _sma_len1)
SMA2 = if _sma_len2 != 0
    sma(src, _sma_len2)
SMA3 = if _sma_len3 != 0
    sma(src, _sma_len3)
SMA4 = if _sma_len4 != 0
    sma(src, _sma_len4)


//__________________________________________________________________________

_rsi_len = input(14, title="RSI length")
_rsi_signal_len = input(20, title="RSI signal length")

//_________________________________________________________________________
//MAM Add PSAR
PSAR_start = input(0.02)
PSAR_increment = input(0.02)
PSAR_maximum = input(0.2)

psar = sar(PSAR_start, PSAR_increment, PSAR_maximum)
//_________________________________________________________________________

_ema1 = ema(close, _ema_len1)
_ema2 = ema(close, _ema_len2)

//_________________________________________________________________________
//MAM add SMA
//_sma1 = ema(close, _sma_len1)
//_sma2 = ema(close, _sma_len2)
//_________________________________________________________________________

_macd = ema(close, _macd_fast) - ema(close, _macd_slow)
_macd_signal = ema(_macd, _macd_signal_len)

_rsi = rsi(close, _rsi_len)
_rsi_signal = ema(_rsi, _rsi_signal_len)


//PLOT SMA
plot(SMA1, color=#B71C1C, title="SMA1", linewidth=lineWidth)
plot(SMA2, color=#FFFF00, title="SMA2", linewidth=lineWidth)
plot(SMA3, color=#5b34ff, title="SMA3", linewidth=lineWidth)
plot(SMA4, color=#d7d7d7, title="SMA4", linewidth=lineWidth)


//PLOT PSAR
plot(psar, "ParabolicSAR", style=plot.style_cross, color=#3A6CA8)

//plot(_rsi, color=color.yellow)
//plot(_rsi_signal, color=color.green)
//plot(_macd, color=color.blue)
//plot(_macd_signal, color=color.red)


longCondition = close > _ema1 and close > _ema2 and _macd > _macd_signal and _rsi > _rsi_signal
if (longCondition)
    strategy.entry("Buy",strategy.long)

shortCondition = close < _ema1 and close <_ema2 and _macd < _macd_signal and _rsi < _rsi_signal
if (shortCondition)
    strategy.entry("Sell",strategy.short)
- RSI-based Dual Trading Strategy
- SSL Channel and Green Volume Strategy
- The EMA Cross Quantitative Strategy
- Dual-Filter Index Fund Strategy Based on Moving Averages and Supertrend Indicator
- Bollinger Bands Breakout Reentry Trading Strategy
- Breach of the equator
- Consecutive Candlestick Reversal Breakout Strategy
- Short-Term Trading Strategy Based on Bollinger Bands
- Multi-EMA and RSI Trend Following Strategy
- Gold Trading with Simons Strategy
- Trend Following Moving Average Strategy
- Quant Trading Strategy Based on HullMA Percentage Bands
- RSI and smoothed RSI bullish divergence strategy
- Dual-directional Trailing Stop Moving Average Trend Strategy
- The Breakout Regression Strategy
- Fast RSI Reversal Trading Strategy
- The Momentum Burst Tracking Strategy
- Elevated Touch Short Triangle Strategy
- Moving Average Crossover Trend Following Strategy
- Double Confirmation Breakthrough Strategy