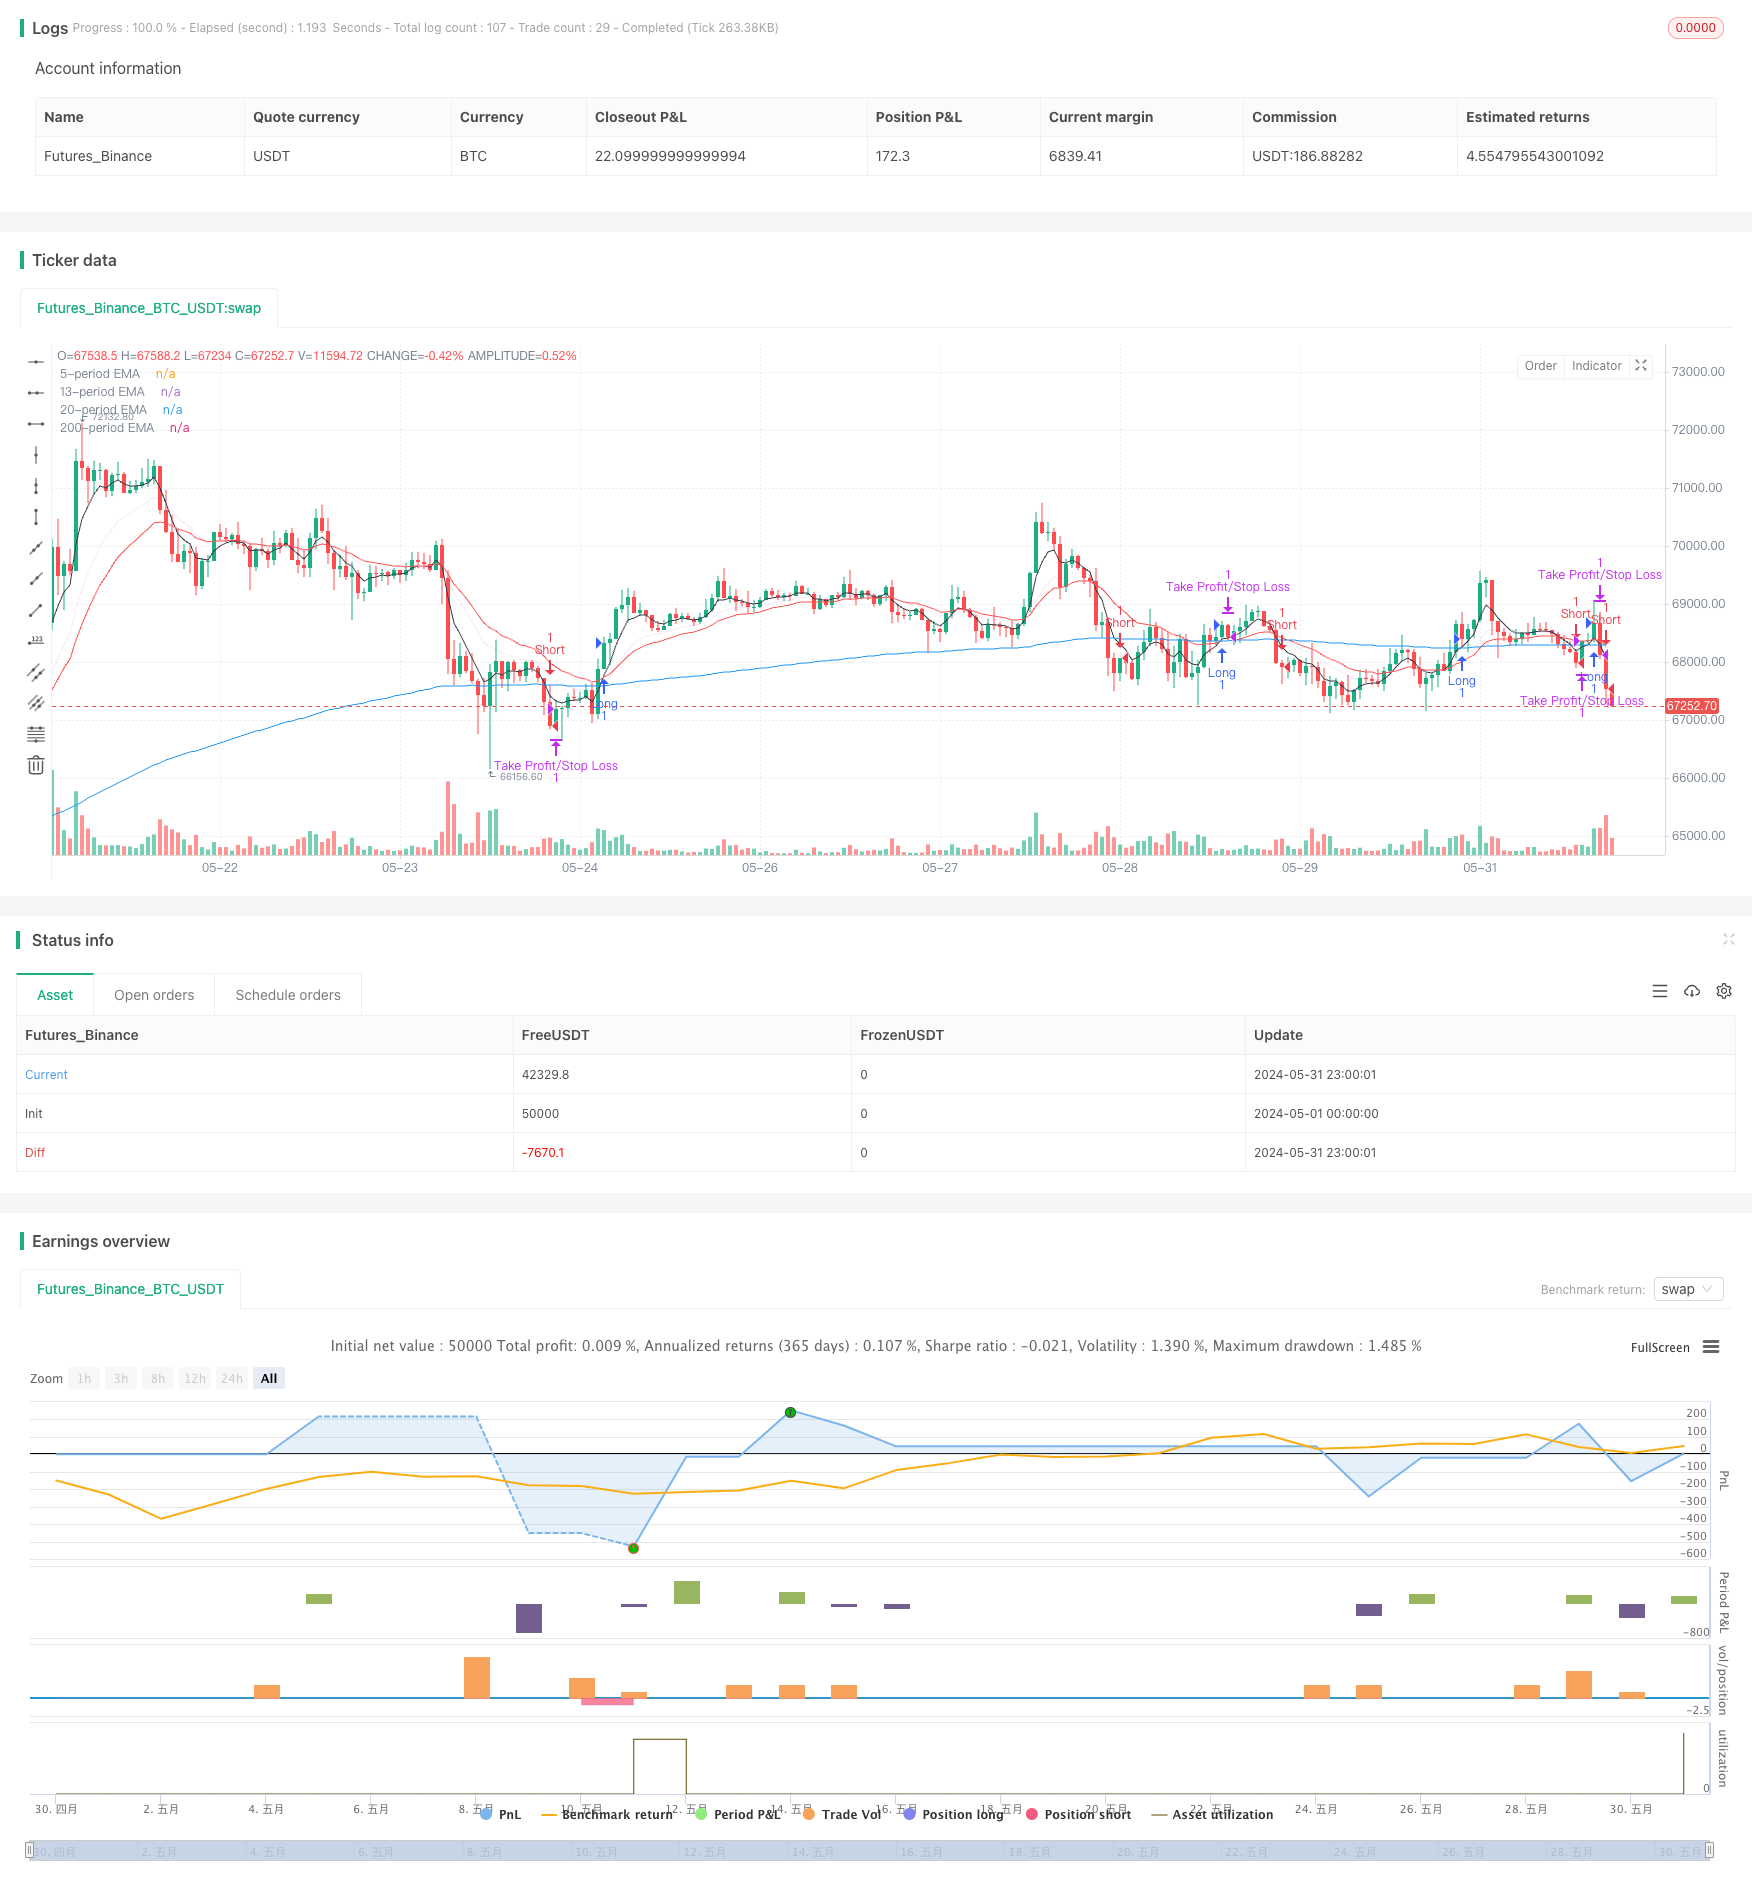
Overview
This strategy uses the crossover of two exponential moving averages (EMAs) with different periods as trading signals, while setting fixed-point stop loss and take profit levels. When the short-term EMA crosses above the long-term EMA, it opens a long position; when the short-term EMA crosses below the long-term EMA, it opens a short position. The strategy sets fixed-point stop loss and take profit levels to control risk and lock in profits.
Strategy Principle
- Calculate two EMAs with different periods, default to 5 and 200 periods.
- When the 5-period EMA crosses above the 200-period EMA, it generates a long signal; when the 5-period EMA crosses below the 200-period EMA, it generates a short signal.
- After opening a position, set stop loss points (default 50 points) and take profit points (default 200 points).
- Close the position when the price reaches the take profit or stop loss level, or the position has been held for 200 trading periods.
- Adjust the take profit and stop loss points based on the chart volume.
Strategy Advantages
- Simple and easy to understand: The strategy logic is clear and easy to understand and implement.
- Trend following: Utilizes the trend characteristics of EMAs to capture market trends effectively.
- Risk control: Setting fixed-point stop loss effectively controls the risk of a single trade.
- Flexibility: Take profit and stop loss points can be adjusted according to market volatility and personal risk preferences.
Strategy Risks
- False signals: EMA crossovers may generate false signals, leading to frequent trading and capital losses.
- Trend delay: EMAs are lagging indicators and may generate signals only after a trend has formed, missing the best entry opportunities.
- Range-bound markets: In range-bound markets, frequent EMA crossovers may lead to consecutive losing trades.
- Fixed-point stop loss: Fixed-point stop loss may not adapt to changes in market volatility, resulting in inappropriate stop loss levels.
Strategy Optimization Directions
- Introduce more indicators: Combine with other technical indicators such as MACD, RSI, etc., to improve signal reliability.
- Optimize parameters: Optimize parameters such as EMA periods, take profit and stop loss points, to improve strategy performance.
- Dynamic stop loss: Dynamically adjust stop loss points based on market volatility to better adapt to market changes.
- Position management: Introduce position management rules, such as risk-based position sizing, to improve risk-adjusted returns.
- Filters: Add trading signal filter conditions, such as trading volume, price patterns, etc., to improve signal quality.
Summary
The dual moving average crossover stop loss and take profit strategy is a simple and easy-to-use trading strategy that generates trading signals through EMA crossovers while setting fixed-point stop loss and take profit levels to control risk. The strategy’s advantages lie in its clear logic, easy implementation, and ability to capture market trends effectively. However, it also faces risks such as false signals, trend delays, range-bound markets, and fixed stop loss levels. Optimization directions include introducing more indicators, optimizing parameters, dynamic stop loss, position management, and adding filters. Traders can optimize and adjust the strategy according to their risk preferences and market characteristics to improve the strategy’s robustness and profitability.
/*backtest
start: 2024-05-01 00:00:00
end: 2024-05-31 23:59:59
period: 1h
basePeriod: 15m
exchanges: [{"eid":"Futures_Binance","currency":"BTC_USDT"}]
*/


//@version=5
strategy("EMA5 Cross EAM200 && SL/TP 50 and 200 Point Target", overlay=true)

// Define input parameters for EMA lengths
ema_5 = input.int(5, title="Fast EMA Length")
ema_200 = input.int(200, title="Slow EMA Length")

// Define input parameters for stop loss and profit target in points
stopLossPoints = input.float(50, title="Stop Loss (Points)")
profitTargetPoints = input.float(200, title="Profit Target (Points)")

// Calculate EMAs
price = close
emafast = ta.ema(price, ema_5)
emaslow = ta.ema(price, ema_200)

// Plot EMAs on chart
plot(emafast, title="5-period EMA", color=color.black)
plot(emaslow, title="200-period EMA", color=color.blue)

// Extra lines if needed
ema_13 = input.int(13, title="13 EMA")
ema_13_line = ta.ema(price, ema_13)
plot(ema_13_line, title="13-period EMA", color=color.rgb(156, 39, 176, 90))

ema_20 = input.int(20, title="20 EMA")
ema_20_line = ta.ema(price, ema_20)
plot(ema_20_line, title="20-period EMA", color=color.red)


// Define entry conditions
longCondition = ta.crossover(emafast, emaslow)
shortCondition = ta.crossunder(emafast, emaslow)

// Counter to keep track of the number of bars since the entry
var int barCount = na

// Reset counter and enter long trade
if (longCondition)
    strategy.entry("Long", strategy.long, comment="Long")
    barCount := 0

// Reset counter and enter short trade
if (shortCondition)
    strategy.entry("Short", strategy.short, comment="Short")
    barCount := 0

// Increment counter if in trade
if (strategy.opentrades > 0)
    barCount += 1

// Calculate entry price
entryPrice = strategy.position_avg_price

// Exit long trade if stop loss, profit target hit, or 200 points have been reached
if (strategy.position_size > 0)
    strategy.exit("Take Profit/Stop Loss", "Long", stop=entryPrice - stopLossPoints, limit=entryPrice + profitTargetPoints)

// Exit short trade if stop loss, profit target hit, or 200 points have been reached
if (strategy.position_size < 0)
    strategy.exit("Take Profit/Stop Loss", "Short", stop=entryPrice + stopLossPoints, limit=entryPrice - profitTargetPoints)