Overview
This strategy leverages the price relationship between two different markets. By monitoring changes in Market A over a 30-minute time frame, it identifies significant changes in Market A and triggers corresponding trades in Market B. When Market A decreases by 0.1% or more, the strategy establishes a short position in Market B; when Market A increases by 0.1% or more, the strategy establishes a long position in Market B. The strategy also allows users to customize take-profit and stop-loss percentages to optimize risk management and profit targets.
Strategy Principle
The core principle of this strategy is to exploit the negative correlation between the prices of two markets. Historical data has shown that the prices of Market A and Market B have an average negative correlation of -0.6. This means that when Market A falls, Market B prices tend to rise, and vice versa. The strategy captures significant changes in Market A by monitoring its changes over a 30-minute time frame and then establishes corresponding positions in Market B. Specifically, when Market A decreases by 0.1% or more, the strategy establishes a short position in Market B; when Market A increases by 0.1% or more, the strategy establishes a long position in Market B. At the same time, the strategy uses take-profit and stop-loss orders to manage the risk and profit of each trade.
Strategy Advantages
- Utilizes the negative correlation between the prices of two markets, providing a trading opportunity based on inter-market relationships.
- Uses a 30-minute time frame to capture significant changes in Market A while filtering out some short-term noise.
- Allows users to customize take-profit and stop-loss percentages, providing flexible risk management and profit target settings.
- Uses background colors to visualize trading signals, making it easy for users to quickly identify trading opportunities.
- Has a clear and easily understandable code structure, suitable for further optimization and customization.
Strategy Risks
- The negative correlation between the prices of two markets may not always be stable and could break down under certain market conditions.
- The fixed 0.1% price change threshold may not be suitable for all market environments and may need to be adjusted based on market volatility.
- The take-profit and stop-loss percentage settings need to be optimized based on market conditions and personal risk preferences; improper settings may lead to premature profit-taking or delayed stop-losses.
- The strategy only considers the price changes of Market A and does not incorporate other factors that may influence Market B prices, such as regulatory policies and market sentiment.
Strategy Optimization Directions
- Introduce dynamic thresholds: Dynamically adjust the price change threshold based on the historical volatility of Market A to adapt to different market environments.
- Incorporate other influencing factors: In addition to Market A, consider incorporating other macroeconomic indicators and market-specific factors to improve the strategy’s robustness.
- Optimize take-profit and stop-loss settings: Use more advanced take-profit and stop-loss setting methods, such as volatility-based adaptive take-profit/stop-loss and trailing stop-loss, to better manage risk and profit.
- Introduce position sizing: Dynamically adjust the position size of each trade based on market conditions and strategy performance to optimize capital utilization and risk management.
- Combine with other technical indicators: In addition to Market A price changes, combine with other technical analysis indicators, such as moving averages and relative strength index, to improve the reliability of trading signals.
Conclusion
This strategy exploits the negative correlation between the prices of two markets by monitoring significant changes in Market A and establishing corresponding positions in Market B. The strategy’s advantages lie in utilizing inter-market relationships to provide trading opportunities while allowing users to customize risk management and profit targets. However, the strategy also has some risks, such as the stability of the correlation and the limitations of fixed thresholds. In the future, the strategy can be optimized by introducing dynamic thresholds, incorporating other influencing factors, optimizing take-profit and stop-loss settings, introducing position sizing, and combining with other technical indicators to improve its robustness and profitability.
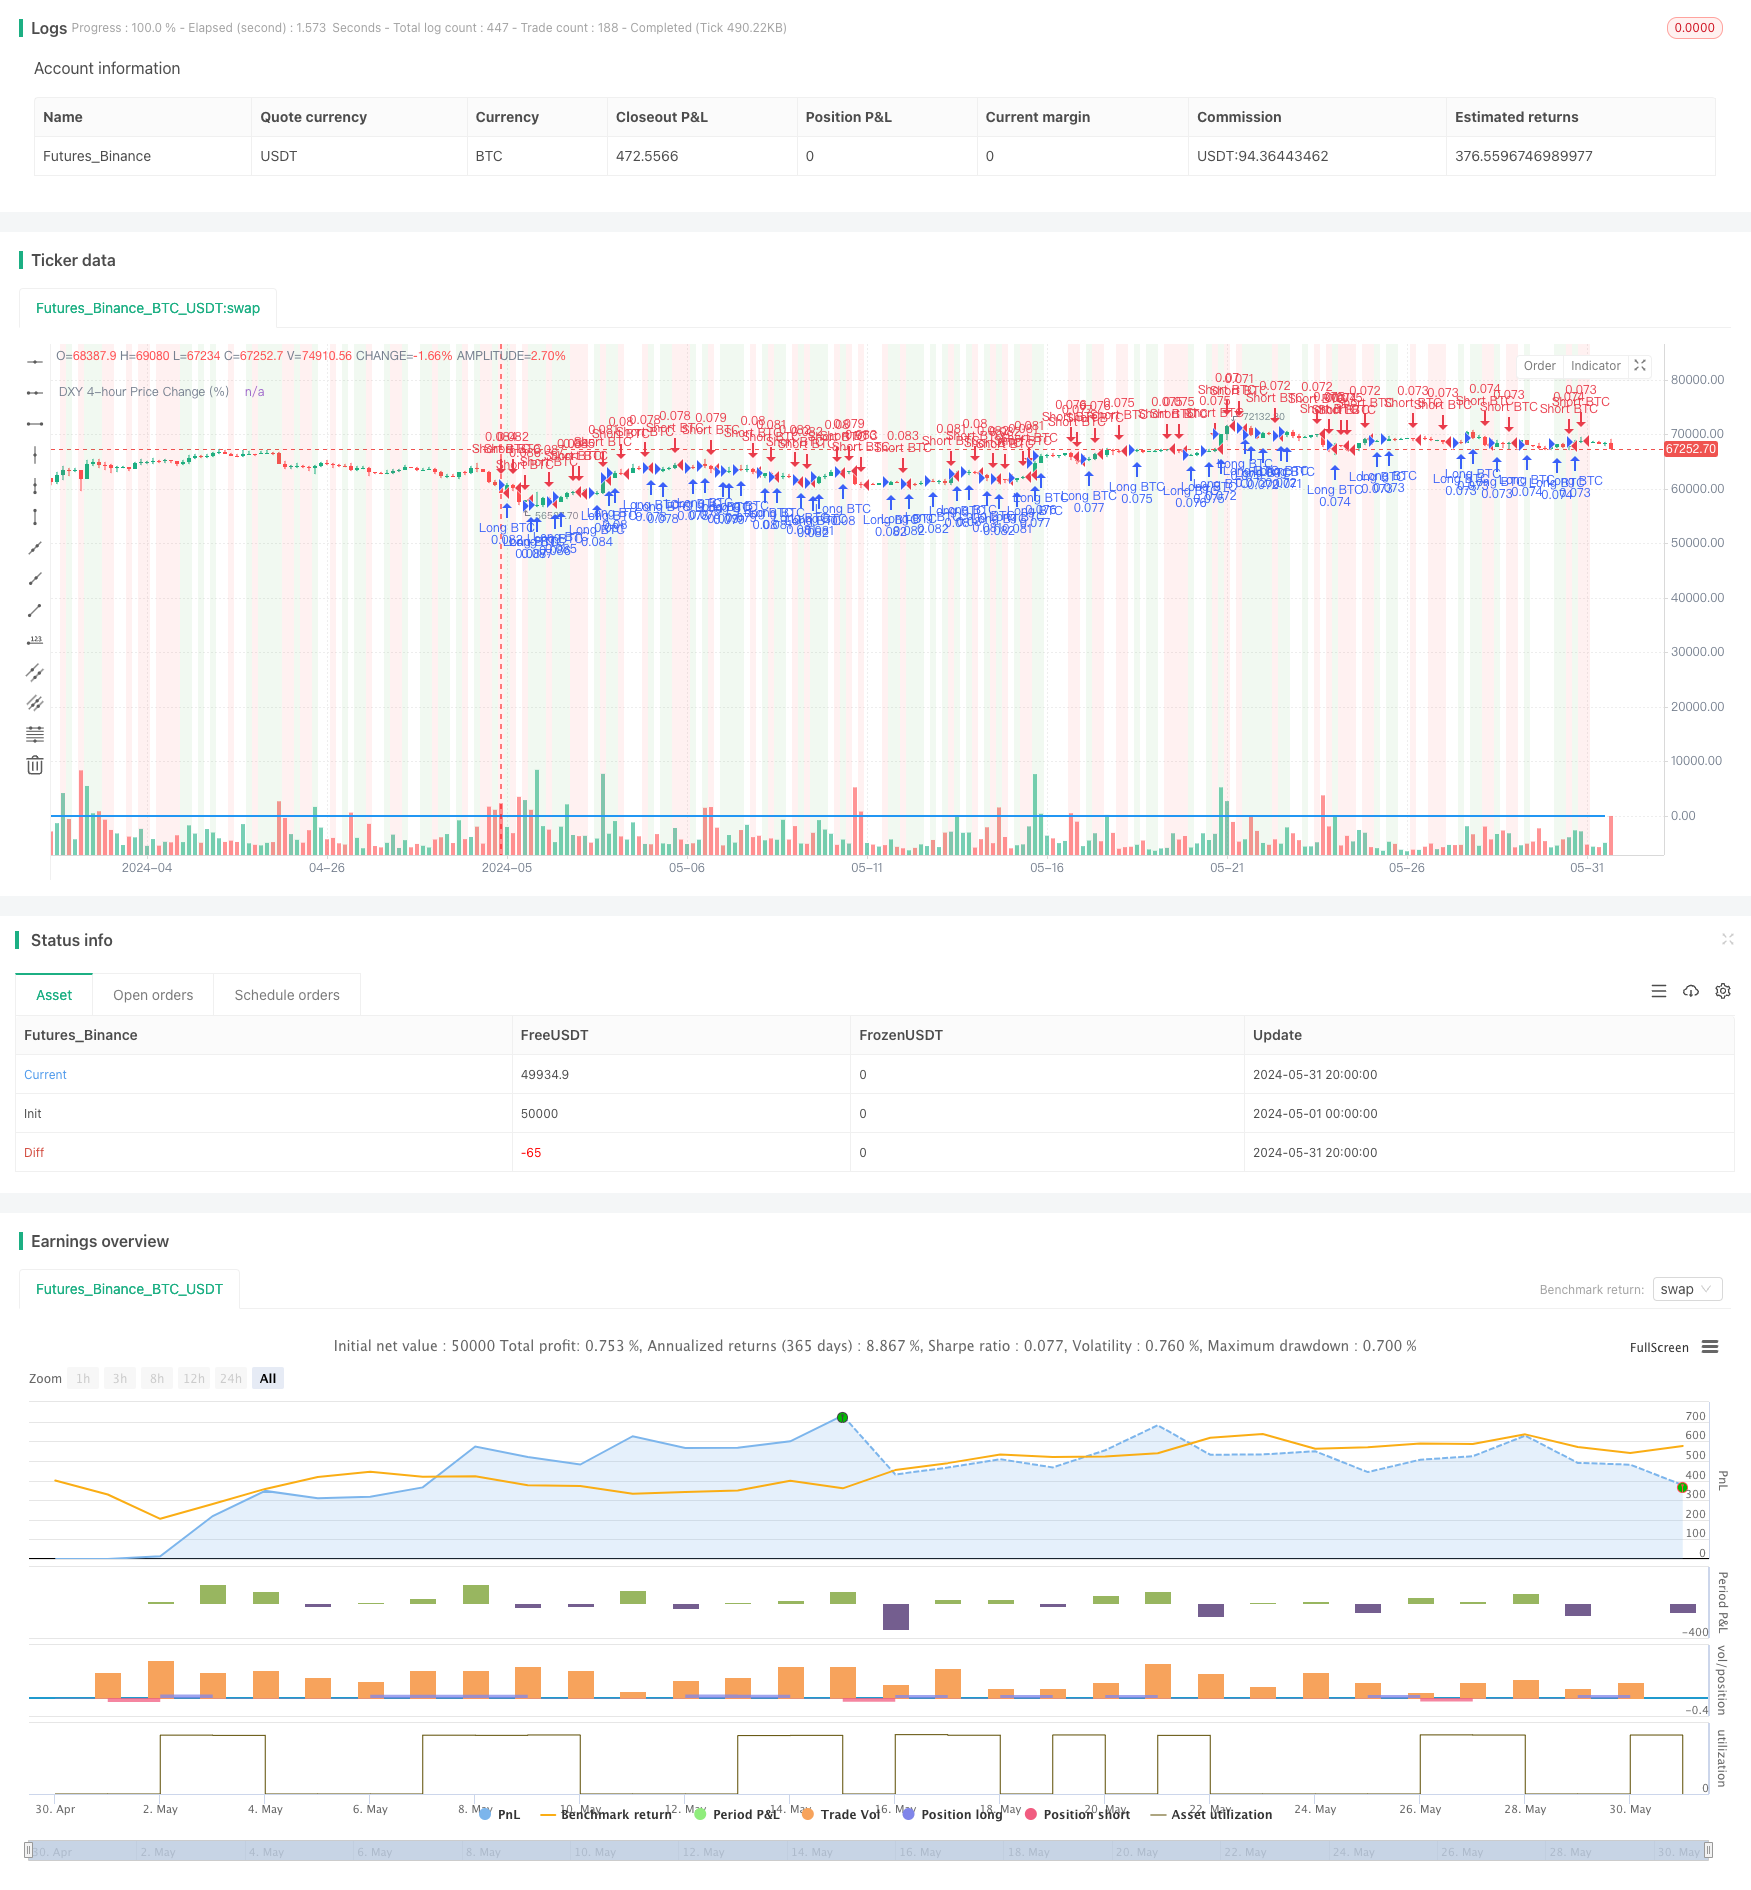
/*backtest
start: 2024-05-01 00:00:00
end: 2024-05-31 23:59:59
period: 4h
basePeriod: 15m
exchanges: [{"eid":"Futures_Binance","currency":"BTC_USDT"}]
*/

// This Pine Script™ code is subject to the terms of the Mozilla Public License 2.0 at https://mozilla.org/MPL/2.0/
// © Kingcoinmilioner

//@version=5
strategy("DXY/BTC Arbitrage Strategy", overlay=true, default_qty_type=strategy.percent_of_equity, default_qty_value=10)

// Input for Take Profit and Stop Loss
tp_percent = input.float(1.0, title="Take Profit (%)")
sl_percent = input.float(1.0, title="Stop Loss (%)")

// Fetching DXY data on a 4-hour interval
dxy = request.security("BTC_USDT:swap", "30", close)
dxy_open = request.security("BTC_USDT:swap", "30", open)

// Calculate the price change percentage
price_change_percent = (dxy - dxy_open) / dxy_open * 100

// Plot the price change percentage on the chart
plot(price_change_percent, title="DXY 4-hour Price Change (%)", color=color.blue, linewidth=2)

// Define trade entry conditions
short_condition = price_change_percent <= -0.1
long_condition = price_change_percent >= 0.1

// Initiate short BTC if DXY has a red candle of -0.1%
if (short_condition)
    strategy.entry("Short BTC", strategy.short)
    // Setting Take Profit and Stop Loss for short
    strategy.exit("Take Profit/Stop Loss Short", "Short BTC", limit=close * (1 - tp_percent / 100), stop=close * (1 + sl_percent / 100))

// Initiate long BTC if DXY has a green candle of 0.1%
if (long_condition)
    strategy.entry("Long BTC", strategy.long)
    // Setting Take Profit and Stop Loss for long
    strategy.exit("Take Profit/Stop Loss Long", "Long BTC", limit=close * (1 + tp_percent / 100), stop=close * (1 - sl_percent / 100))

// Visualization
bgcolor(short_condition ? color.new(color.red, 90) : na, title="Short BTC Signal")
bgcolor(long_condition ? color.new(color.green, 90) : na, title="Long BTC Signal")