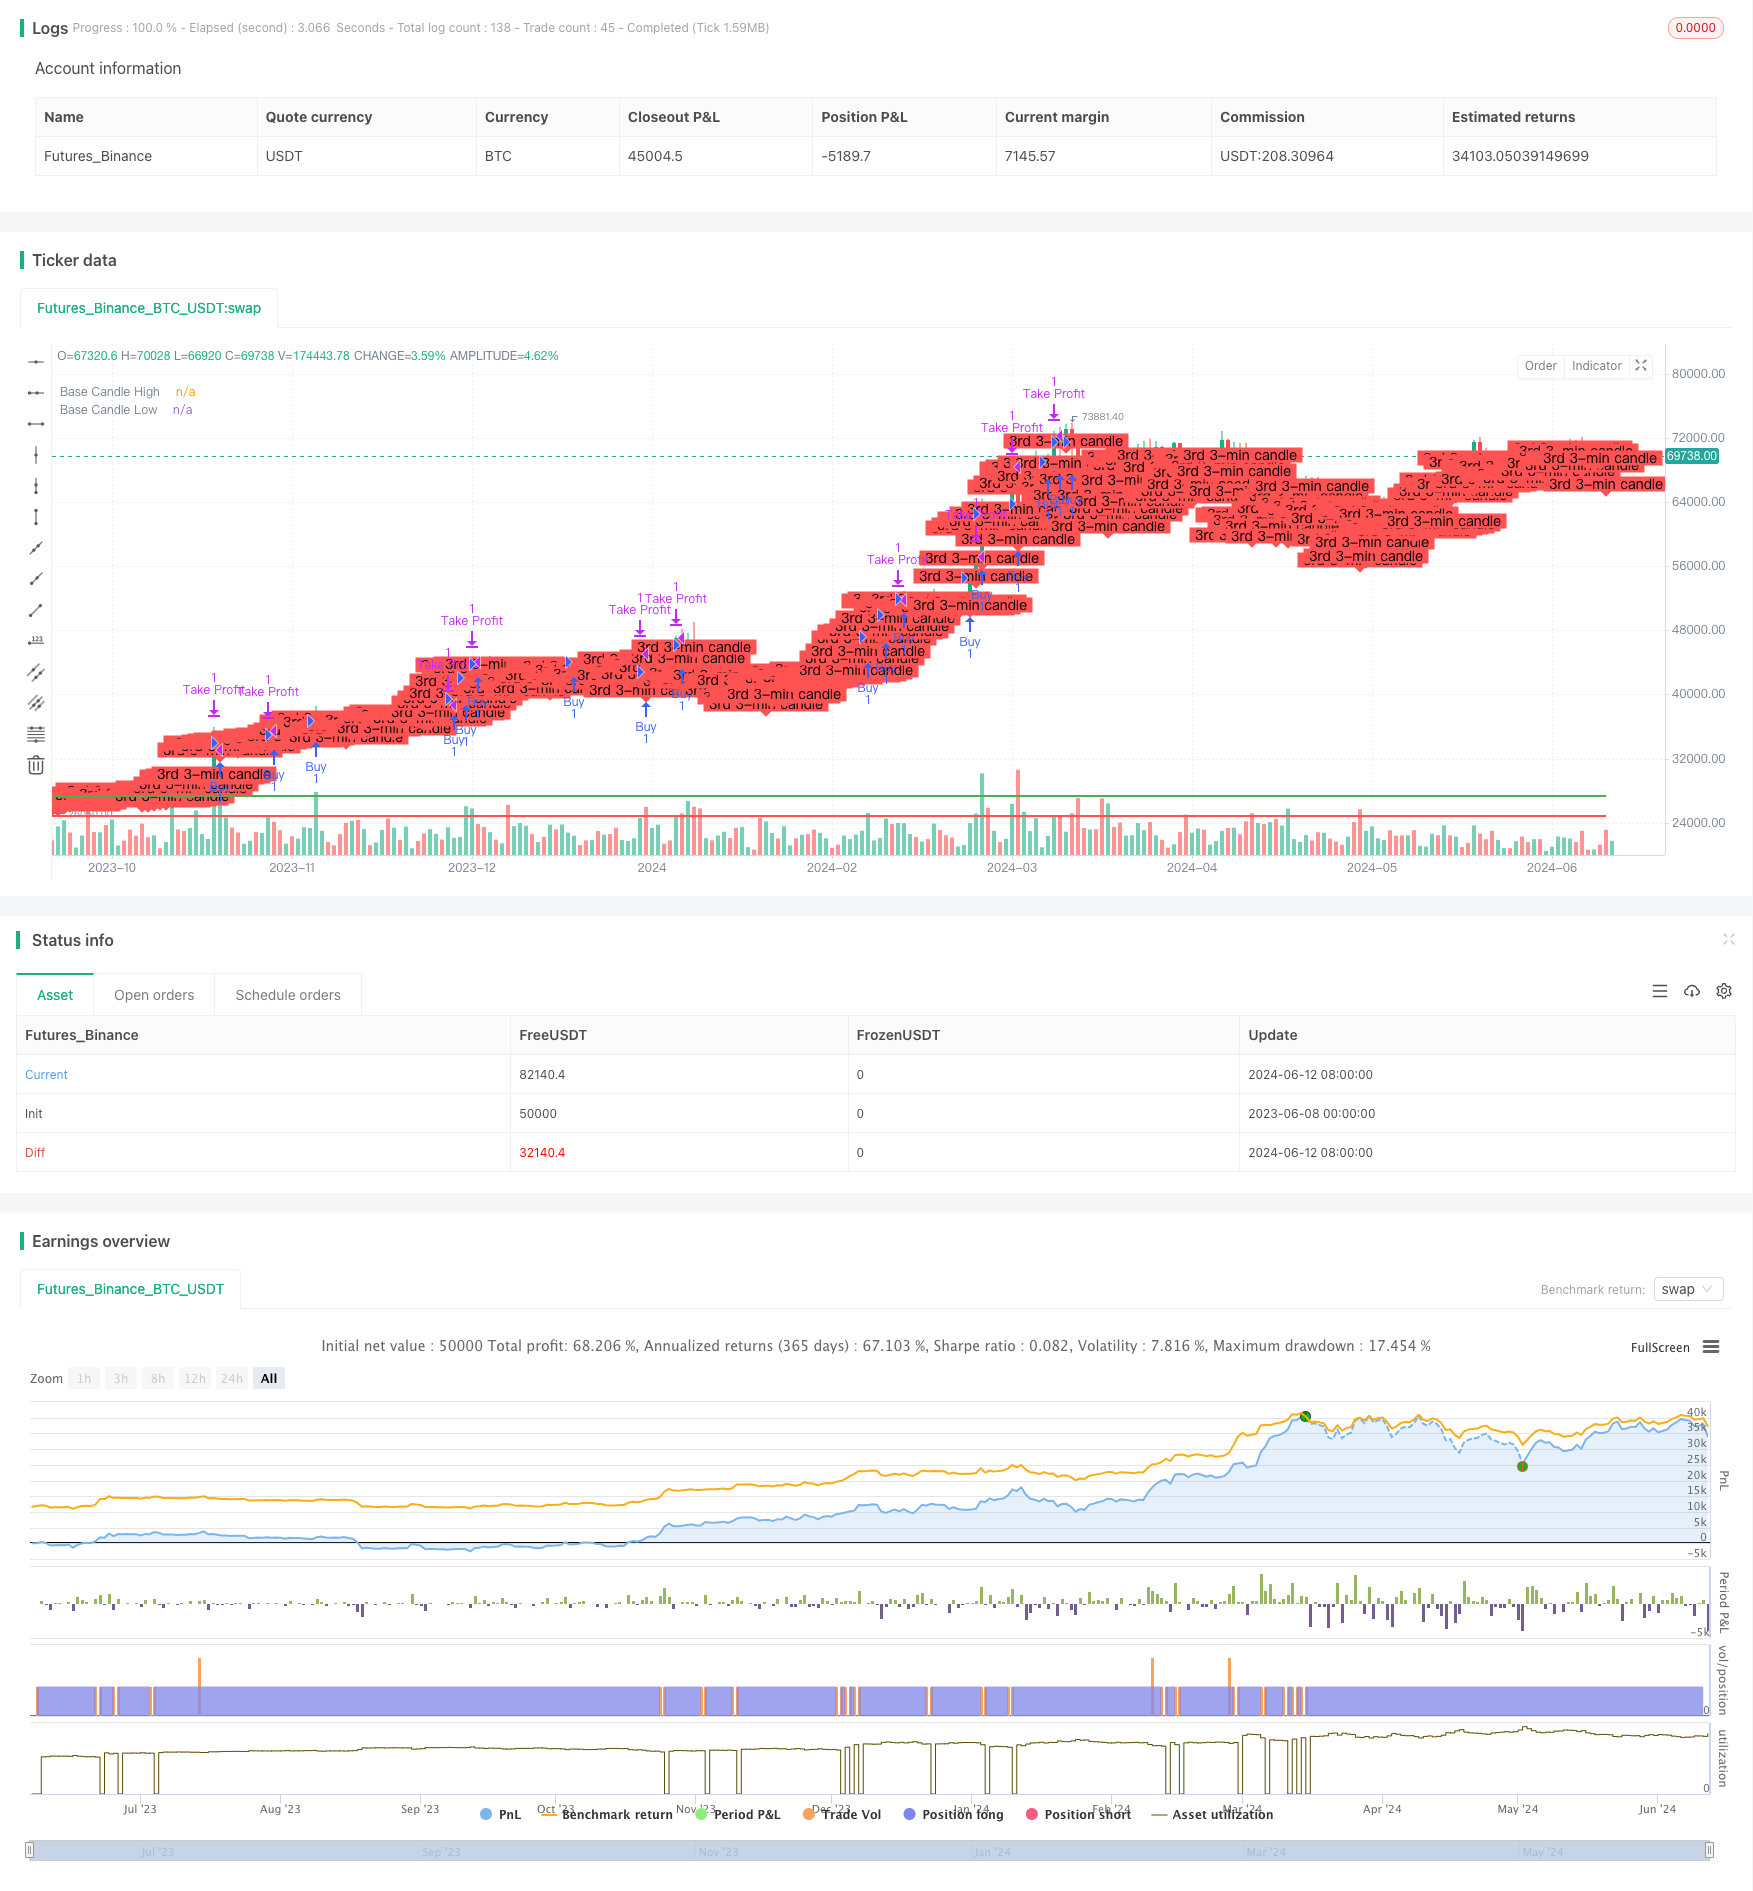
Overview
The main idea of this strategy is to use the high and low points of the three-minute candle as breakout points. When the price breaks through the high of the three-minute candle, it goes long, and when it breaks through the low, it goes short. This strategy is suitable for intraday trading, closing positions at the end of each day and continuing trading the next day. The advantage of this strategy is that it is simple, easy to understand, and easy to implement, with relatively low risk. However, there are also some risks associated with this strategy, such as the possibility of large drawdowns when market volatility is high.
Strategy Principle
- Obtain the candlestick data for the first three minutes after the market opens each day, and record the highest and lowest prices of the third candle.
- When the price breaks through the highest price of the third candle, open a long position with a target price of 100 points above the opening price, and close the position at the end of the day or when the target price is reached.
- When the price breaks through the lowest price of the third candle, open a short position with a target price of 100 points below the opening price, and close the position at the end of the day or when the target price is reached.
- Close all positions at the end of each day and continue trading the next day.
Strategy Advantages
- Simple and easy to understand and implement.
- Suitable for intraday trading with high capital utilization.
- Relatively low risk with clear stop-loss positions.
- Suitable for markets with strong trends.
Strategy Risks
- May experience large drawdowns when market volatility is high.
- High risk during the opening time period when price fluctuations are large.
- Difficult to grasp the position of the breakout point, easy to misjudge.
Strategy Optimization Direction
- Consider adding indicators such as moving averages to filter out noise signals in oscillating markets.
- Consider optimizing the opening time to avoid the opening time period.
- Consider optimizing the take-profit and stop-loss points to improve strategy stability.
- Consider adding position management to control drawdown risk.
Summary
This strategy is based on the breakout of the high and low points of the three-minute candle and is suitable for intraday trading. The advantage is that it is simple, easy to understand, and easy to implement, with relatively low risk. However, there are also some risks, such as the possibility of large drawdowns when market volatility is high. To improve the stability and profitability of the strategy, consider optimizing it in terms of filtering signals, optimizing opening times, optimizing take-profit and stop-loss points, and adding position management.
/*backtest
start: 2023-06-08 00:00:00
end: 2024-06-13 00:00:00
period: 1d
basePeriod: 1h
exchanges: [{"eid":"Futures_Binance","currency":"BTC_USDT"}]
*/

//@version=5
strategy("Banknifty Strategy", overlay=true, default_qty_type=strategy.fixed, default_qty_value=1)

// Parameters
start_date = input(timestamp("2024-01-01 00:00"), title="Start Date")
end_date = input(timestamp("2024-06-07 23:59"), title="End Date")

// Time settings
var startTime = timestamp("2024-06-09 09:15")
var endTime = timestamp("2024-06-09 09:24")

// Variables to store the 3rd 3-minute candle
var bool isCandleFound = false
var float thirdCandleHigh = na
var float thirdCandleLow = na
var float baseCandleHigh = na
var float baseCandleLow = na
var float entryPrice = na
var float targetPrice = na

// Check if the current time is within the specified date range
inDateRange = true

// Capture the 3rd 3-minute candle
if (inDateRange and not isCandleFound)
    var int candleCount = 0
    if (true)
        candleCount := candleCount + 1
        if (candleCount == 3)
            thirdCandleHigh := high
            thirdCandleLow := low
            isCandleFound := true

// Wait for a candle to close above the high of the 3rd 3-minute candle
if (isCandleFound and na(baseCandleHigh) and close > thirdCandleHigh)
    baseCandleHigh := close
    baseCandleLow := low

// Strategy logic for buying and selling
if (not na(baseCandleHigh))
    // Buy condition
    if (high > baseCandleHigh and strategy.opentrades == 0)
        entryPrice := high
        targetPrice := entryPrice + 100
        strategy.entry("Buy", strategy.long, limit=entryPrice)
    // Sell condition
    if (low < baseCandleLow and strategy.opentrades == 0)
        entryPrice := low
        targetPrice := entryPrice - 100
        strategy.entry("Sell", strategy.short, limit=entryPrice)

// Exit conditions
if (strategy.opentrades > 0)
    // Exit BUY trade when profit is 100 points or carry forward to next day
    if (strategy.position_size > 0 and high >= targetPrice)
        strategy.exit("Take Profit", from_entry="Buy", limit=targetPrice)
    // Exit SELL trade when profit is 100 points or carry forward to next day
    if (strategy.position_size < 0 and low <= targetPrice)
        strategy.exit("Take Profit", from_entry="Sell", limit=targetPrice)

// Close trades at the end of the day
if (time == timestamp("2024-06-09 15:30"))
    strategy.close("Buy", comment="Market Close")
    strategy.close("Sell", comment="Market Close")

// Plotting for visualization
plotshape(series=isCandleFound, location=location.belowbar, color=color.red, style=shape.labeldown, text="3rd 3-min candle")
plot(baseCandleHigh, title="Base Candle High", color=color.green, linewidth=2, style=plot.style_line)
plot(baseCandleLow, title="Base Candle Low", color=color.red, linewidth=2, style=plot.style_line)