Overview
This strategy combines the Pivot Point SuperTrend indicator and the Double Exponential Moving Average (DEMA) indicator to generate trading signals by analyzing the price position relative to these two indicators. When the price breaks above the Pivot Point SuperTrend indicator and is higher than the DEMA indicator, a long signal is generated; when the price breaks below the Pivot Point SuperTrend indicator and is lower than the DEMA indicator, a short signal is generated. This strategy can capture the medium to long-term market trends while also responding to short-term price fluctuations.
Strategy Principle
- Calculate the Pivot Point SuperTrend indicator: The midpoint is calculated by taking the average of the highest and lowest prices over a certain period, and then the upper and lower bands are calculated based on the Average True Range (ATR), forming dynamic support and resistance levels.
- Calculate the DEMA indicator: First, calculate the Exponential Moving Average (EMA) of the closing price, then calculate the EMA of the EMA, and finally subtract the DEMA from twice the EMA to get the final DEMA indicator.
- Generate trading signals: When the closing price breaks above the upper band of the Pivot Point SuperTrend and is higher than the DEMA indicator, a long signal is generated; when the closing price breaks below the lower band of the Pivot Point SuperTrend and is lower than the DEMA indicator, a short signal is generated.
- Set stop loss and take profit: Calculate the specific stop loss and take profit prices based on the pip value, preset stop loss pips, and take profit pips.
Strategy Advantages
- Strong trend-following ability: The Pivot Point SuperTrend indicator can effectively capture market trends, while the DEMA indicator can eliminate price noise and provide a smoother basis for trend judgment. The combination of the two can accurately grasp the main market trends.
- Strong adaptability: By dynamically adjusting the upper and lower bands of the Pivot Point SuperTrend indicator, the strategy can adapt to different market volatility situations, improving its adaptability.
- Strong risk control ability: By setting clear stop loss and take profit positions, the risk exposure of a single transaction can be effectively controlled, while also timely locking in existing profits.
Strategy Risks
- Parameter setting risk: The strategy’s performance depends on the settings of multiple parameters, such as the pivot point period, ATR factor, DEMA length, etc. Different parameter combinations may lead to large differences in strategy performance, requiring careful selection and optimization.
- Range-bound market risk: In a range-bound market environment, frequent trading signals may lead to overtrading, increasing transaction costs and slippage risks.
- Trend reversal risk: When the market trend reverses, the strategy may experience consecutive losses, requiring timely adjustment of the strategy in combination with other analysis methods.
Strategy Optimization Directions
- Parameter optimization: Conduct parameter optimization tests on different time periods and trading instruments to find the best parameter combination and improve the stability and profitability of the strategy.
- Signal filtering: When trading signals are generated, they can be further confirmed in combination with other technical indicators or price behavior characteristics to improve the reliability of signals and reduce losses caused by false signals.
- Position management: Dynamically adjust the position size of each trade according to market volatility and account risk tolerance to control overall risk exposure.
- Portfolio optimization: Combine this strategy with other strategies or trading systems to diversify risk and enhance stability, improving the long-term performance of the strategy.
Summary
By combining the Pivot Point SuperTrend indicator and the DEMA indicator, this strategy can effectively capture market trends while also responding to short-term fluctuations. The strategy has advantages such as strong trend-following ability, strong adaptability, and strong risk control ability, but also faces risks such as parameter setting, range-bound markets, and trend reversals. Through parameter optimization, signal filtering, position management, and portfolio optimization, the stability and profitability of the strategy can be further improved to better adapt to different market environments.
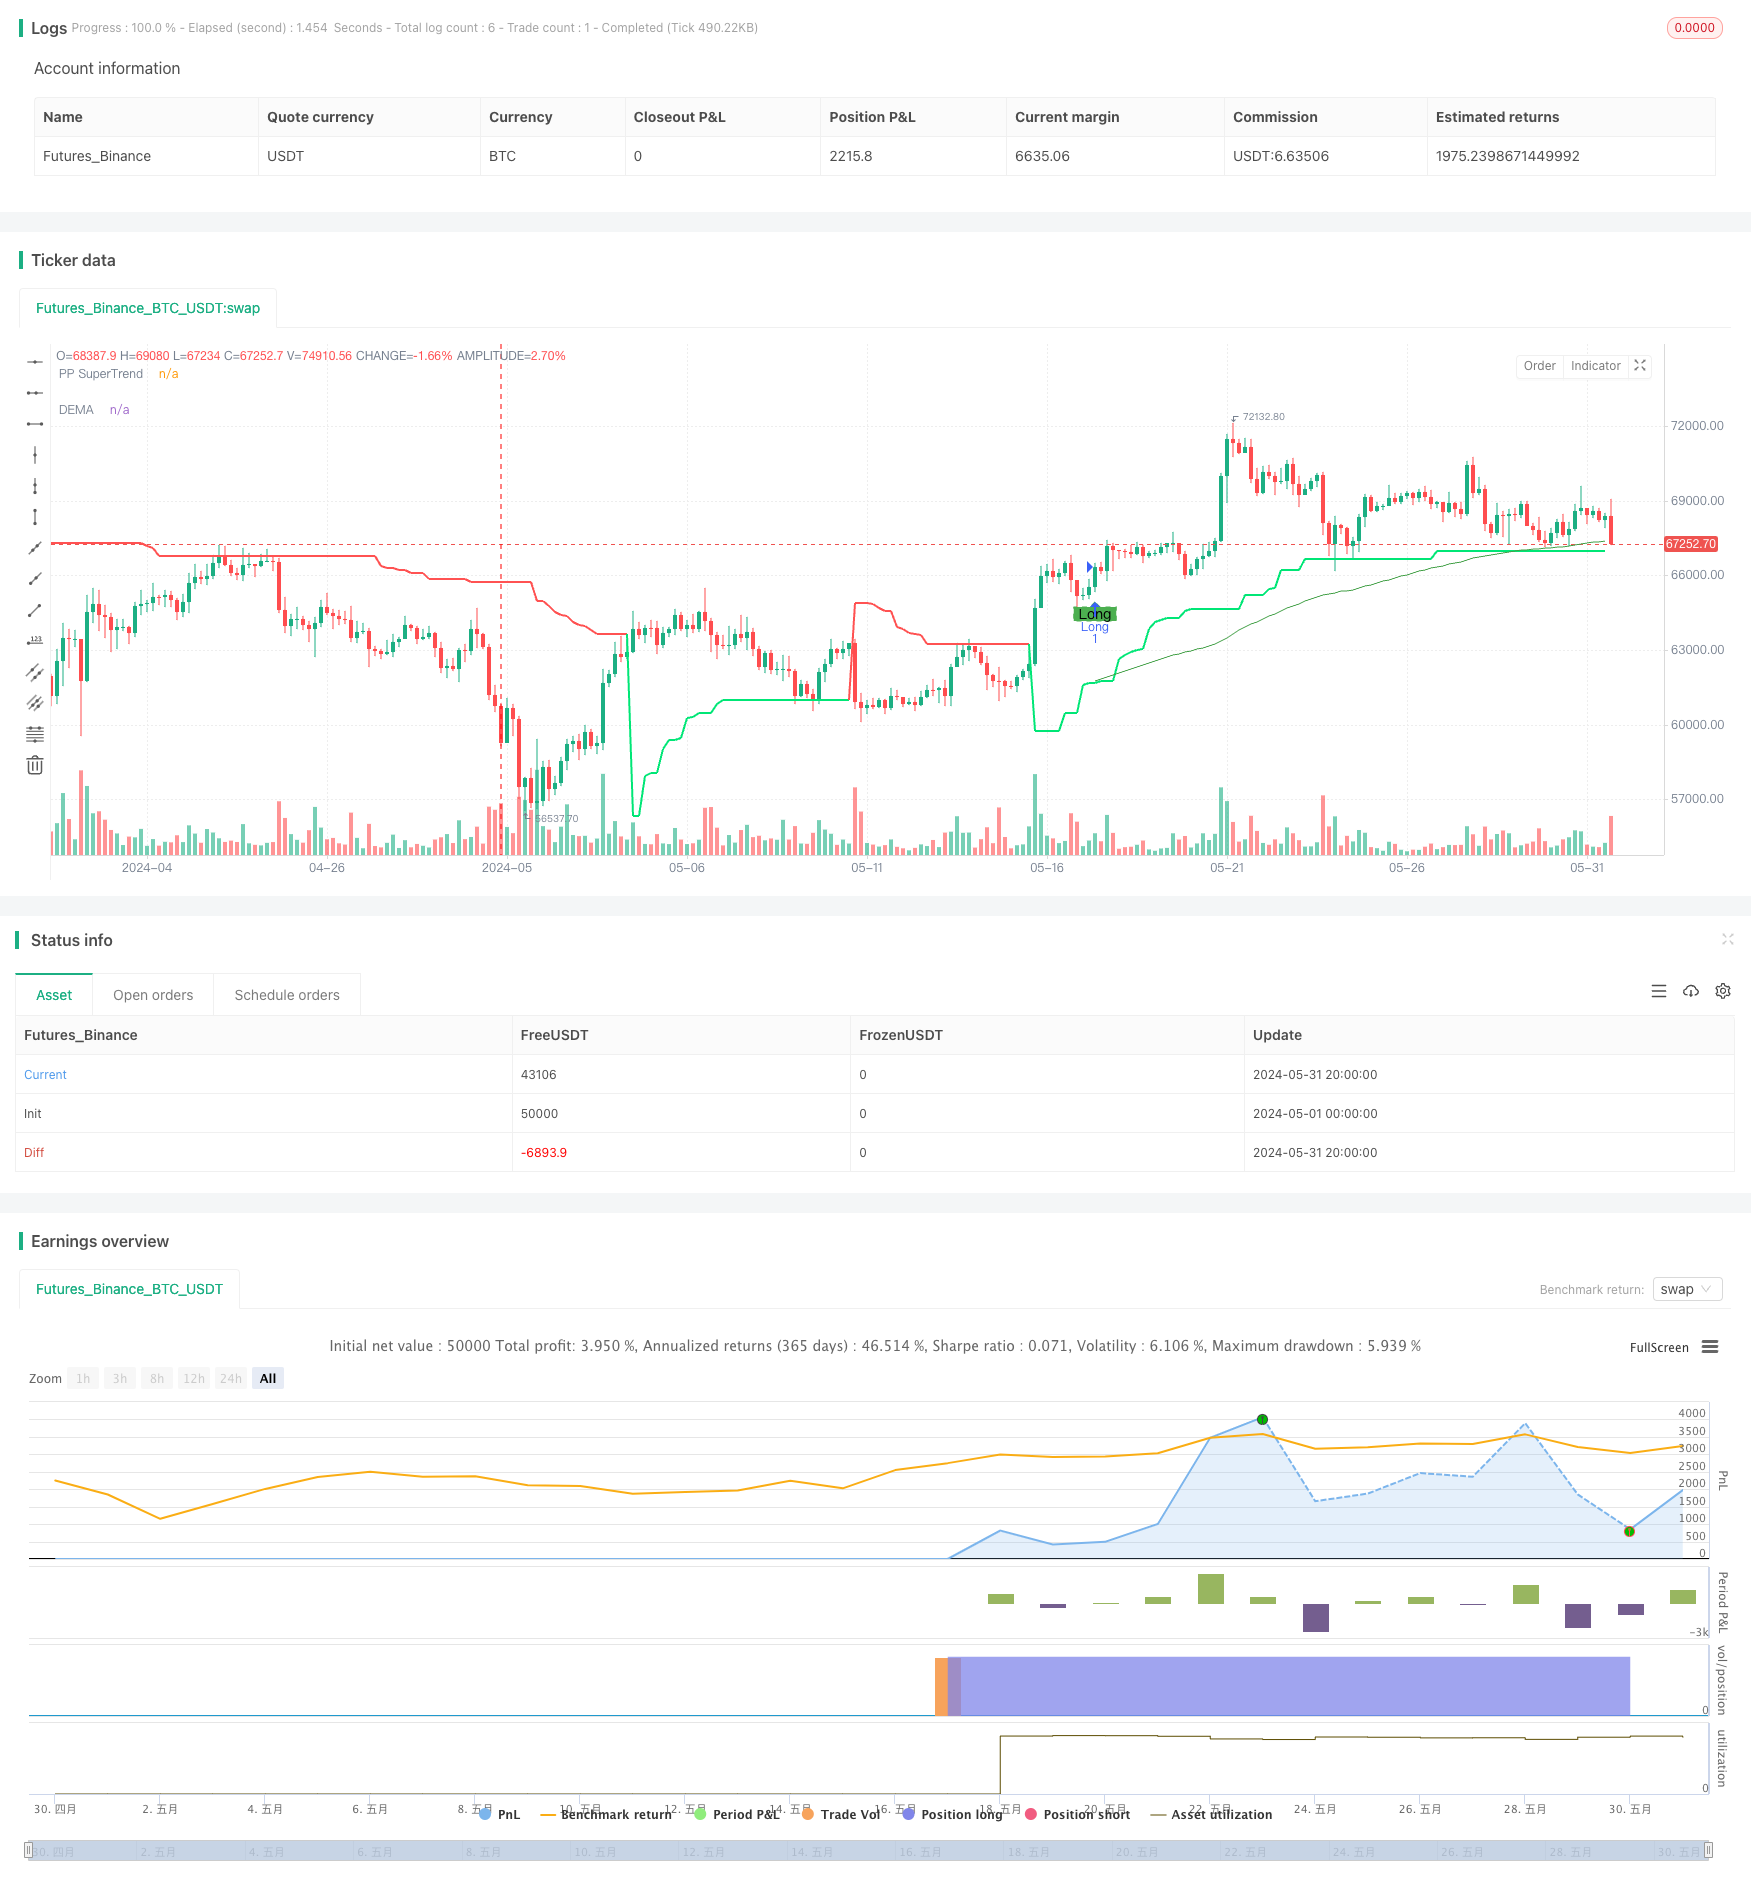
/*backtest
start: 2024-05-01 00:00:00
end: 2024-05-31 23:59:59
period: 4h
basePeriod: 15m
exchanges: [{"eid":"Futures_Binance","currency":"BTC_USDT"}]
*/

//@version=5
strategy("Simple Combined Strategy: Pivot Point SuperTrend and DEMA", overlay=true)

// Pivot Point SuperTrend settings
prd = input.int(2, title="Pivot Point Period", minval=1, maxval=50)
Factor = input.float(3.0, title="ATR Factor", minval=1, step=0.1)
Pd = input.int(10, title="ATR Period", minval=1)

// Double EMA settings
demaLength = input.int(200, title="DEMA Length", minval=1)
src = input(close, title="Source")

// Pip settings
pipValue = input.float(0.0001, title="Pip Value")
stopLossPips = input.int(15, title="Stop Loss (pips)")
takeProfitPips = input.int(35, title="Take Profit (pips)")

// Pivot Point SuperTrend Calculation
float ph = ta.pivothigh(prd, prd)
float pl = ta.pivotlow(prd, prd)
var float center = na
if not na(ph)
    center := na(center) ? ph : (center * 2 + ph) / 3
if not na(pl)
    center := na(center) ? pl : (center * 2 + pl) / 3

Up = center - (Factor * ta.atr(Pd))
Dn = center + (Factor * ta.atr(Pd))
var float TUp = na
var float TDown = na
var int Trend = na

if na(Trend)
    TUp := Up
    TDown := Dn
    Trend := close > Dn ? 1 : -1
else
    TUp := close[1] > TUp[1] ? math.max(Up, TUp[1]) : Up
    TDown := close[1] < TDown[1] ? math.min(Dn, TDown[1]) : Dn
    Trend := close > TDown[1] ? 1 : close < TUp[1] ? -1 : nz(Trend[1], 1)

Trailingsl = Trend == 1 ? TUp : TDown
linecolor = Trend == 1 ? color.lime : color.red
plot(Trailingsl, color=linecolor, linewidth=2, title="PP SuperTrend")

// Double EMA Calculation
e1 = ta.ema(src, demaLength)
e2 = ta.ema(e1, demaLength)
dema = 2 * e1 - e2
plot(dema, "DEMA", color=color.new(#43A047, 0))

// Strategy Logic
longCondition = close > Trailingsl and close > dema and strategy.position_size <= 0
shortCondition = close < Trailingsl and close < dema and strategy.position_size >= 0

// Plot signals
plotshape(series=longCondition, title="Long", location=location.belowbar, color=color.green, style=shape.labelup, text="Long")
plotshape(series=shortCondition, title="Short", location=location.abovebar, color=color.red, style=shape.labeldown, text="Short")

// Strategy Entry and Exit
if (longCondition)
    strategy.entry("Long", strategy.long, stop=close - (stopLossPips * pipValue), limit=close + (takeProfitPips * pipValue))
if (shortCondition)
    strategy.entry("Short", strategy.short, stop=close + (stopLossPips * pipValue), limit=close - (takeProfitPips * pipValue))

alertcondition(longCondition, title="Long Alert", message="Long Signal")
alertcondition(shortCondition, title="Short Alert", message="Short Signal")