Overview
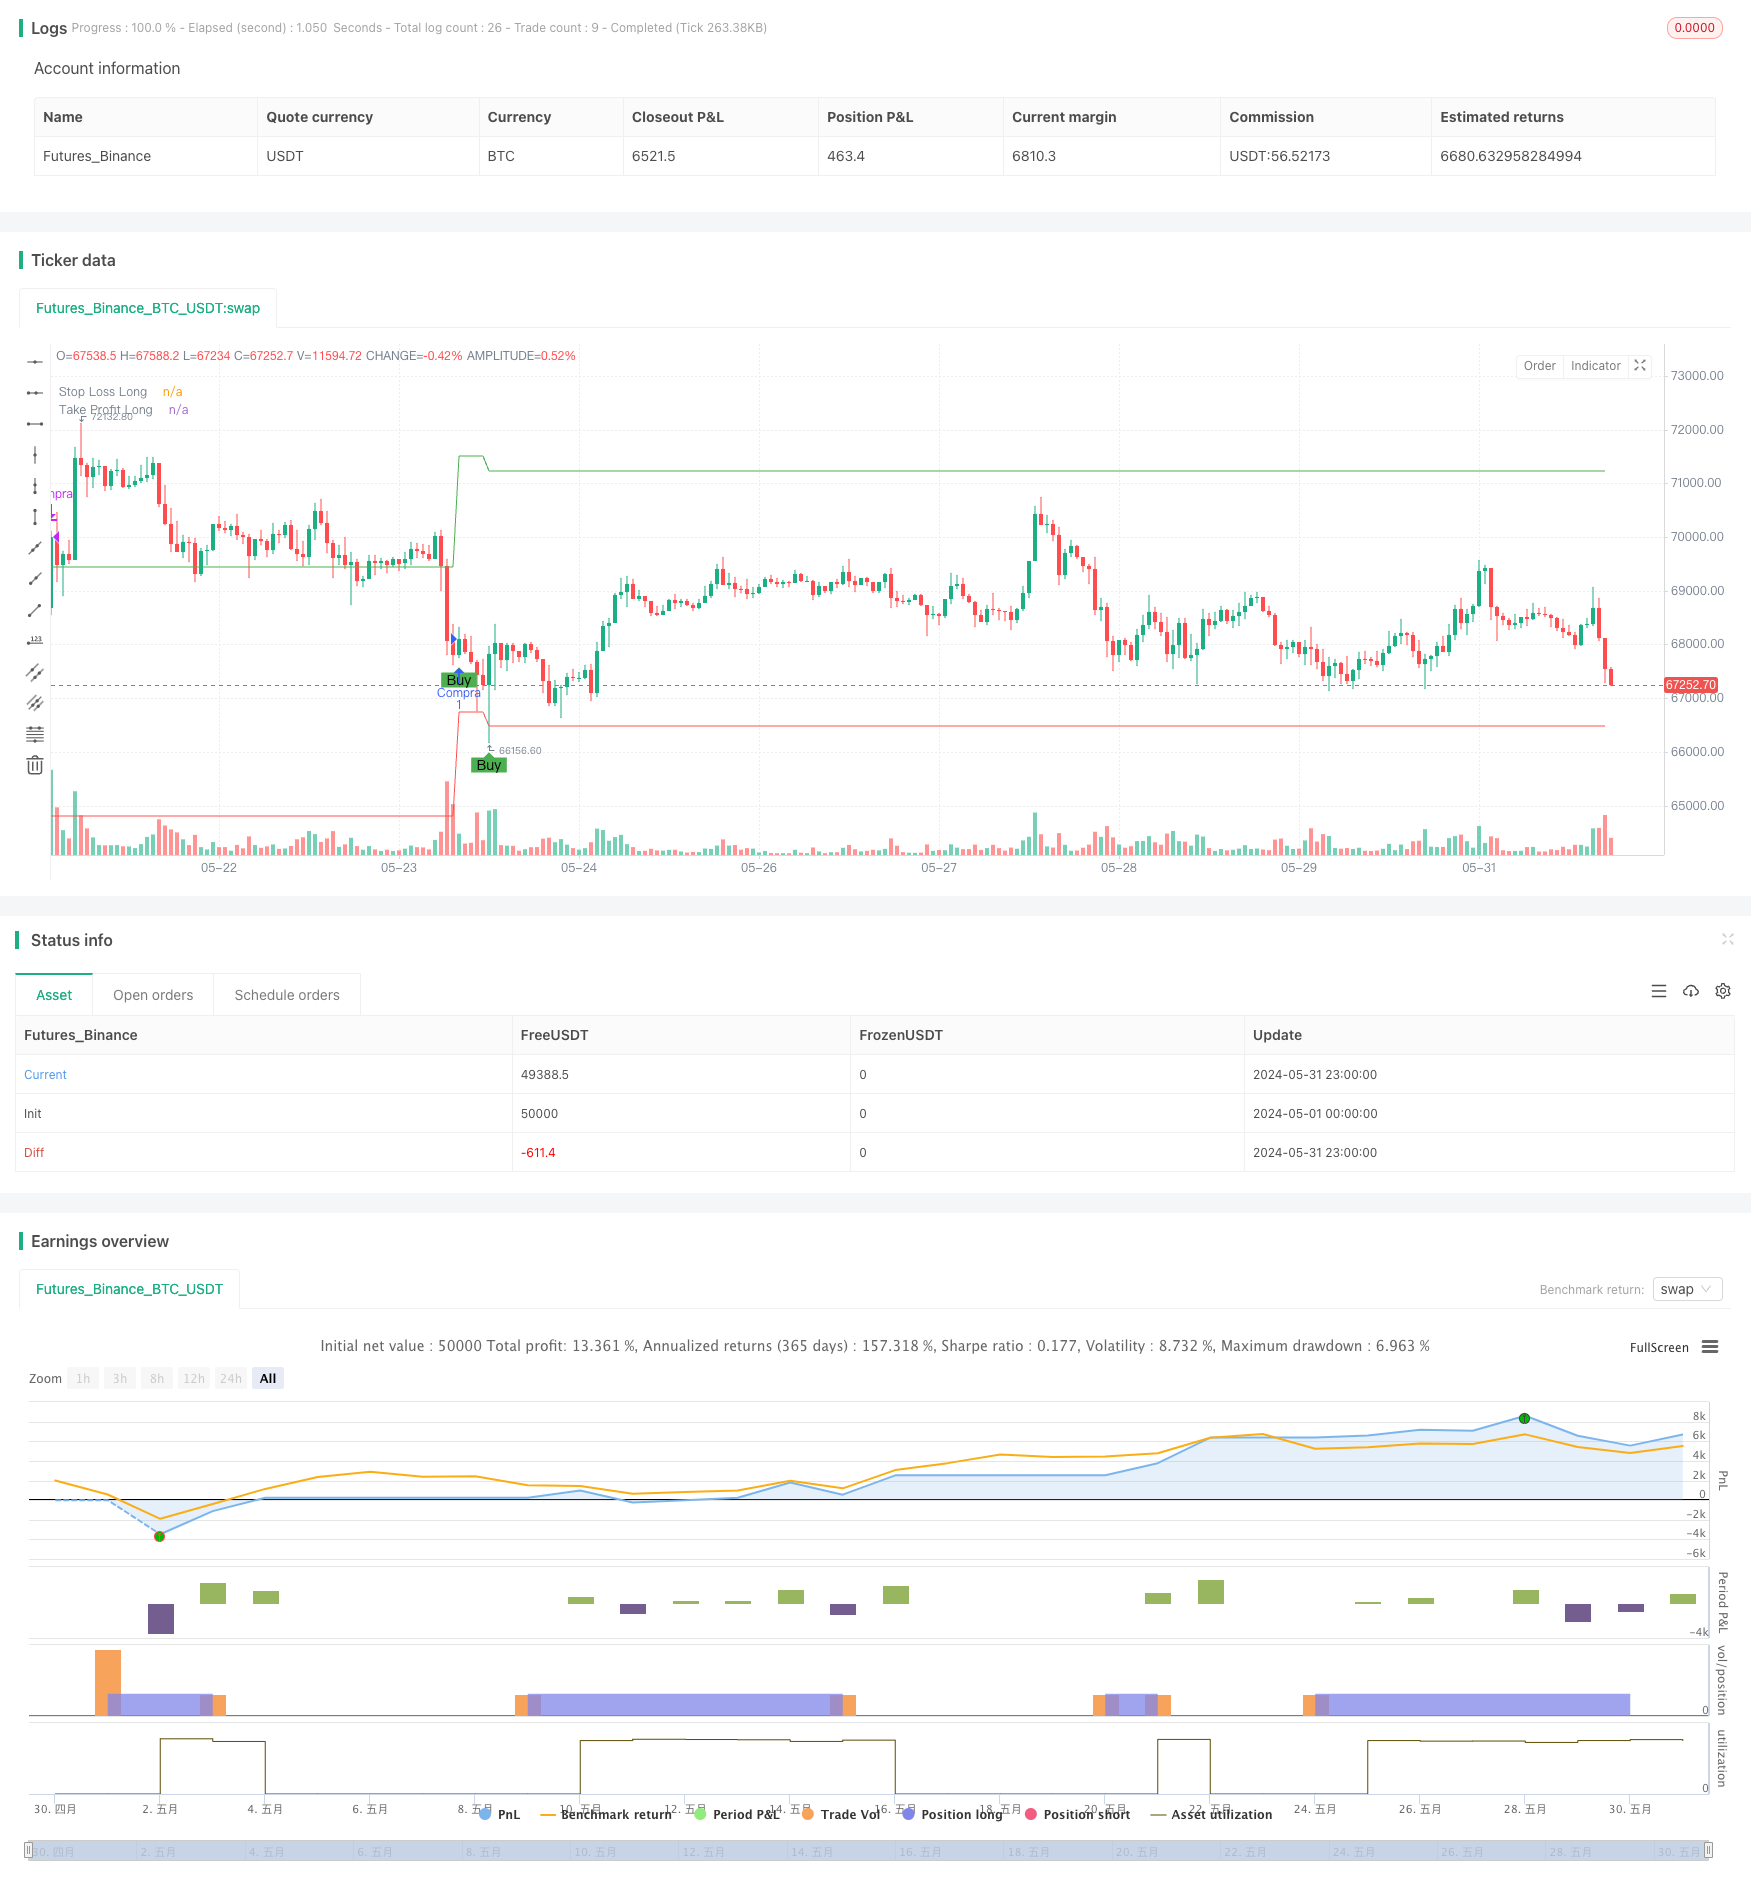
This strategy utilizes the Relative Strength Index (RSI) to determine the oversold condition of the market. When the RSI falls below a set oversold threshold, it generates a buy signal. At the same time, it sets a stop loss and take profit to control risk and lock in profits. The strategy only takes long positions and does not short.
Strategy Principle
- Calculate the RSI indicator to measure the overbought and oversold state of the market.
- When the RSI falls below the set oversold threshold (default is 30), generate a buy signal.
- After buying, calculate the stop loss and take profit prices based on the current closing price and the set stop loss and take profit percentages.
- During the holding period, if the price reaches the stop loss price, close the position at a loss; if the price reaches the take profit price, close the position at a profit.
- While holding a position, no new buy signals will be generated until the current position is closed.
Strategy Advantages
- Simple and easy to use: The strategy logic is clear and only requires setting a few parameters, making it suitable for novice users.
- Trend tracking: By using the RSI indicator to determine oversold conditions, it can participate in the early stages of a trend and capture potential reversal opportunities.
- Risk control: By setting stop losses and take profits, it can effectively control the risk exposure of a single trade while locking in profits already obtained.
Strategy Risks
- Parameter optimization: The performance of the strategy depends on the selection of parameters such as the RSI period and oversold threshold, and different parameter settings may bring different results.
- Market risk: When the market continues to decline, the RSI may remain in the oversold area for a long time, leading to frequent false signals.
- Trend risk: The strategy performs well in oscillating markets, but in strong trending markets, due to the lack of trend tracking ability, it may miss out on some profits.
Strategy Optimization Directions
- Add trend filtering: Before generating a buy signal, first determine whether the current market is in an upward trend. Moving averages or other trend indicators can be used to assist in judgment.
- Optimize stop loss and take profit: Consider using a trailing stop or dynamic take profit, automatically adjusting the position of the stop loss and take profit as prices change, in pursuit of a higher return-to-risk ratio.
- Combine with other indicators: Consider combining RSI with other indicators (such as MACD, Bollinger Bands, etc.) to improve the reliability and accuracy of signals.
Summary
This strategy uses the RSI indicator to capture oversold reversal opportunities in the market while setting fixed stop losses and take profits to control risk. The strategy logic is simple and clear, suitable for novice users. However, this strategy also has certain limitations, such as weak ability to grasp trends and signal reliability needs to be improved. Therefore, in practical applications, we can consider optimizing and improving the strategy from aspects such as trend judgment, stop loss and take profit optimization, and indicator combination to obtain more robust trading performance.
/*backtest
start: 2024-05-01 00:00:00
end: 2024-05-31 23:59:59
period: 1h
basePeriod: 15m
exchanges: [{"eid":"Futures_Binance","currency":"BTC_USDT"}]
*/

//@version=5
strategy("Estratégia com RSI (Apenas Compras)", overlay=true)

// Parâmetros de entrada
rsiLength = input.int(14, title="Período do RSI")
oversold = input.int(30, title="Nível de Sobrevenda (RSI)")
stopLossPercent = input.float(2.0, title="Stop Loss (%)")
takeProfitPercent = input.float(5.0, title="Take Profit (%)")

// Cálculo do RSI
rsi = ta.rsi(close, rsiLength)

// Sinal de Compra
buySignal = ta.crossover(rsi, oversold)

// Plotando o sinal de compra
plotshape(series=buySignal, location=location.belowbar, color=color.green, style=shape.labelup, title="Compra", text="Buy")

// Variáveis para Stop Loss e Take Profit
var float longStop = na
var float longTake = na

// Entrando na posição de compra
if (buySignal)
    entryPrice = close
    longStop := entryPrice * (1 - stopLossPercent / 100)
    longTake := entryPrice * (1 + takeProfitPercent / 100)
    strategy.entry("Compra", strategy.long)
    label.new(x=bar_index, y=low, text="Compra", style=label.style_label_up, color=color.green)

// Gerenciamento de Stop Loss e Take Profit
if (strategy.position_size > 0)
    if (close <= longStop)
        strategy.close("Compra", comment="Stop Loss")
        label.new(x=bar_index, y=low, text="Stop Loss", style=label.style_label_down, color=color.red)
    if (close >= longTake)
        strategy.close("Compra", comment="Take Profit")
        label.new(x=bar_index, y=high, text="Take Profit", style=label.style_label_up, color=color.green)

// Plotando as linhas de Stop Loss e Take Profit
plot(longStop, color=color.red, linewidth=1, title="Stop Loss Long")
plot(longTake, color=color.green, linewidth=1, title="Take Profit Long")