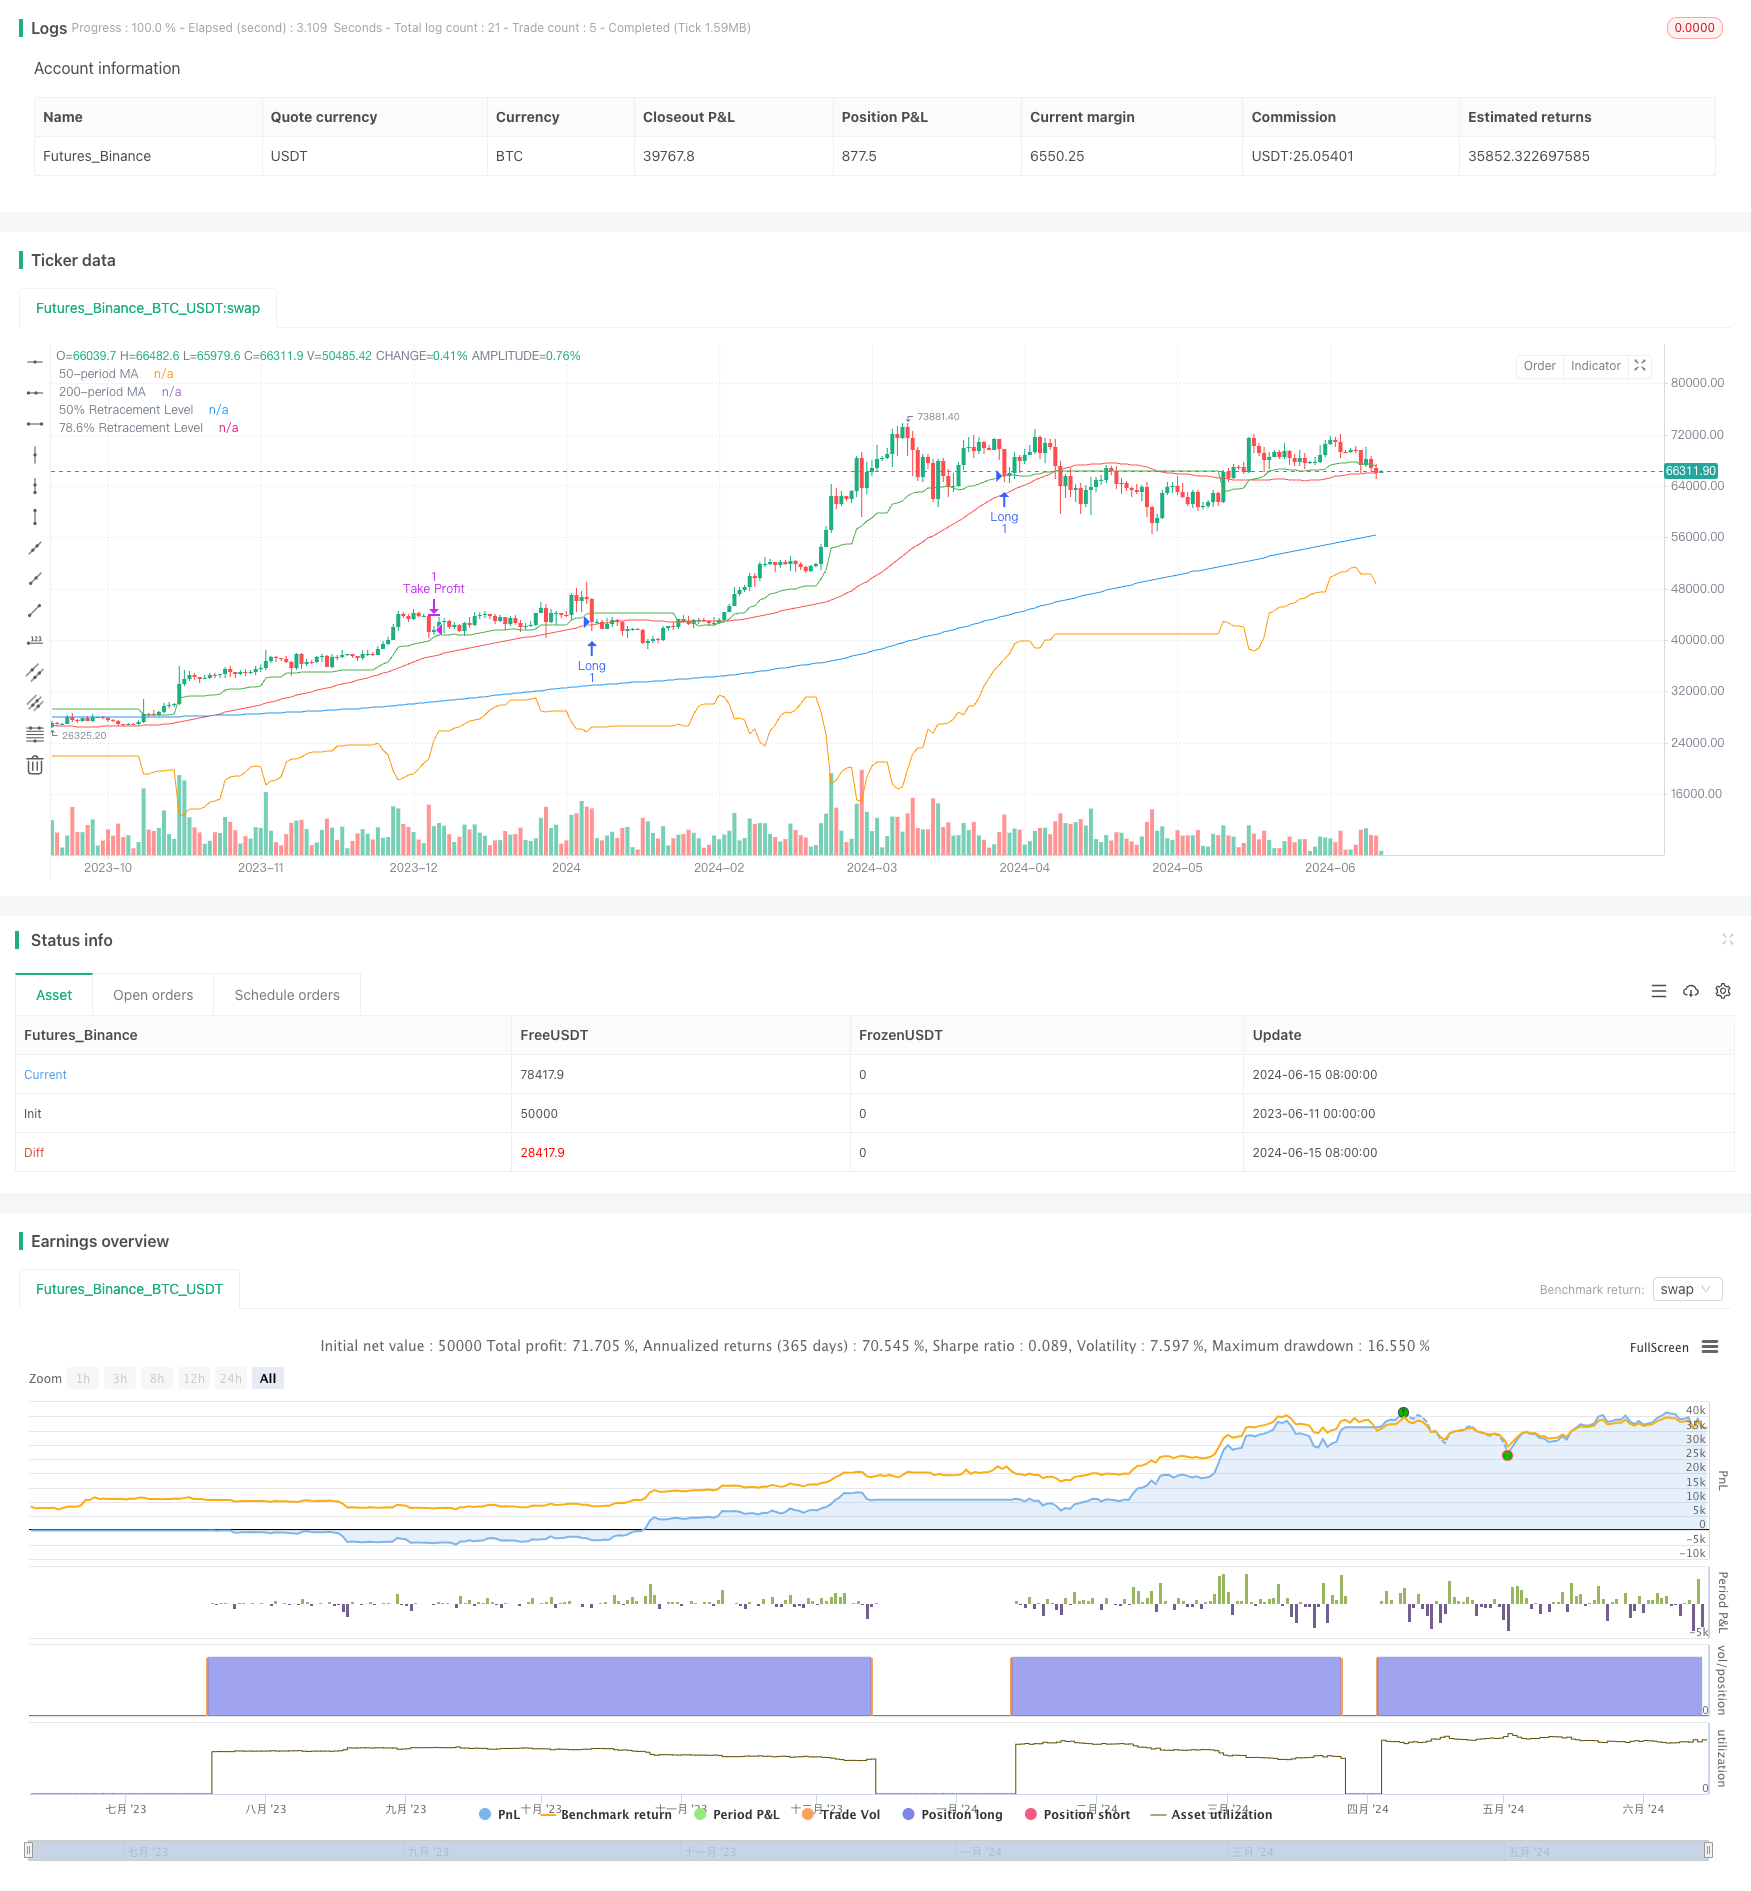
Overview
The strategy, based on Fibonacci retracements and moving averages, aims to capture retracement opportunities within market trends. It determines Fibonacci retracement levels by calculating the highest highs and lowest lows over different periods and uses moving averages to confirm the trend direction. The strategy only considers entering long positions when the price is above the long-term and medium-term moving averages and trades when the price retraces to key Fibonacci levels.
Strategy Principle
The core principle of the strategy is to utilize Fibonacci retracement levels and moving averages to identify potential entry points. First, long-term (200-period) and medium-term (50-period) simple moving averages (SMA) are calculated to determine the overall trend direction. Next, the highest highs and lowest lows for 21-period, 50-period, and 9-period are computed, and the corresponding Fibonacci retracement levels are calculated based on these prices. The 50% retracement level is determined by calculating the average of the midpoints of the retracements for these three periods. The 78.6% retracement level is calculated based on the difference between the average highest highs and the average lowest lows of these periods.
The strategy only enters a long position when all of the following conditions are met: the price is above the 200-period and 50-period moving averages, and the price is less than or equal to the 50% retracement level. Once entered, the take profit level is defined as the average entry price plus the product of the difference between the average entry price and the 78.6% retracement level and the risk/reward ratio. The stop loss level is defined as the 78.6% retracement level. The strategy exits the long position when the price reaches either the take profit or stop loss level.
Strategy Advantages
Trend Confirmation: The strategy uses long-term and medium-term moving averages to confirm the overall trend direction, helping to avoid trading in counter-trend markets.
Dynamic Retracement Levels: By calculating the highest highs and lowest lows over different periods (21-period, 50-period, and 9-period), the strategy can dynamically adjust the key Fibonacci retracement levels to adapt to different market conditions.
Risk Management: The strategy employs a predefined risk/reward ratio to determine the take profit and stop loss levels, helping to manage trading risk and optimize potential returns.
Visual Assistance: The strategy plots the moving averages and key Fibonacci retracement levels on the chart, providing clear visual references for traders to make informed trading decisions.
Strategy Risks
Delayed Entry: In fast-moving market conditions, waiting for the price to retrace to key Fibonacci levels may lead to missed optimal entry opportunities.
False Signals: In some cases, the price may briefly breach key Fibonacci levels but quickly recover, resulting in false trading signals.
Trend Reversal: The strategy performs best in trending markets. If the trend reverses, the strategy may suffer losses.
Parameter Sensitivity: The strategy’s performance heavily depends on the chosen parameters, such as the length of the moving averages and the Fibonacci retracement periods. Inappropriate parameter selection may lead to suboptimal results.
Strategy Optimization Directions
Dynamic Parameter Optimization: Implement adaptive mechanisms to dynamically adjust the strategy parameters, such as the length of the moving averages and the Fibonacci retracement periods, to adapt to changing market conditions.
Multi-Timeframe Analysis: Incorporate analysis from multiple timeframes to gain a more comprehensive market perspective and confirm trading signals.
Enhanced Risk Management: Introduce more advanced risk management techniques, such as volatility-based position sizing or trailing stop losses, to better protect capital and manage trading risks.
Indicator Combination: Combine other technical indicators, such as the Relative Strength Index or Stochastic Oscillator, with the existing moving averages and Fibonacci retracement levels to improve the accuracy and reliability of trading signals.
Summary
The “Dynamic Fibonacci Retracement Trading Strategy” is a technical analysis-based approach that aims to leverage Fibonacci retracement levels and moving averages to identify potential entry opportunities within trending markets. By dynamically calculating key retracement levels and confirming the trend direction, the strategy provides traders with a structured method to manage risk and optimize returns. While the strategy has its advantages, it also comes with certain risks and limitations. By optimizing strategy parameters, enhancing risk management, and incorporating additional technical indicators, the performance and robustness of the strategy can be further improved. Overall, the “Dynamic Fibonacci Retracement Trading Strategy” offers a promising framework for traders seeking to utilize technical analysis tools in their trading endeavors.
/*backtest
start: 2023-06-11 00:00:00
end: 2024-06-16 00:00:00
period: 1d
basePeriod: 1h
exchanges: [{"eid":"Futures_Binance","currency":"BTC_USDT"}]
*/

//@version=5
strategy("50% Retracement Strategy", overlay=true)

// Input Parameters
len_200 = input.int(200, title="200-period Moving Average")
len_50 = input.int(50, title="50-period Moving Average")
len_21 = input.int(21, title="21-candle Retracement")
len_9 = input.int(9, title="9-candle Retracement")
risk_reward_ratio = input.float(2.0, title="Risk/Reward Ratio")

// Moving Averages
ma_200 = ta.sma(close, len_200)
ma_50 = ta.sma(close, len_50)

// Fibonacci Retracement Levels
var float fib_50_level = na
var float fib_786_level = na

if (close > ma_200 and close > ma_50)
    // Calculate retracements for different periods
    retrace_21_high = ta.highest(high, len_21)
    retrace_21_low = ta.lowest(low, len_21)
    retrace_21_mid = (retrace_21_high + retrace_21_low) / 2

    retrace_50_high = ta.highest(high, len_50)
    retrace_50_low = ta.lowest(low, len_50)
    retrace_50_mid = (retrace_50_high + retrace_50_low) / 2

    retrace_9_high = ta.highest(high, len_9)
    retrace_9_low = ta.lowest(low, len_9)
    retrace_9_mid = (retrace_9_high + retrace_9_low) / 2

    // Choose the retracement to use (you can adjust this logic)
    fib_50_level := (retrace_21_mid + retrace_50_mid + retrace_9_mid) / 3
    fib_786_level := (retrace_21_high + retrace_50_high + retrace_9_high) / 3 - ((retrace_21_high + retrace_50_high + retrace_9_high - (retrace_21_low + retrace_50_low + retrace_9_low)) * 0.786)

// Strategy Entry
longCondition = close > ma_200 and close > ma_50 and close <= fib_50_level

if (longCondition)
    strategy.entry("Long", strategy.long)

// Strategy Exit
takeProfitLevel = strategy.position_avg_price + (strategy.position_avg_price - fib_786_level) * risk_reward_ratio
stopLossLevel = fib_786_level

strategy.exit("Take Profit", "Long", limit=takeProfitLevel, stop=stopLossLevel)

// Plotting
plot(ma_200, color=color.blue, title="200-period MA")
plot(ma_50, color=color.red, title="50-period MA")
plot(fib_50_level, color=color.green, title="50% Retracement Level")
plot(fib_786_level, color=color.orange, title="78.6% Retracement Level")