Overview
The Multi-Timeframe Hull Moving Average Crossover Strategy is a quantitative trading strategy based on the Hull Moving Average (HMA) indicator. This strategy utilizes HMA indicators from different timeframes to identify market trends and generate trading signals. The core of the strategy is to determine entry and exit points by observing the crossovers between short-term and medium-term HMAs, while using a long-term HMA as a reference for the overall trend. This multi-timeframe approach effectively filters out noise and improves the accuracy of trading decisions.
Strategy Principles
The core principle of this strategy is to leverage the fast response characteristics of the Hull Moving Average (HMA) and the advantages of multi-timeframe analysis. The specific implementation is as follows:
Calculate three HMAs with different periods:
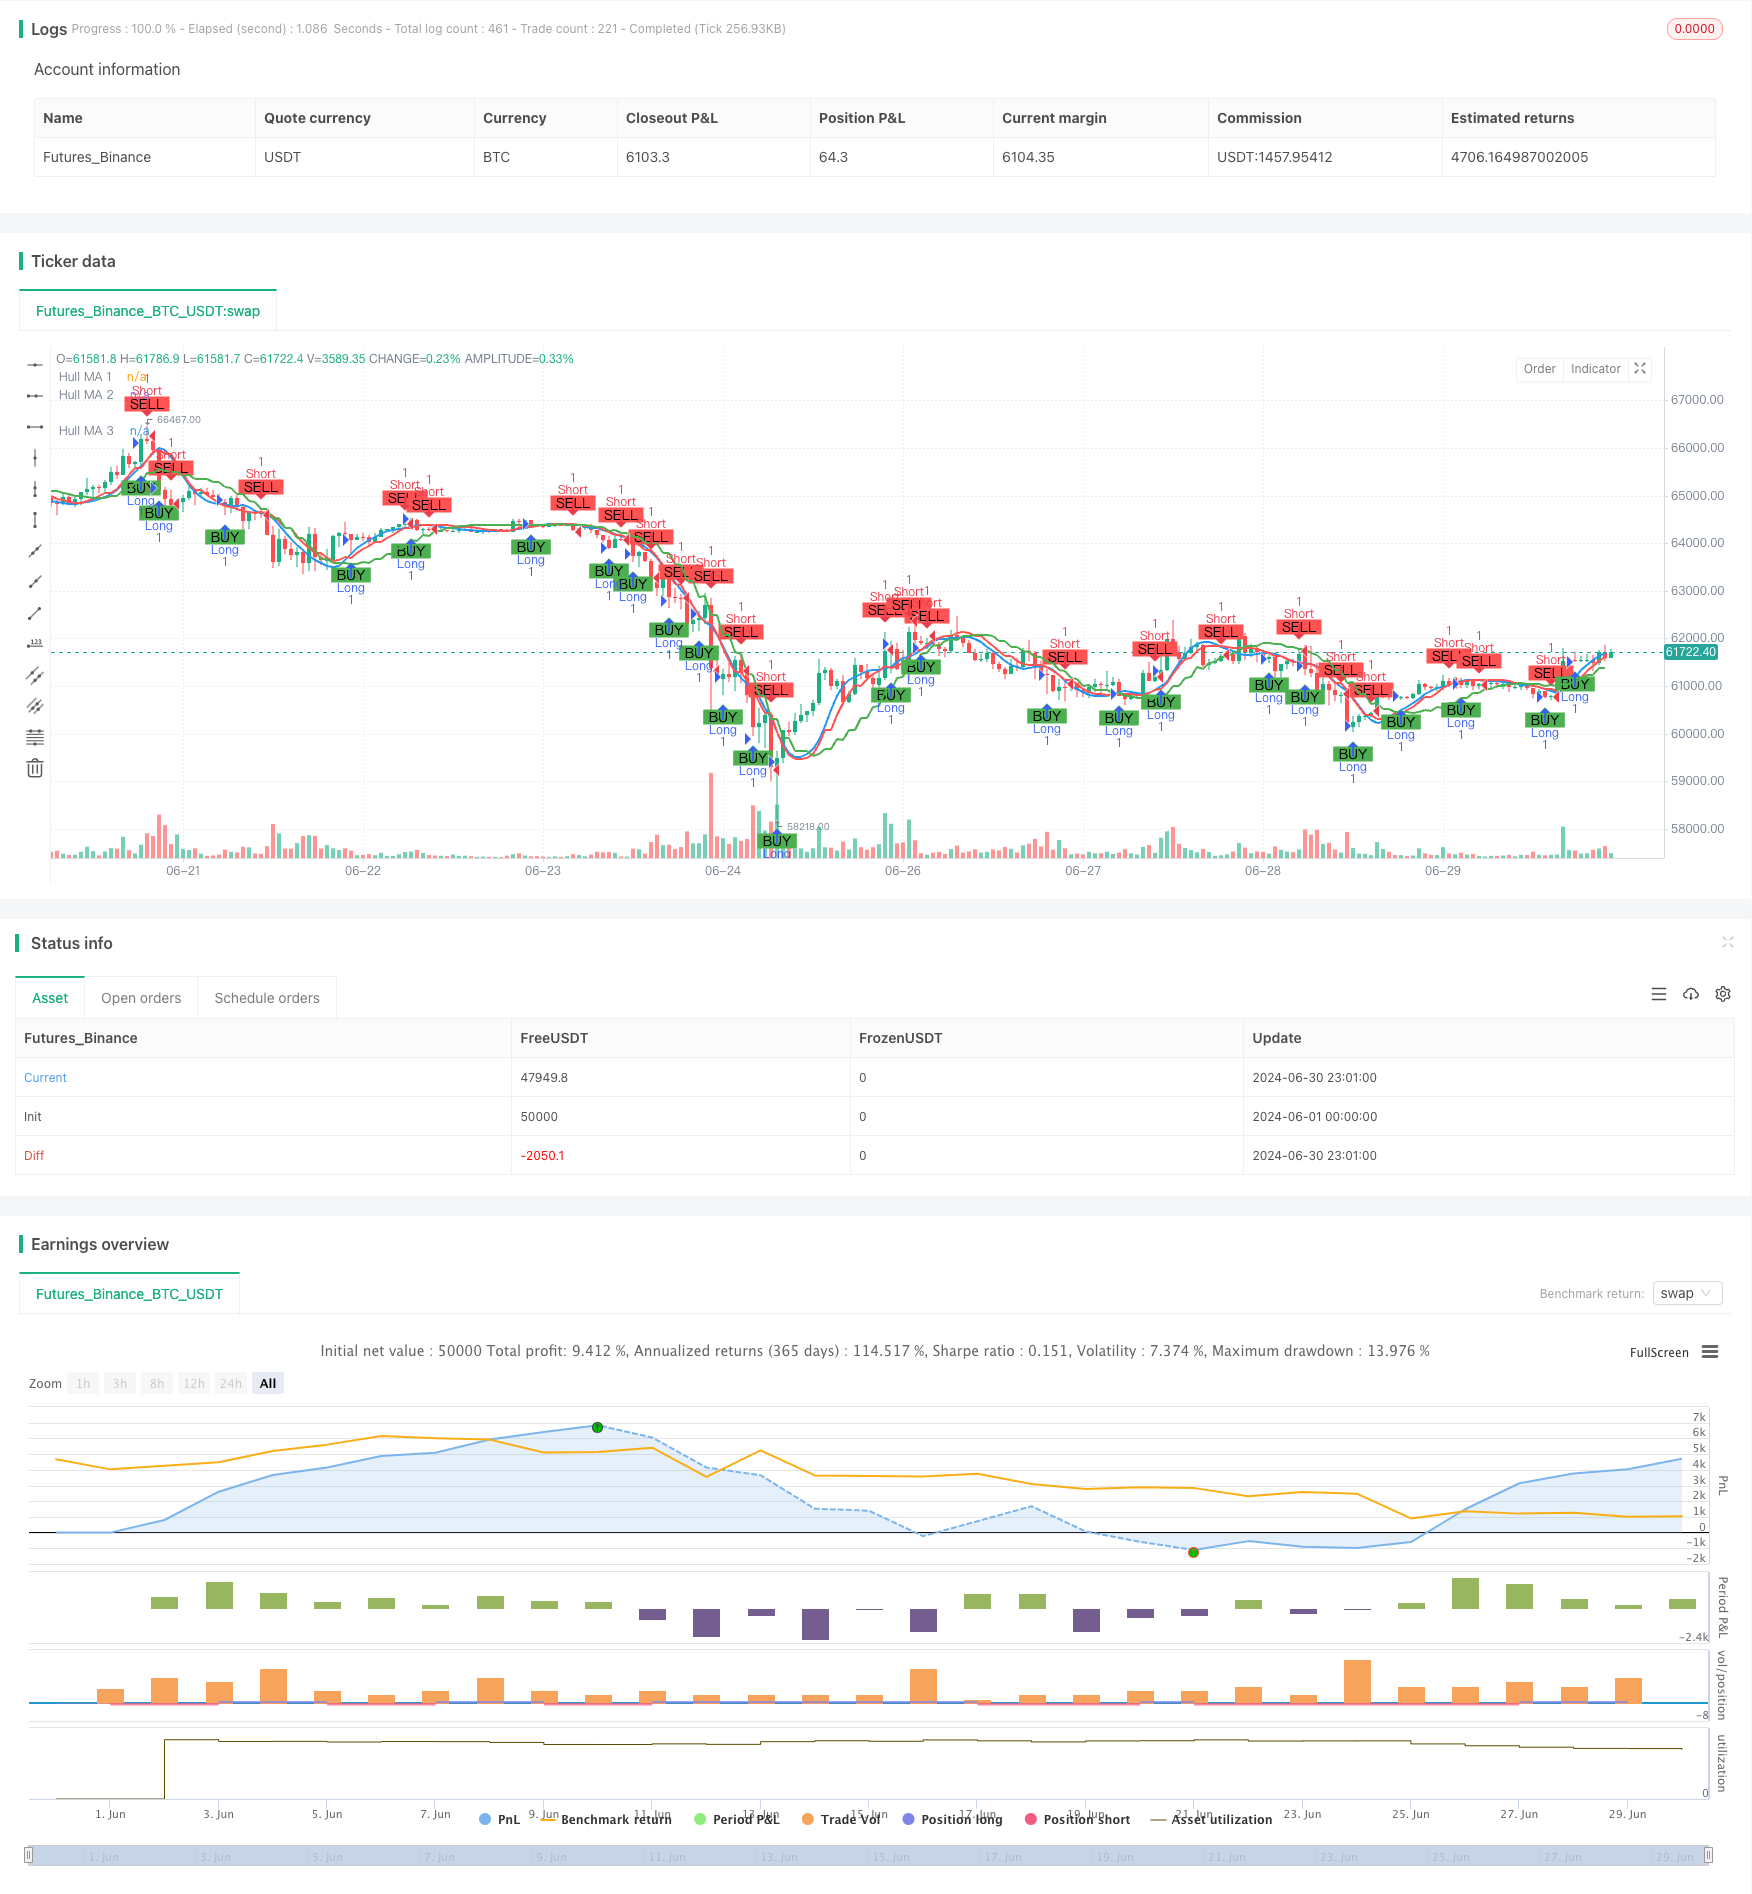
- HMA 1: 25-minute timeframe
- HMA 2: 75-minute timeframe
- HMA 3: 125-minute timeframe
Trading signal generation:
- Long signal: When HMA 1 crosses above HMA 2
- Short signal: When HMA 1 crosses below HMA 2
HMA 3 serves as a long-term trend indicator, although it doesn’t directly participate in signal generation, it can be used to judge the overall market trend.
The strategy uses a fixed percentage of account equity (10%) as the fund size for each trade.
Buy and sell signals are marked on the chart using the PlotShape function, enhancing visualization.
Alert conditions for long and short positions are set up, facilitating real-time monitoring of market opportunities.
Strategy Advantages
Reduced lag: The Hull Moving Average itself has lower lag and responds faster to price changes compared to traditional moving averages.
Multi-timeframe analysis: By combining HMAs from different timeframes, the strategy can capture short-term, medium-term, and long-term trends simultaneously, improving trading accuracy and stability.
Noise filtering: Using HMAs with longer periods (75 and 125 minutes) can effectively filter out short-term market noise, reducing false signals.
Flexibility: The strategy allows users to customize the length and data source of each HMA, adapting to different market environments and trading styles.
Risk management: Using a fixed percentage of account equity for trading helps control risk exposure.
Visualization: Displaying buy and sell signals directly on the chart helps traders better understand and verify the strategy logic.
Real-time alerts: Trading signal alerts are set up, enabling traders to seize market opportunities in a timely manner.
Strategy Risks
Trend reversal risk: In strong trending markets, the strategy may generate frequent signals, leading to overtrading and unnecessary costs.
Sideways market risk: In markets without clear trends, HMA crossovers may produce numerous false signals, affecting strategy performance.
Parameter sensitivity: Strategy performance highly depends on the chosen HMA lengths and timeframes; different parameter combinations may lead to drastically different results.
Slippage and trading costs: Frequent trading may result in higher slippage and trading costs, especially in markets with lower liquidity.
Technical dependency: The strategy relies entirely on technical indicators, ignoring fundamental factors, which may perform poorly when significant news or events occur.
Overfitting risk: Excessive optimization of parameters on historical data may lead to poor performance in live trading.
Strategy Optimization Directions
Introduce trend filter: Consider using HMA 3 as a trend filter, only opening positions in the direction of the long-term trend to reduce counter-trend trading.
Dynamic parameter adjustment: Implement an adaptive mechanism to dynamically adjust HMA lengths and timeframes based on market volatility, adapting to different market environments.
Add stop-loss and take-profit mechanisms: Introduce stop-loss and take-profit rules based on ATR or fixed percentages to better control risk and lock in profits.
Optimize position management: Implement more sophisticated position management strategies, such as dynamically adjusting position sizes based on volatility or account profit/loss.
Integrate other technical indicators: Combine other technical indicators such as RSI, MACD to build more comprehensive entry and exit conditions.
Backtesting and optimization: Conduct extensive backtesting under different market conditions and timeframes to find the optimal parameter combinations.
Consider fundamental factors: Introduce considerations for important economic data releases or company events, adjusting strategy behavior during specific periods.
Implement partial position trading: Allow the strategy to execute partial position trades based on signal strength, rather than always entering or exiting with full positions.
Conclusion
The Multi-Timeframe Hull Moving Average Crossover Strategy is a quantitative trading strategy that combines the fast response characteristics of the Hull Moving Average with the advantages of multi-timeframe analysis. By observing the crossover relationships between HMAs of different timeframes, the strategy can effectively identify market trends and generate trading signals. Its advantages lie in reducing the lag of traditional moving averages while improving signal reliability through multi-timeframe analysis. However, the strategy also faces risks such as trend reversals and parameter sensitivity.
To further improve the robustness and profitability of the strategy, considerations can be made to introduce trend filters, dynamic parameter adjustments, and optimize position management. Additionally, combining other technical indicators and fundamental factors can build a more comprehensive trading system that adapts to different market environments.
Overall, this strategy provides traders with a promising framework that, through continuous optimization and refinement, has the potential to become a powerful quantitative trading tool. However, in practical applications, traders still need to carefully assess market risks and make appropriate adjustments based on individual risk tolerance and trading objectives.
/*backtest
start: 2024-06-01 00:00:00
end: 2024-06-30 23:59:59
period: 1h
basePeriod: 15m
exchanges: [{"eid":"Futures_Binance","currency":"BTC_USDT"}]
*/

//@version=5
strategy(title='Hull v2 Strategy', shorttitle='V2 HMA', overlay=true)

// Hull MA 1
length_1 = input.int(20, minval=1, title="Length 1")
src_1 = input(close, title='Source 1')
timeframe_1 = input.timeframe('25')
hullma_1 = request.security(syminfo.tickerid, timeframe_1, ta.wma(2 * ta.wma(src_1, length_1 / 2) - ta.wma(src_1, length_1), math.round(math.sqrt(length_1))))
plot(hullma_1, title='Hull MA 1', color=color.blue, linewidth=2)

// Hull MA 2
length_2 = input.int(20, minval=1, title="Length 2")
src_2 = input(close, title='Source 2')
timeframe_2 = input.timeframe('75')
hullma_2 = request.security(syminfo.tickerid, timeframe_2, ta.wma(2 * ta.wma(src_2, length_2 / 2) - ta.wma(src_2, length_2), math.round(math.sqrt(length_2))))
plot(hullma_2, title='Hull MA 2', color=color.red, linewidth=2)

// Hull MA 3
length_3 = input.int(20, minval=1, title="Length 3")
src_3 = input(close, title='Source 3')
timeframe_3 = input.timeframe('125')
hullma_3 = request.security(syminfo.tickerid, timeframe_3, ta.wma(2 * ta.wma(src_3, length_3 / 2) - ta.wma(src_3, length_3), math.round(math.sqrt(length_3))))
plot(hullma_3, title='Hull MA 3', color=color.green, linewidth=2)

// Cross Strategy
longCondition = ta.crossover(hullma_1, hullma_2)
shortCondition = ta.crossunder(hullma_1, hullma_2)
// Entry and Exit
if (longCondition)
    strategy.entry("Long", strategy.long)
if (shortCondition)
    strategy.entry("Short", strategy.short)

// Plot Buy/Sell Signals
plotshape(series=longCondition, location=location.belowbar, color=color.green, style=shape.labelup, title='Buy Signal', text='BUY')
plotshape(series=shortCondition, location=location.abovebar, color=color.red, style=shape.labeldown, title='Sell Signal', text='SELL')

// Alerts
alertcondition(longCondition, title='Long Alert', message='Long Condition Met')
alertcondition(shortCondition, title='Short Alert', message='Short Condition Met')