Overview
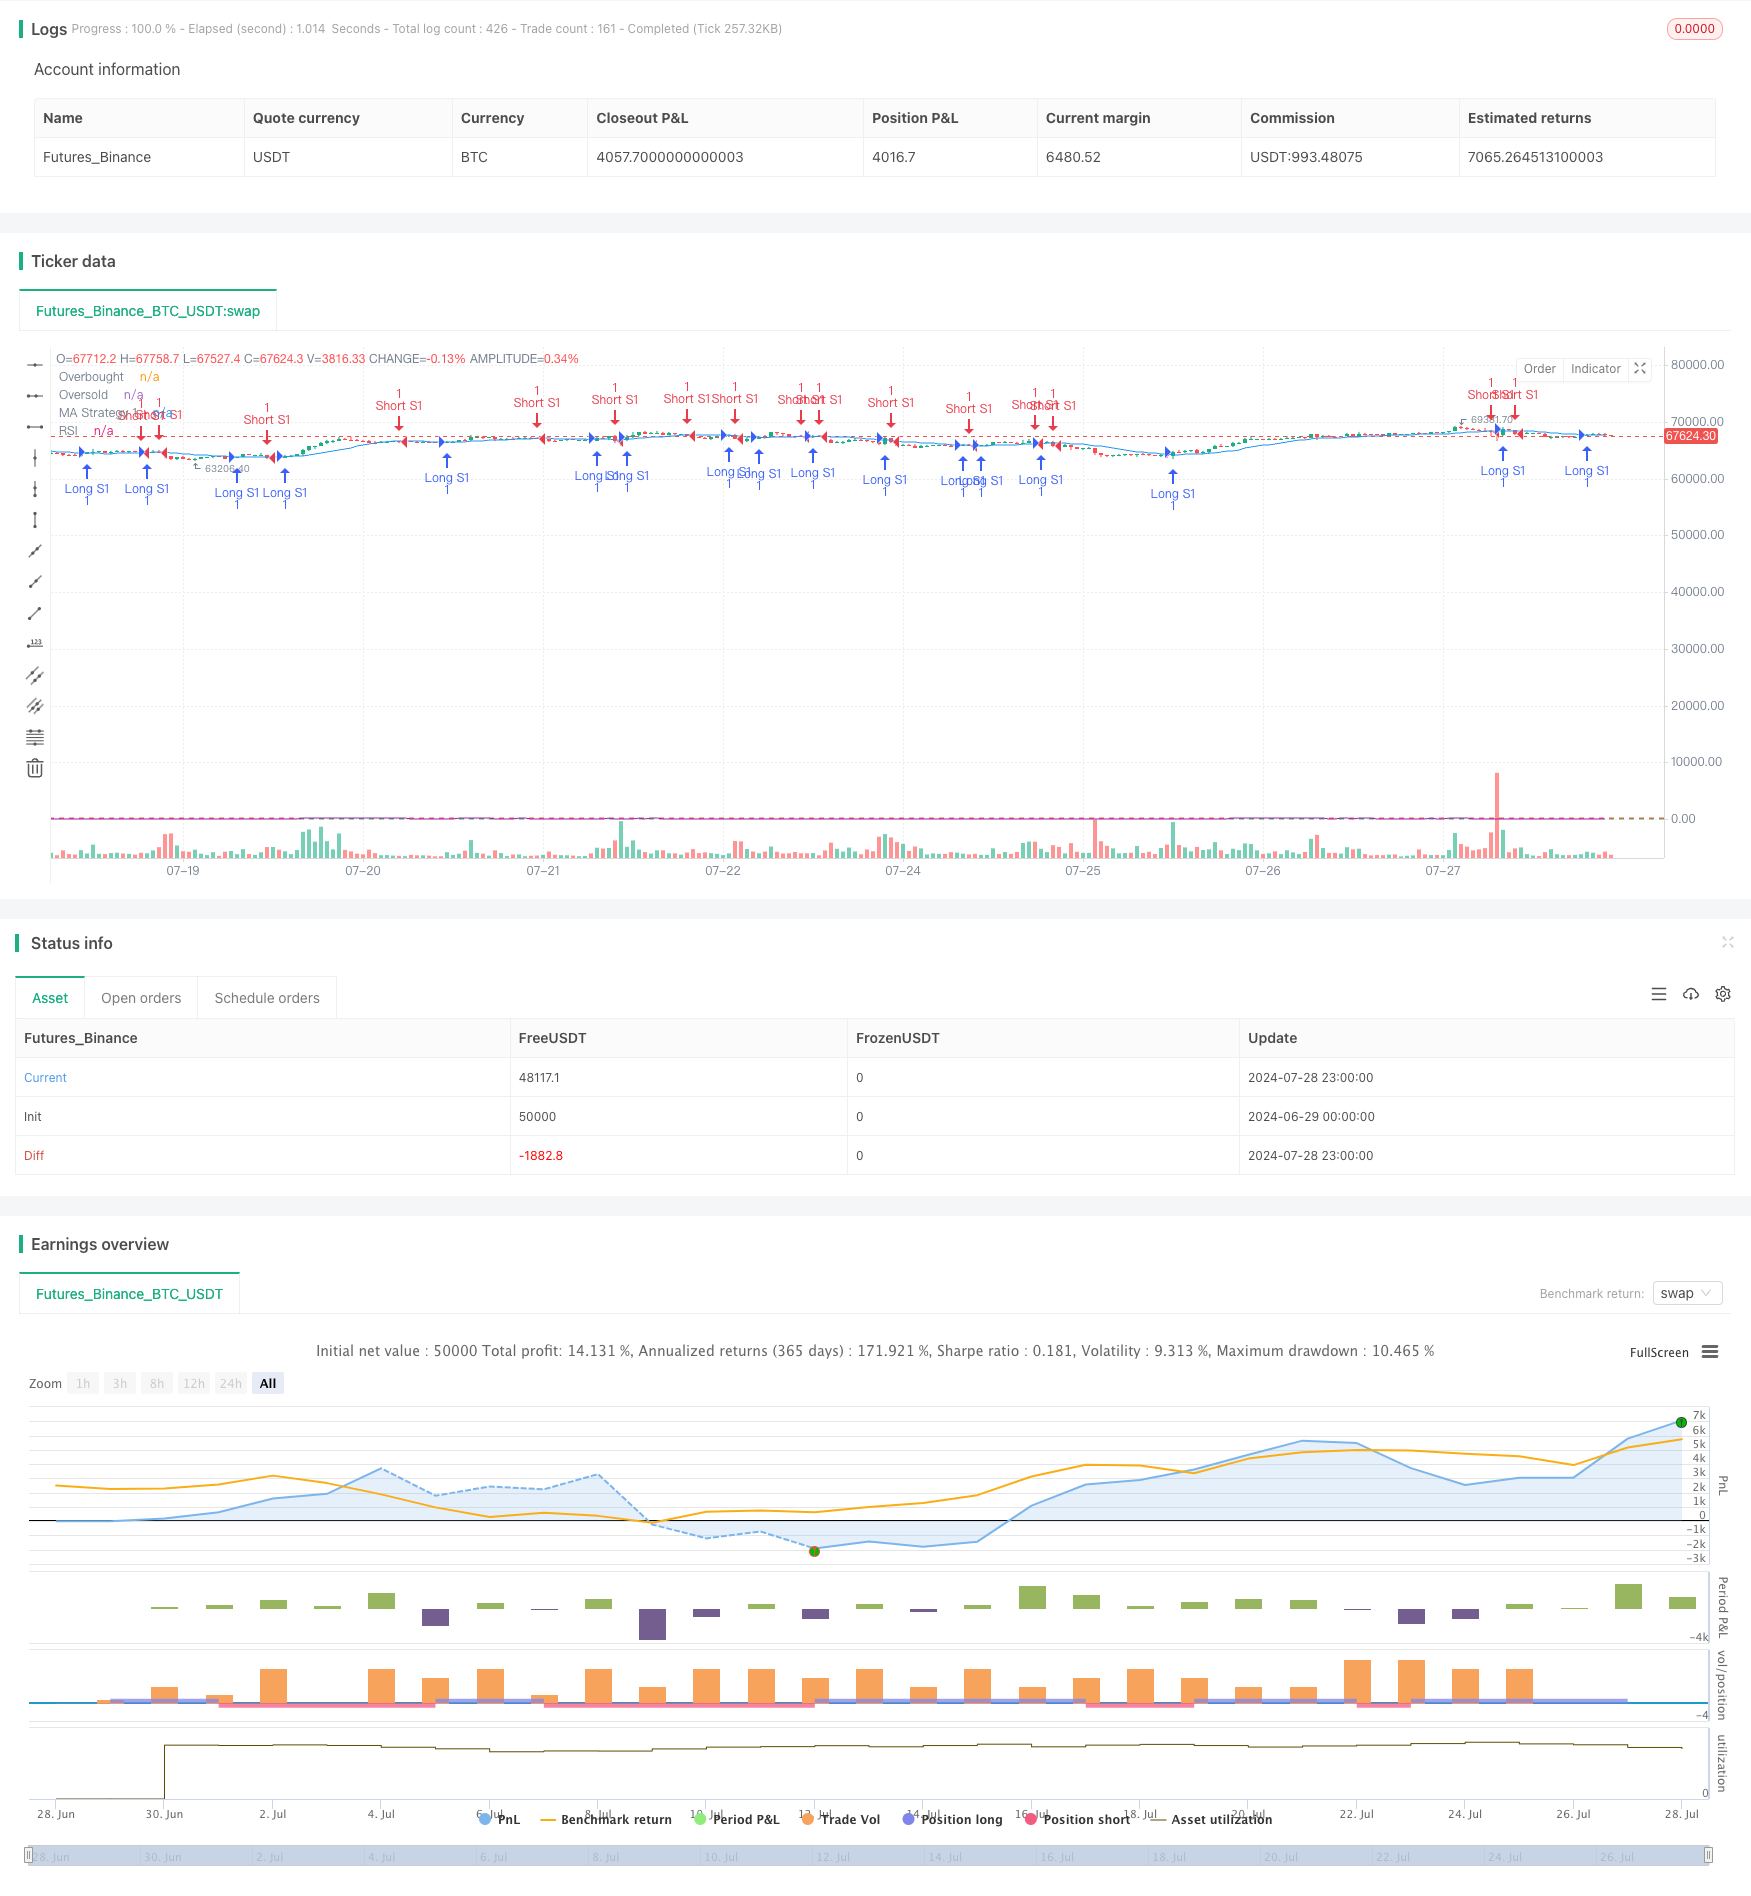
The Dual Dynamic Indicator Optimization Strategy is a quantitative trading system that combines moving averages and the Relative Strength Index (RSI). This strategy allows traders to flexibly enable or disable two independent sub-strategies to adapt to different market environments. The first sub-strategy is based on moving average crossovers, while the second utilizes RSI overbought and oversold levels to generate trading signals. This multi-strategy approach aims to improve trading accuracy and adaptability while reducing risk through independent control switches.
Strategy Principles
Moving Average Crossover Strategy (Strategy 1):
- Uses user-defined moving average length, data source, and type (Simple Moving Average SMA or Exponential Moving Average EMA).
- Generates a long signal when the price crosses above the moving average.
- Generates a short signal when the price crosses below the moving average.
RSI Strategy (Strategy 2):
- Utilizes user-defined RSI parameters, including RSI length, overbought, and oversold levels.
- Generates a long signal when RSI crosses above the oversold level.
- Generates a short signal when RSI crosses below the overbought level.
Strategy Control:
- Each strategy has an independent enable/disable switch, allowing users to selectively activate or deactivate either strategy.
- Trading logic and signal generation are only executed when the corresponding strategy is enabled.
Strategy Advantages
Flexibility: Allows users to enable or disable individual strategies based on market conditions and personal preferences, providing great adaptability.
Multi-dimensional Analysis: Combines trend-following (moving averages) and momentum (RSI) indicators, offering a more comprehensive market perspective.
Risk Management: Through independent control of each strategy, users can better manage overall risk exposure.
Customizability: A large number of user-adjustable parameters allow the strategy to be optimized for different markets and asset types.
Visual Feedback: The strategy plots key indicators such as moving averages, RSI, and overbought/oversold levels on the chart for real-time analysis.
Strategy Risks
Indicator Lag: Both moving averages and RSI are lagging indicators, which may produce delayed signals in rapidly changing markets.
False Signals in Ranging Markets: In sideways markets, moving average crossovers may generate excessive false signals.
RSI Extreme Value Risk: In strong trends, assets may remain in overbought or oversold conditions for extended periods, leading to premature reversal signals.
Parameter Sensitivity: Strategy performance is highly dependent on chosen parameters; improper parameter settings may lead to suboptimal results.
Lack of Stop-Loss Mechanism: The current strategy lacks explicit stop-loss logic, potentially leading to excessive losses in adverse market conditions.
Strategy Optimization Directions
Introduce Adaptive Parameters: Develop mechanisms to automatically adjust moving average lengths and RSI thresholds based on market volatility.
Add Trend Filters: Implement trend confirmation logic before executing RSI signals to reduce counter-trend trades.
Implement Dynamic Position Sizing: Adjust trade size based on market volatility and signal strength to optimize risk-reward ratios.
Integrate Multi-Timeframe Analysis: Validate signals across different timeframes to improve trading accuracy.
Add Stop-Loss and Take-Profit Logic: Implement intelligent stop-loss and take-profit mechanisms to protect profits and limit potential losses.
Incorporate Trading Costs: Include trading costs in signal generation logic to filter out potentially low-profit trades.
Develop Strategy Synergy Mechanism: Design a method to intelligently coordinate signals from both strategies rather than simply running them in parallel.
Conclusion
The Dual Dynamic Indicator Optimization Strategy demonstrates a flexible, customizable approach to quantitative trading by combining moving average crossovers and RSI indicators to capture market opportunities. Its modular design allows traders to selectively enable strategies based on market conditions, offering significant adaptability advantages. However, the strategy also faces challenges such as inherent indicator lag and parameter sensitivity. By introducing adaptive parameters, advanced risk management techniques, and multi-dimensional market analysis, the strategy has the potential to further enhance its performance and robustness. Future optimizations should focus on improving signal quality, enhancing risk control, and developing more intelligent strategy coordination mechanisms to maintain competitiveness across various market environments.
/*backtest
start: 2024-06-29 00:00:00
end: 2024-07-29 00:00:00
period: 1h
basePeriod: 15m
exchanges: [{"eid":"Futures_Binance","currency":"BTC_USDT"}]
*/

// This Pine Script™ code is subject to the terms of the Mozilla Public License 2.0 at https://mozilla.org/MPL/2.0/
// © PIONEER_TRADER

//@version=5
strategy("Multiple Strategies with On/Off Buttons", overlay=true)

// Define on/off buttons for each strategy
enableStrategy1 = input.bool(true, title="Enable Strategy 1", group="Strategy 1 Settings")
enableStrategy2 = input.bool(false, title="Enable Strategy 2", group="Strategy 2 Settings")

// Define settings for Strategy 1
maLength1 = input.int(14, title="MA Length", group="Strategy 1 Settings")
maSource1 = input.source(close, title="MA Source", group="Strategy 1 Settings")
maType1 = input.string("SMA", title="MA Type", options=["SMA", "EMA"], group="Strategy 1 Settings")

// Define settings for Strategy 2
rsiLength = input.int(14, title="RSI Length", group="Strategy 2 Settings")
rsiOverbought = input.int(70, title="RSI Overbought", group="Strategy 2 Settings")
rsiOversold = input.int(30, title="RSI Oversold", group="Strategy 2 Settings")

// Logic for Strategy 1 (Moving Average Crossover)
ma1 = if maType1 == "SMA"
    ta.sma(maSource1, maLength1)
else
    ta.ema(maSource1, maLength1)

longCondition1 = ta.crossover(close, ma1)
shortCondition1 = ta.crossunder(close, ma1)

if (enableStrategy1)
    if (longCondition1)
        strategy.entry("Long S1", strategy.long, comment="Long Entry S1")
    if (shortCondition1)
        strategy.entry("Short S1", strategy.short, comment="Short Entry S1")

plot(ma1, title="MA Strategy 1", color=color.blue)

// Logic for Strategy 2 (RSI)
rsi = ta.rsi(close, rsiLength)
longCondition2 = ta.crossover(rsi, rsiOversold)
shortCondition2 = ta.crossunder(rsi, rsiOverbought)

if (enableStrategy2)
    if (longCondition2)
        strategy.entry("Long S2", strategy.long, comment="Long Entry S2")
    if (shortCondition2)
        strategy.entry("Short S2", strategy.short, comment="Short Entry S2")

hline(rsiOverbought, "Overbought", color=color.red)
hline(rsiOversold, "Oversold", color=color.green)
plot(rsi, title="RSI", color=color.purple)