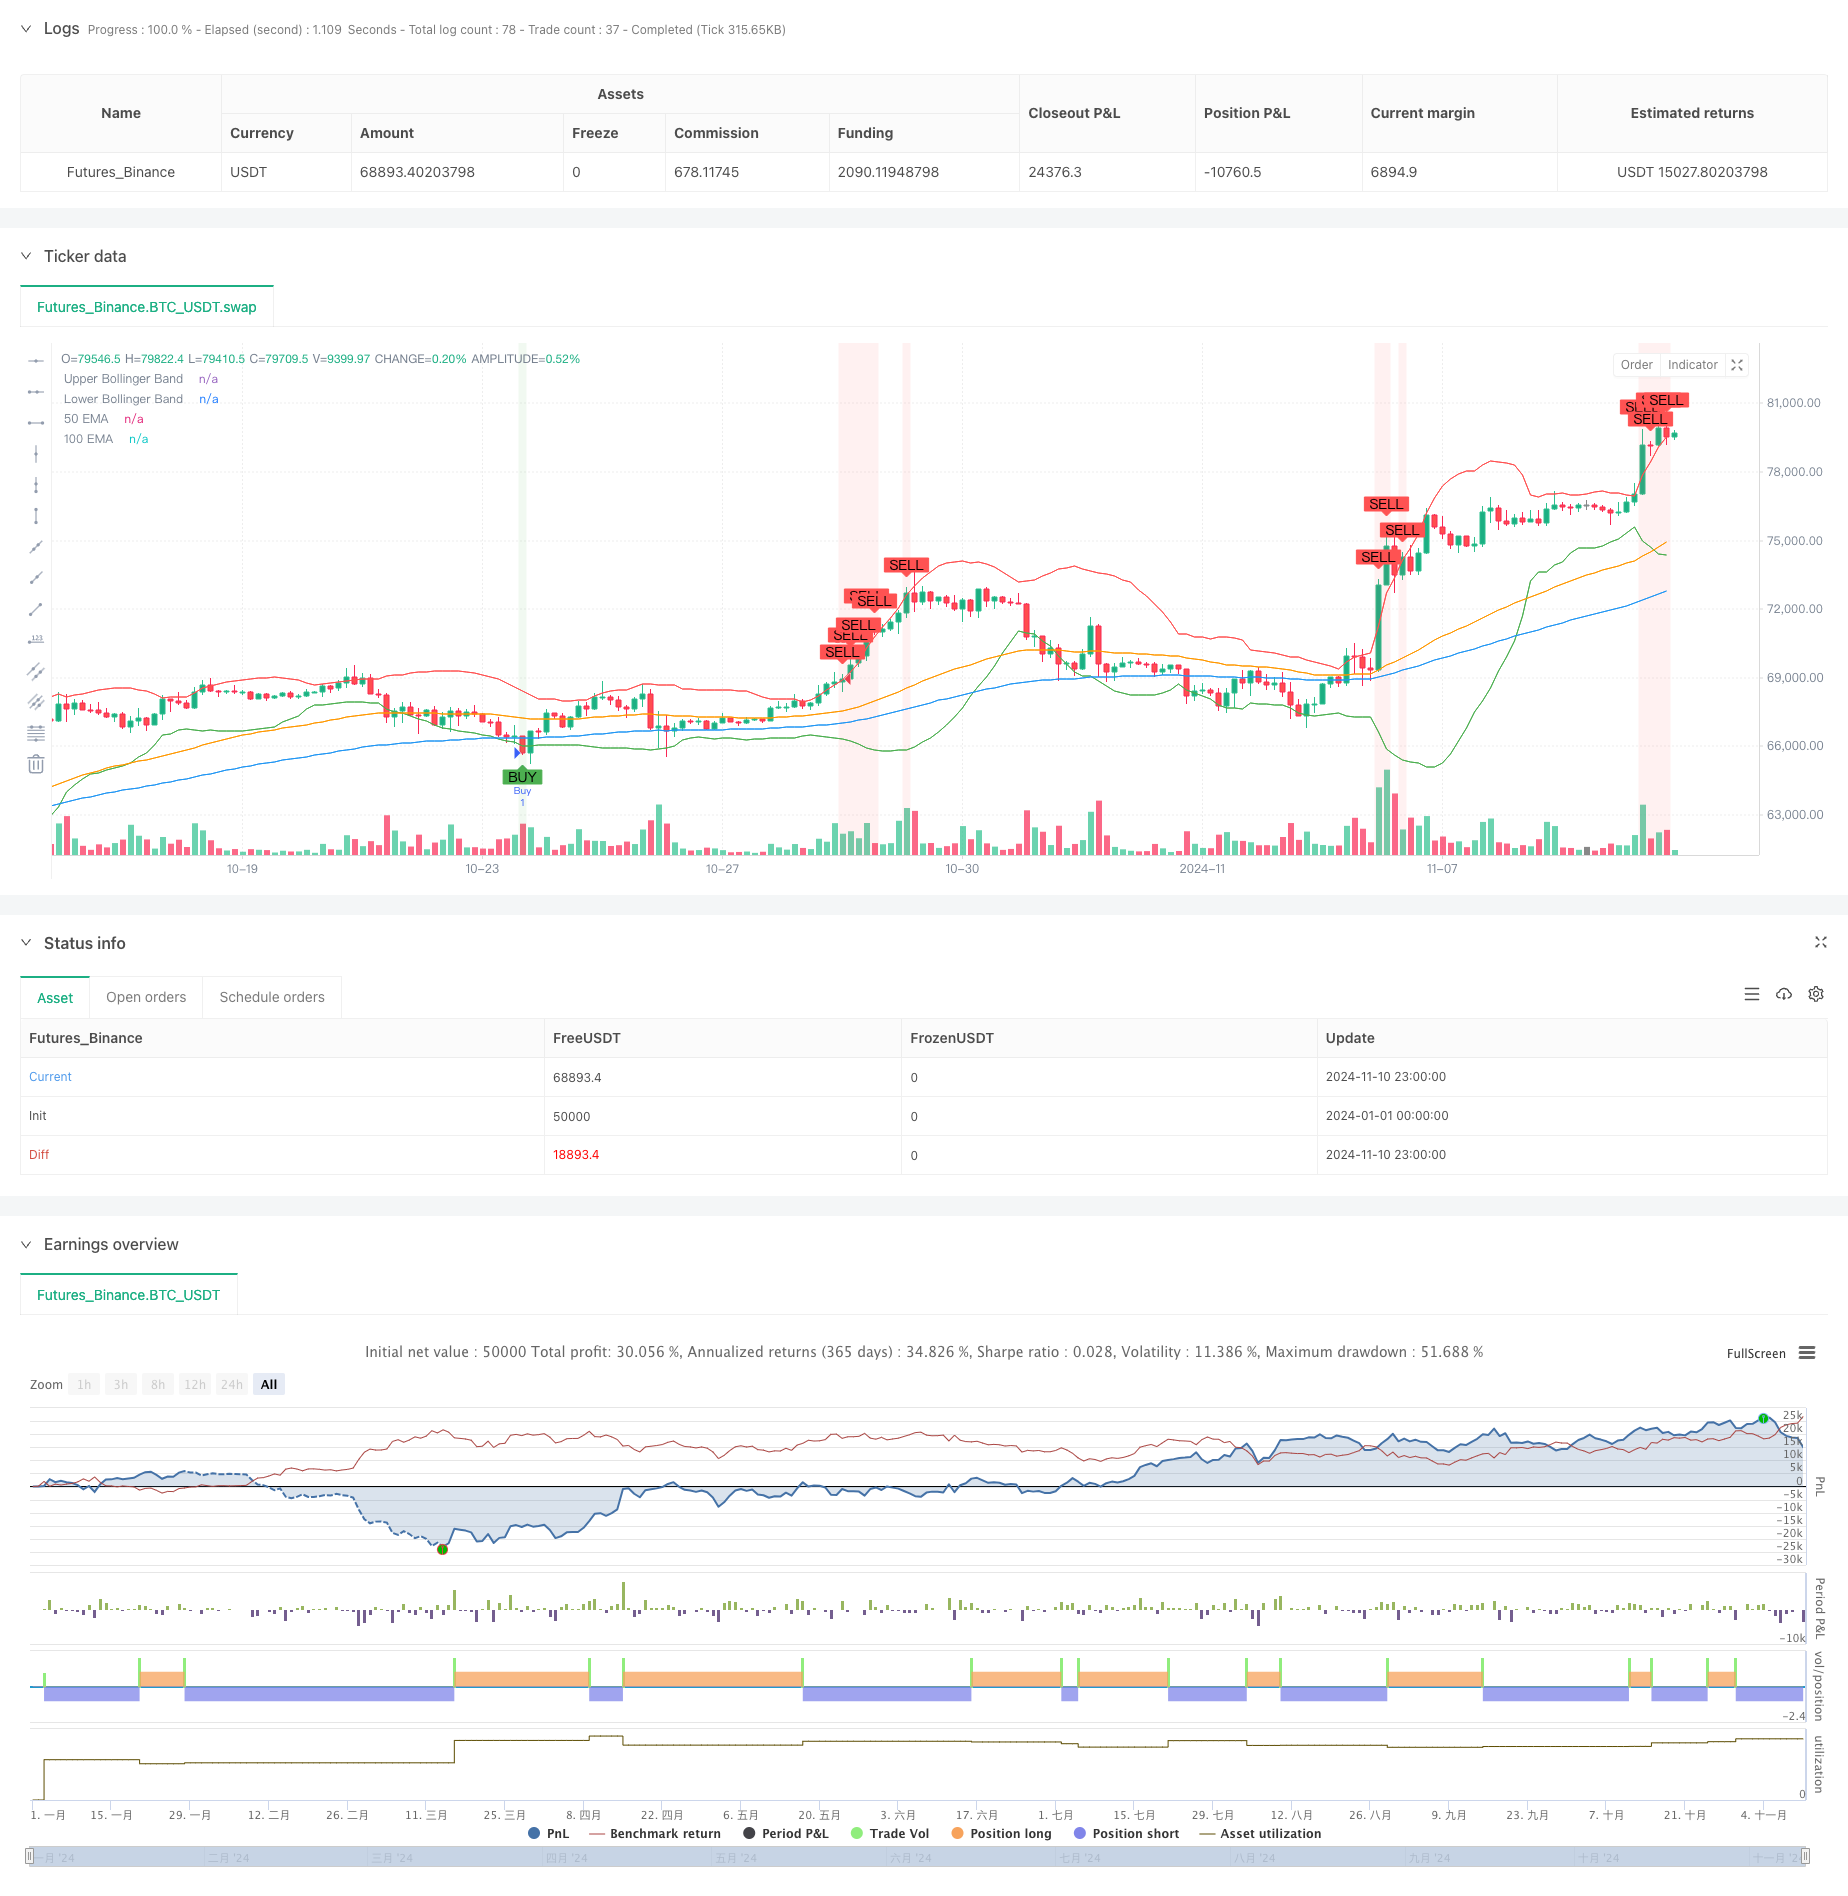
Overview
This strategy is a hybrid system combining mean reversion and trend following approaches, utilizing RSI, Bollinger Bands, and multiple EMA indicators to capture market overbought and oversold opportunities. The strategy enhances traditional technical analysis by incorporating trend confirmation and range-bound market identification, significantly improving accuracy.
Strategy Principles
The strategy employs a triple verification mechanism for trade signals. Initially, it identifies overbought/oversold conditions using RSI (below 30 or above 70). Secondly, it confirms signals using Bollinger Bands breakouts. Finally, it validates market trends using 100⁄50-day EMA relative positions and volatility. Trades are only executed when all three conditions align. The strategy also incorporates EMA volatility assessment for range-bound market identification.
Strategy Advantages
- Multiple indicator cross-validation reduces false signals
- Combines oversold/overbought and trend following for enhanced adaptability
- Incorporates EMA volatility for effective range-bound market identification
- Clear visualization for strategy monitoring and optimization
- Highly adjustable parameters for different market conditions
Strategy Risks
- Multiple indicators may lead to delayed signals
- Potential missed opportunities in highly volatile markets
- Risk of overfitting through parameter optimization
- EMA trend identification may generate confusing signals in sideways markets Recommend backtesting across different timeframes and implementing appropriate stop-loss mechanisms.
Optimization Directions
- Incorporate volume indicators for signal confirmation
- Implement adaptive parameter adjustment mechanisms
- Add profit/loss management module
- Develop trend strength scoring system
- Optimize EMA volatility calculation method
- Add market volatility filters
Summary
The strategy achieves a balance between robustness and flexibility through the synergy of multiple technical indicators. With clear logic and concise implementation, it demonstrates practical value. Through proper parameter optimization and risk management, the strategy shows potential for consistent performance across various market conditions.
/*backtest
start: 2024-01-01 00:00:00
end: 2024-11-11 00:00:00
period: 3h
basePeriod: 3h
exchanges: [{"eid":"Futures_Binance","currency":"BTC_USDT"}]
*/

//@version=5
strategy("BTC Dominance Analysis Strategy (Improved)", overlay=true)

// Input Parameters
rsi_period = input(14, title="RSI Period")
bb_period = input(20, title="Bollinger Band Period")
bb_std_dev = input(2.0, title="Bollinger Std Dev")
ema_period = input(100, title="100 EMA Period")
ema_30_period = input(30, title="30 EMA Period")
ema_50_period = input(50, title="50 EMA Period")

// RSI Calculation
rsi_value = ta.rsi(close, rsi_period)

// Bollinger Bands Calculation
basis = ta.sma(close, bb_period)
dev = bb_std_dev * ta.stdev(close, bb_period)
upper_bb = basis + dev
lower_bb = basis - dev

// EMA Calculation
ema_100 = ta.ema(close, ema_period)
ema_30 = ta.ema(close, ema_30_period)
ema_50 = ta.ema(close, ema_50_period)

// Determine EMA trends
range_bound_ema = math.abs(ema_100 - ta.sma(ema_100, 10)) < ta.stdev(ema_100, 10)
uptrend_ema = ema_100 > ema_50
downtrend_ema = ema_100 < ema_50

// Long Condition: All 3 conditions must be met
// 1. RSI < 30
// 2. BTC Dominance < lower Bollinger Band
// 3. 100 EMA must be range-bound or in an uptrend (but NOT in a downtrend)
long_condition = (rsi_value < 30) and (close < lower_bb) and (range_bound_ema or uptrend_ema)

// Short Condition: All 3 conditions must be met
// 1. RSI > 70
// 2. BTC Dominance > upper Bollinger Band
// 3. 100 EMA must be range-bound or in a downtrend (but NOT in an uptrend)
short_condition = (rsi_value > 70) and (close > upper_bb) and (range_bound_ema or downtrend_ema)

// Plot Buy and Sell Signals for Debugging
plotshape(long_condition, title="Buy Signal", location=location.belowbar, color=color.green, style=shape.labelup, text="BUY")
plotshape(short_condition, title="Sell Signal", location=location.abovebar, color=color.red, style=shape.labeldown, text="SELL")

// Execute Buy Trade
if (long_condition)
    strategy.entry("Buy", strategy.long)

// Execute Sell Trade
if (short_condition)
    strategy.entry("Sell", strategy.short)

// Plot Bollinger Bands and EMA
plot(upper_bb, color=color.red, title="Upper Bollinger Band")
plot(lower_bb, color=color.green, title="Lower Bollinger Band")
plot(ema_100, color=color.blue, title="100 EMA")
plot(ema_50, color=color.orange, title="50 EMA")
// plot(rsi_value, "RSI", color=color.purple)

// Display background color for Buy and Sell signals
bgcolor(long_condition ? color.new(color.green, 90) : na, title="Buy Background")
bgcolor(short_condition ? color.new(color.red, 90) : na, title="Sell Background")