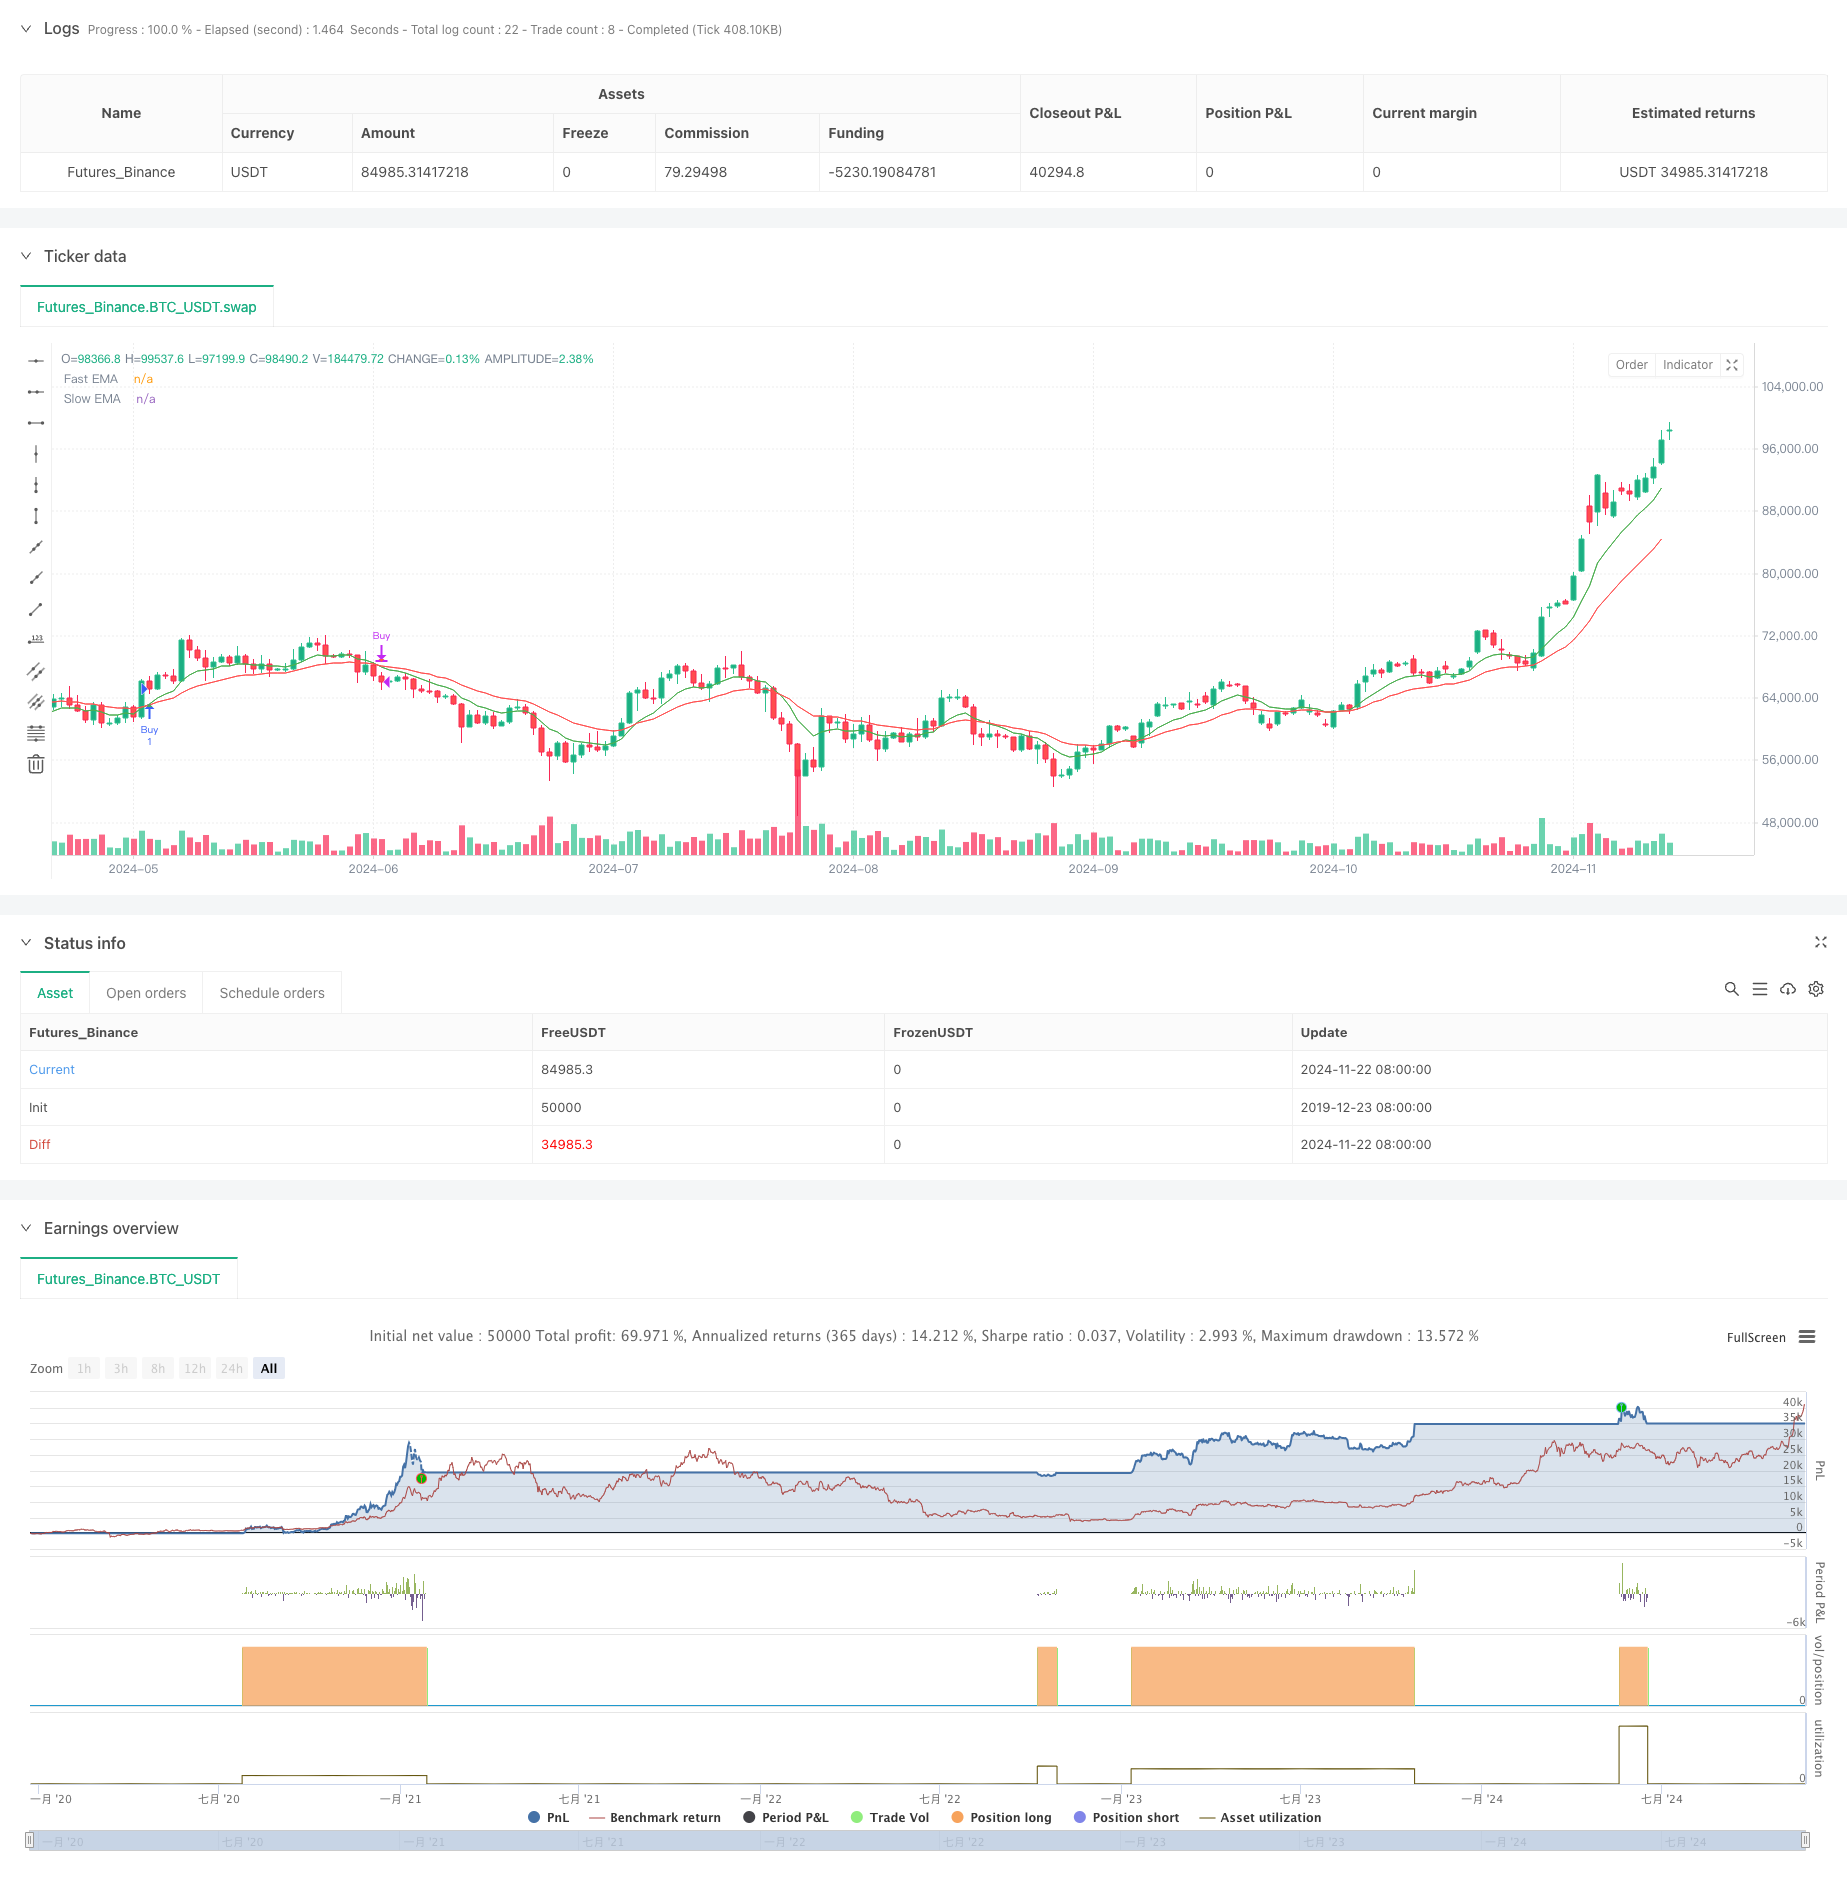
Overview
This strategy is a comprehensive trading system that combines moving averages, relative strength index, and trend strength indicators. Through the coordination of multiple technical indicators, it achieves precise capture of market trends and effective risk control. The system adopts a dynamic stop-loss and take-profit mechanism, ensuring a favorable risk-reward ratio while adapting to different market conditions through flexible parameter adjustments.
Strategy Principles
The strategy is primarily based on three core indicators: fast and slow Exponential Moving Averages (EMA), Relative Strength Index (RSI), and Average Directional Index (ADX). When the fast EMA crosses above the slow EMA, the system checks if the RSI is in non-overbought territory (below 60) while confirming sufficient trend strength with ADX (above 15). These conditions trigger long entry signals when met. Opposite conditions trigger exit signals. The system also implements dynamic take-profit and stop-loss points based on a risk-reward ratio, achieving precise control over trading risk through parameterization.
Strategy Advantages
- Multiple technical indicator confirmation increases trading signal reliability
- Dynamic stop-loss and take-profit mechanism ensures controllable risk for each trade
- Parameterized design provides strong adaptability
- Trend strength confirmation mechanism effectively reduces false breakout risks
- Built-in alert functionality facilitates real-time market opportunity monitoring
Strategy Risks
- Multiple indicator conditions may cause missed trading opportunities
- Frequent false signals may occur in ranging markets
- Fixed risk-reward ratio may not suit all market environments
- Parameter optimization may lead to overfitting issues
Strategy Optimization Directions
- Introduce adaptive parameter adjustment mechanisms for dynamic indicator parameter updates based on market volatility
- Add volume indicators as supplementary confirmation signals
- Develop dynamic risk-reward ratio adjustment mechanisms based on market conditions
- Implement market volatility filters to adjust strategy aggressiveness in high-volatility environments
- Consider adding time filters to avoid trading during unfavorable periods
Summary
This strategy establishes a relatively complete trading system through the comprehensive use of multiple technical indicators. Its core advantage lies in improving trading signal reliability through indicator coordination while ensuring trading safety through dynamic risk control mechanisms. Although some inherent limitations exist, the strategy has significant room for improvement through the suggested optimization directions. Overall, this is a practical trading strategy framework suitable for further optimization and real-world application.
/*backtest
start: 2019-12-23 08:00:00
end: 2024-11-23 08:00:00
period: 1d
basePeriod: 1d
exchanges: [{"eid":"Futures_Binance","currency":"BTC_USDT"}]
*/

//@version=5
strategy("Enhanced EMA + RSI + ADX Strategy (Focused on 70% Win Rate)", overlay=true)

// Input parameters
lenFast = input.int(9, title="Fast EMA Length", minval=1)
lenSlow = input.int(21, title="Slow EMA Length", minval=1)
rsiPeriod = input.int(14, title="RSI Period")
adxPeriod = input.int(14, title="ADX Period")
adxSmoothing = input.int(1, title="ADX Smoothing")
adxThreshold = input.int(15, title="ADX Threshold")
riskRewardRatio = input.float(1.5, title="Risk/Reward Ratio")
rsiOverbought = input.int(60, title="RSI Overbought Level")  // Adjusted for flexibility
rsiOversold = input.int(40, title="RSI Oversold Level")

// EMA Calculations
fastEMA = ta.ema(close, lenFast)
slowEMA = ta.ema(close, lenSlow)

// RSI Calculation
rsiValue = ta.rsi(close, rsiPeriod)

// ADX Calculation
[plusDI, minusDI, adxValue] = ta.dmi(adxPeriod, adxSmoothing)

// Entry Conditions with Confirmation
buyCondition = ta.crossover(fastEMA, slowEMA) and rsiValue < rsiOverbought and adxValue > adxThreshold
sellCondition = ta.crossunder(fastEMA, slowEMA) and rsiValue > rsiOversold and adxValue > adxThreshold

// Dynamic Exit Conditions
takeProfit = strategy.position_avg_price + (close - strategy.position_avg_price) * riskRewardRatio
stopLoss = strategy.position_avg_price - (close - strategy.position_avg_price)

// Entry logic
if (buyCondition)
    strategy.entry("Buy", strategy.long)
    strategy.exit("Sell", from_entry="Buy", limit=takeProfit, stop=stopLoss)

if (sellCondition)
    strategy.close("Buy")

// Plotting EMAs
plot(fastEMA, color=color.new(color.green, 0), title="Fast EMA", linewidth=1)
plot(slowEMA, color=color.new(color.red, 0), title="Slow EMA", linewidth=1)

// Entry and exit markers
plotshape(series=buyCondition, style=shape.triangleup, location=location.belowbar, color=color.new(color.green, 0), size=size.normal, title="Buy Signal")
plotshape(series=sellCondition, style=shape.triangledown, location=location.abovebar, color=color.new(color.red, 0), size=size.normal, title="Sell Signal")

// Alerts
alertcondition(buyCondition, title="Buy Alert", message="Buy signal triggered")
alertcondition(sellCondition, title="Sell Alert", message="Sell signal triggered")