Overview
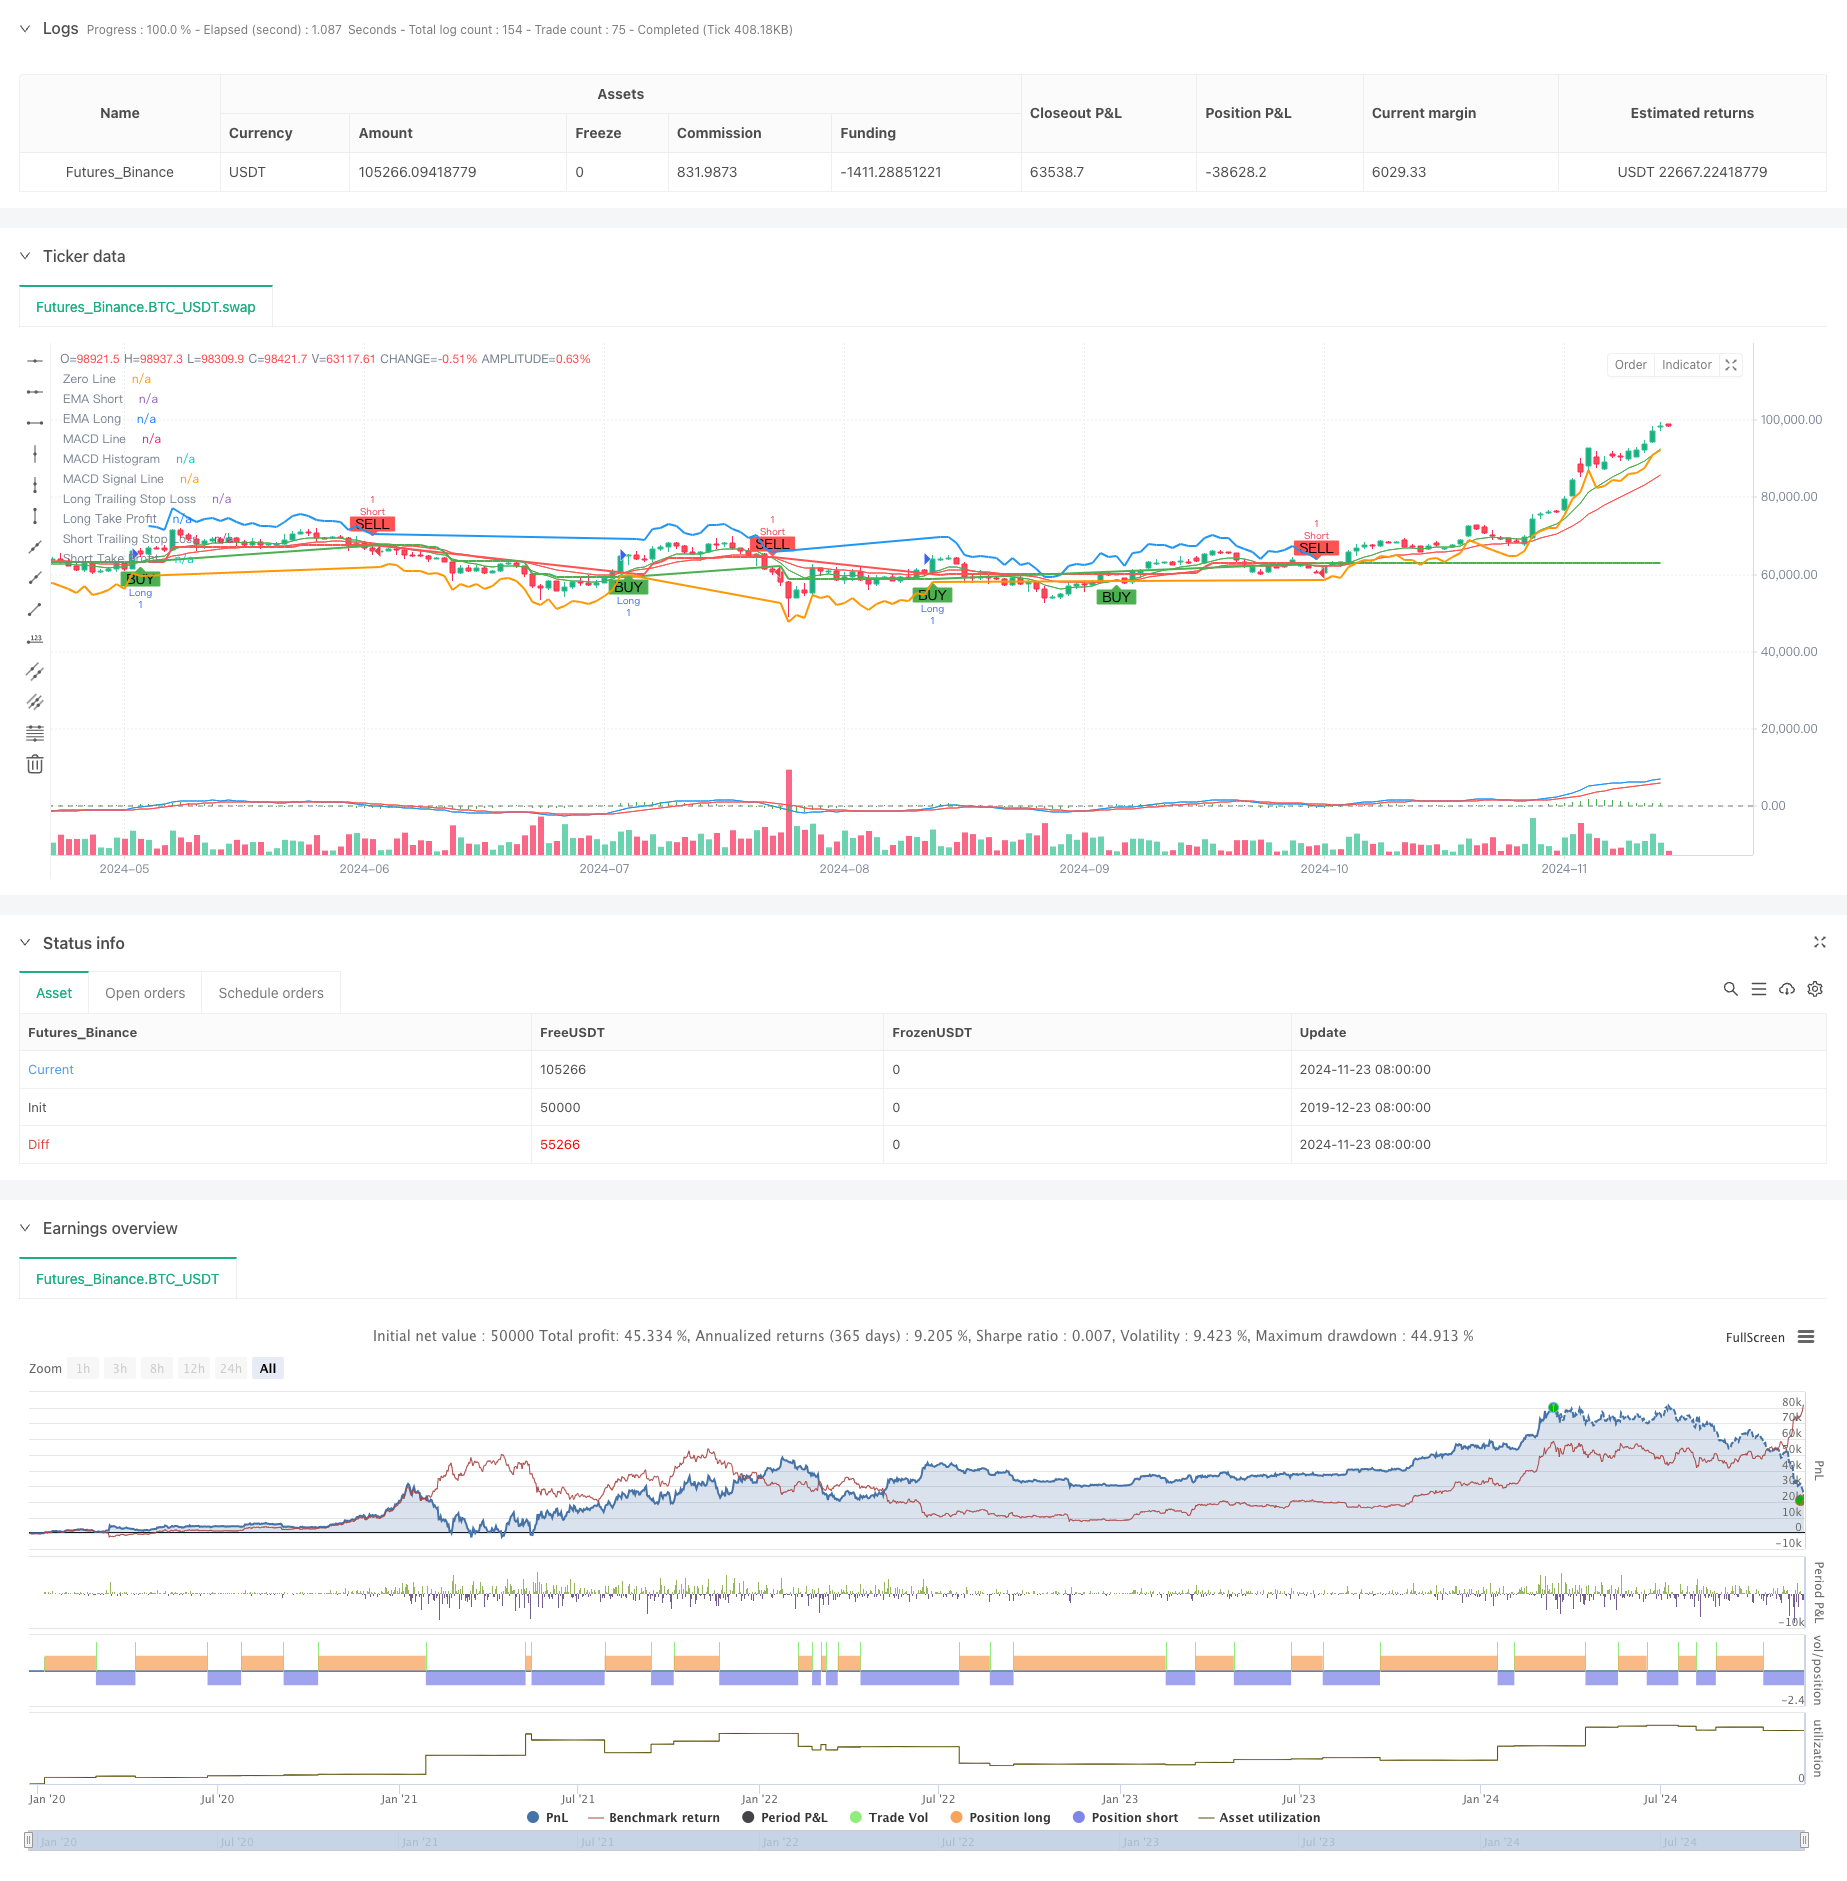
This strategy is a comprehensive trend following trading system that combines multi-timeframe analysis, moving averages, momentum indicators, and volatility indicators. The system identifies trend direction through crossovers of short-term and long-term exponential moving averages (EMA), uses the Relative Strength Index (RSI) for overbought/oversold conditions, incorporates MACD for momentum confirmation, and utilizes higher timeframe EMA as a trend filter. The system employs ATR-based dynamic stop-loss and take-profit mechanisms that adapt to market volatility.
Strategy Principles
The strategy employs a multi-layer verification mechanism for trading decisions: 1. Trend Identification: Uses 9 and 21 period EMA crossovers to capture trend changes 2. Momentum Confirmation: Verifies trend momentum through MACD (12,26,9) crossovers and direction 3. Overbought/Oversold Filter: Uses RSI(14) indicator at 70⁄30 levels for filtering 4. Higher Timeframe Confirmation: Optional daily EMA as trend filter 5. Risk Management: Uses 1.5x ATR for trailing stop-loss and 2x ATR for profit targets
The system only enters trades when multiple conditions are met: EMA crossover, RSI not at extreme levels, correct MACD direction, and higher timeframe trend confirmation. Exits combine trailing stops with fixed profit targets.
Strategy Advantages
- Multiple verification mechanisms significantly reduce false signals
- Higher timeframe trend filtering improves win rate
- Volatility-based dynamic stops provide strong adaptability
- Comprehensive risk management system
- Parameters can be flexibly adjusted for different markets
- Supports bilateral trading, adapting to various market environments
- Indicator combination considers both trend and momentum
Strategy Risks
- Multiple conditions may cause missed trading opportunities
- Frequent trading possible in ranging markets
- Parameter optimization may lead to overfitting
- Higher timeframe confirmation may delay entries Solutions:
- Dynamically adjust parameters based on market characteristics
- Increase flexibility in trading direction selection
- Introduce volatility filtering mechanism
- Optimize parameter adaptation mechanism
Optimization Directions
- Implement volatility filtering to adjust position sizing in high volatility periods
- Develop parameter adaptation mechanism based on market state
- Add volume indicators to confirm signal validity
- Optimize higher timeframe trend judgment logic
- Enhance stop-loss strategy, consider adding time-based exits
- Develop strategy performance evaluation module
Summary
This strategy is a complete trend following trading system that can achieve stable returns in trending markets through the combination of multiple technical indicators and strict risk management protocols. The system is highly extensible and can adapt to different market environments through optimization. Thorough backtesting and parameter optimization are recommended before live trading.
/*backtest
start: 2019-12-23 08:00:00
end: 2024-11-24 00:00:00
period: 1d
basePeriod: 1d
exchanges: [{"eid":"Futures_Binance","currency":"BTC_USDT"}]
*/

//@version=5
strategy("Trend Following with ATR, MTF Confirmation, and MACD", overlay=true)

// Parameters
emaShortPeriod = input.int(9, title="Short EMA Period", minval=1)
emaLongPeriod = input.int(21, title="Long EMA Period", minval=1)
rsiPeriod = input.int(14, title="RSI Period", minval=1)
rsiOverbought = input.int(70, title="RSI Overbought", minval=50)
rsiOversold = input.int(30, title="RSI Oversold", minval=1)
atrPeriod = input.int(14, title="ATR Period", minval=1)
atrMultiplier = input.float(1.5, title="ATR Multiplier", minval=0.1)
takeProfitATRMultiplier = input.float(2.0, title="Take Profit ATR Multiplier", minval=0.1)

// Multi-timeframe settings
htfEMAEnabled = input.bool(true, title="Use Higher Timeframe EMA Confirmation?", inline="htf")
htfEMATimeframe = input.timeframe("D", title="Higher Timeframe", inline="htf")

// MACD Parameters
macdShortPeriod = input.int(12, title="MACD Short Period", minval=1)
macdLongPeriod = input.int(26, title="MACD Long Period", minval=1)
macdSignalPeriod = input.int(9, title="MACD Signal Period", minval=1)

// Select trade direction
tradeDirection = input.string("Both", title="Trade Direction", options=["Both", "Long", "Short"])

// Calculating indicators
emaShort = ta.ema(close, emaShortPeriod)
emaLong = ta.ema(close, emaLongPeriod)
rsiValue = ta.rsi(close, rsiPeriod)
atrValue = ta.atr(atrPeriod)

// Calculate MACD
[macdLine, macdSignalLine, _] = ta.macd(close, macdShortPeriod, macdLongPeriod, macdSignalPeriod)

// Higher timeframe EMA confirmation
htfEMALong = request.security(syminfo.tickerid, htfEMATimeframe, ta.ema(close, emaLongPeriod))

// Trading conditions
longCondition = ta.crossover(emaShort, emaLong) and rsiValue < rsiOverbought and (not htfEMAEnabled or close > htfEMALong) and macdLine > macdSignalLine
shortCondition = ta.crossunder(emaShort, emaLong) and rsiValue > rsiOversold and (not htfEMAEnabled or close < htfEMALong) and macdLine < macdSignalLine

// Plotting EMAs
plot(emaShort, title="EMA Short", color=color.green)
plot(emaLong, title="EMA Long", color=color.red)

// Plotting MACD
hline(0, "Zero Line", color=color.gray)
plot(macdLine - macdSignalLine, title="MACD Histogram", color=color.green, style=plot.style_histogram)
plot(macdLine, title="MACD Line", color=color.blue)
plot(macdSignalLine, title="MACD Signal Line", color=color.red)

// Trailing Stop-Loss and Take-Profit levels
var float trailStopLoss = na
var float trailTakeProfit = na

if (strategy.position_size > 0) // Long Position
    trailStopLoss := na(trailStopLoss) ? close - atrValue * atrMultiplier : math.max(trailStopLoss, close - atrValue * atrMultiplier)
    trailTakeProfit := close + atrValue * takeProfitATRMultiplier
    strategy.exit("Exit Long", "Long", stop=trailStopLoss, limit=trailTakeProfit, when=shortCondition)

if (strategy.position_size < 0) // Short Position
    trailStopLoss := na(trailStopLoss) ? close + atrValue * atrMultiplier : math.min(trailStopLoss, close + atrValue * atrMultiplier)
    trailTakeProfit := close - atrValue * takeProfitATRMultiplier
    strategy.exit("Exit Short", "Short", stop=trailStopLoss, limit=trailTakeProfit, when=longCondition)

// Strategy Entry
if (longCondition and (tradeDirection == "Both" or tradeDirection == "Long"))
    strategy.entry("Long", strategy.long)

if (shortCondition and (tradeDirection == "Both" or tradeDirection == "Short"))
    strategy.entry("Short", strategy.short)

// Plotting Buy/Sell signals
plotshape(series=longCondition, title="Buy Signal", location=location.belowbar, color=color.green, style=shape.labelup, text="BUY")
plotshape(series=shortCondition, title="Sell Signal", location=location.abovebar, color=color.red, style=shape.labeldown, text="SELL")

// Plotting Trailing Stop-Loss and Take-Profit levels
plot(strategy.position_size > 0 ? trailStopLoss : na, title="Long Trailing Stop Loss", color=color.red, linewidth=2, style=plot.style_line)
plot(strategy.position_size < 0 ? trailStopLoss : na, title="Short Trailing Stop Loss", color=color.green, linewidth=2, style=plot.style_line)
plot(strategy.position_size > 0 ? trailTakeProfit : na, title="Long Take Profit", color=color.blue, linewidth=2, style=plot.style_line)
plot(strategy.position_size < 0 ? trailTakeProfit : na, title="Short Take Profit", color=color.orange, linewidth=2, style=plot.style_line)