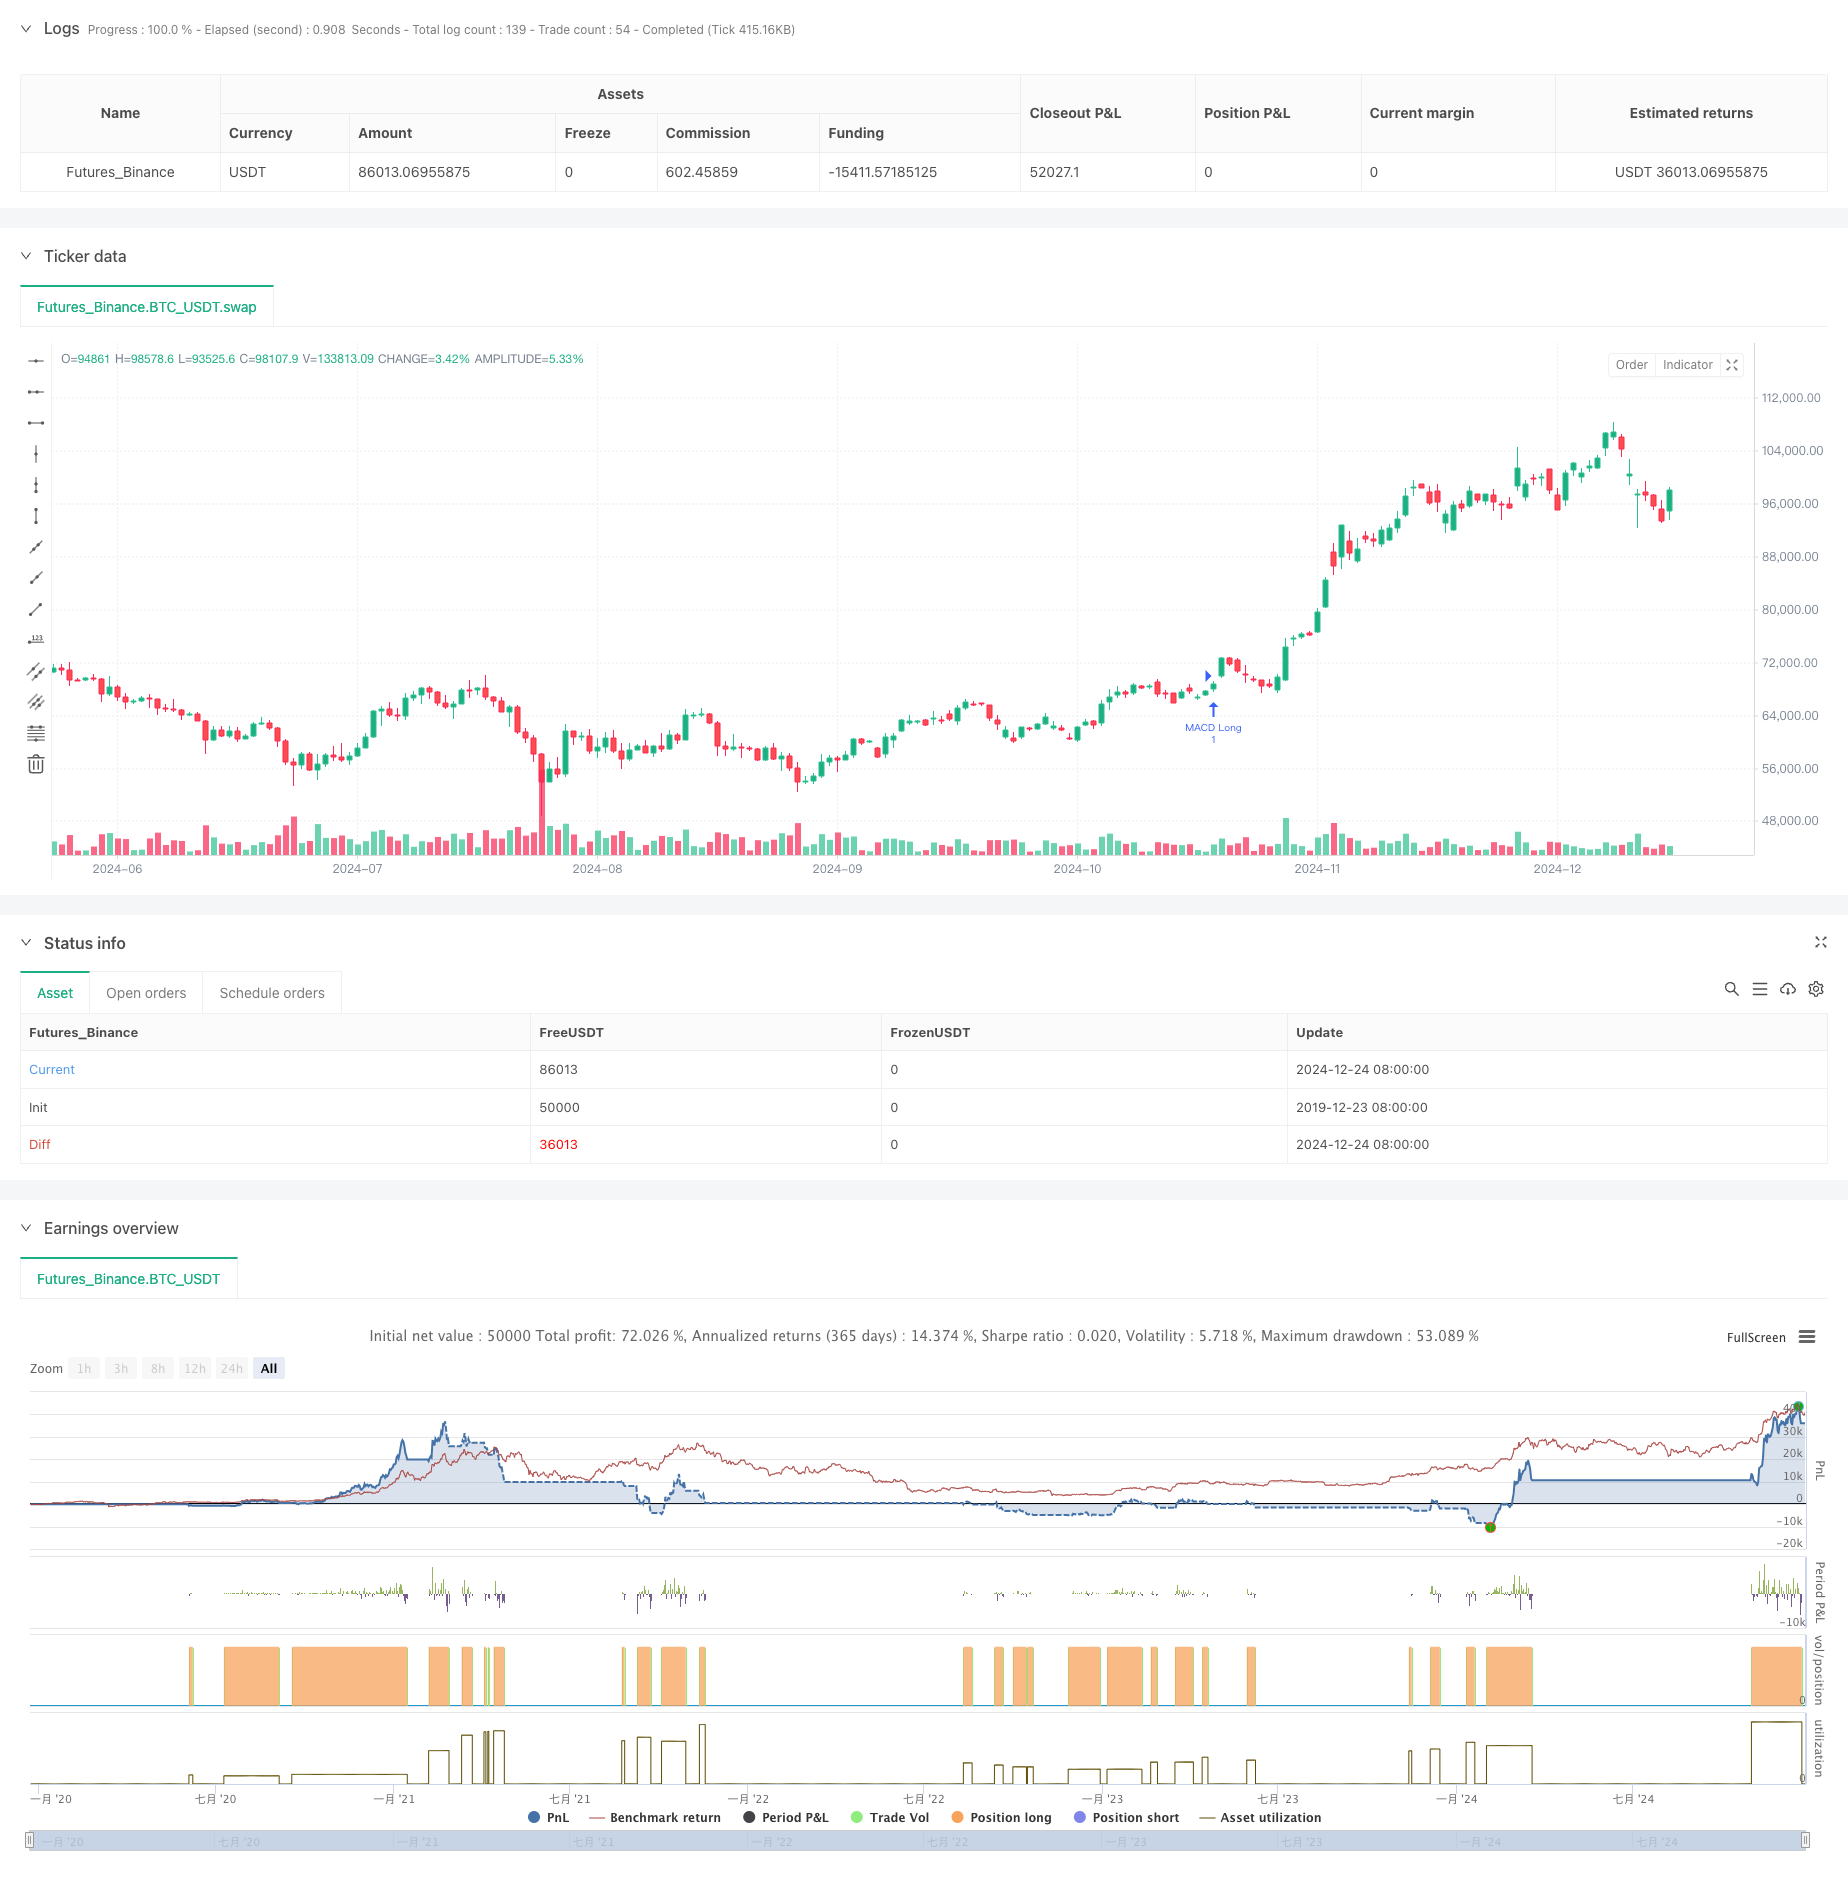
Overview
This strategy combines MACD cross signals from multiple timeframes with dynamic support and resistance levels based on 52-week highs and lows. It confirms trading signals through MACD crossovers on both weekly and daily timeframes while utilizing dynamic support and resistance lines formed by 52-week highs and lows to assist in market trend analysis, enabling more robust trading decisions. The strategy employs a dynamic stop-loss mechanism to effectively control risk while ensuring profits.
Strategy Principles
The strategy is based on the following core logic: 1. Entry signals are confirmed by both weekly and daily MACD golden crosses, requiring bullish signals on both timeframes. 2. Exit signals are triggered by daily MACD death crosses, with positions closed once a bearish signal appears. 3. Dynamic stop-loss is set at the lowest price of the day when exit signals are triggered. 4. 52-week high/low lines are dynamically generated based on user-selected calculation basis (high/low or closing prices) and extend rightward as important reference levels. 5. The strategy employs 5% position management with a transaction cost of 1 currency unit per trade.
Strategy Advantages
- Multi-timeframe confirmation: Filters false breakouts through resonance of MACD signals on weekly and daily levels, improving trading accuracy.
- Dynamic support/resistance: 52-week high/low lines provide important psychological price references, helping assess trend strength.
- Comprehensive risk control: Dynamic stop-loss mechanism adjusts with market fluctuations to protect profits.
- High visualization: Clear graphical interface displays key price levels and signals, facilitating understanding and operation.
- Systematic trading: Strict entry/exit rules avoid emotional interference, enhancing trading objectivity.
Strategy Risks
- Unsuitable for ranging markets: Frequent MACD crossovers in sideways markets may generate excessive false signals.
- Lag risk: MACD indicator’s inherent lag may miss optimal entry points.
- Money management risk: Fixed proportion positioning may lack flexibility in certain market conditions.
- Market gap risk: Large gaps may result in actual stop-loss prices far below expected levels.
- Parameter optimization risk: Excessive optimization may lead to overfitting issues.
Strategy Optimization Directions
- Incorporate volume-price relationship analysis: Consider adding volume confirmation to existing MACD signals.
- Optimize position management: Design more flexible position management mechanisms, adjusting dynamically with market volatility.
- Enhance stop-loss mechanism: Consider adding trailing stops or ATR-based dynamic stops.
- Add market environment filtering: Introduce trend strength indicators, only opening positions in strong trend markets.
- Develop signal filtering mechanism: Design stricter signal confirmation conditions to reduce false signals.
Summary
This strategy constructs a complete trend-following trading system by combining multi-timeframe MACD cross signals with dynamic support and resistance lines based on 52-week highs and lows. Its strengths lie in signal confirmation reliability and comprehensive risk control, though attention must be paid to ranging market and lag risks. Through continuous optimization and improvement, this strategy shows promise for achieving stable returns in trending markets.
/*backtest
start: 2019-12-23 08:00:00
end: 2024-12-25 08:00:00
period: 1d
basePeriod: 1d
exchanges: [{"eid":"Futures_Binance","currency":"BTC_USDT"}]
*/

//@version=5
strategy("MACD Bitcoin strategy con 52W High/Low (linee estese)", overlay=true)

// === MACD SETTINGS ===
fastLength = 12
slowLength = 26
signalSmoothing = 9

// Funzione per ottenere i valori MACD
getMACD(source, timeframe) =>
    [macdLine, signalLine, _] = ta.macd(source, fastLength, slowLength, signalSmoothing)
    [macdLine, signalLine]

// Valori MACD Settimanali
[macdWeekly, signalWeekly] = request.security(syminfo.tickerid, "W", getMACD(close, "W"), lookahead=barmerge.lookahead_on)

// Valori MACD Giornalieri
[macdDaily, signalDaily] = getMACD(close, "D")

// Variabile per lo stop loss
var float lowOfSignalCandle = na

// Condizione per l'ingresso
longConditionWeekly = ta.crossover(macdWeekly, signalWeekly)
exitConditionDaily = ta.crossunder(macdDaily, signalDaily)

// Imposta Stop Loss sulla candela giornaliera
if (exitConditionDaily)
    lowOfSignalCandle := low

// Condizione di ingresso nel trade
enterTradeCondition = macdWeekly > signalWeekly and ta.crossover(macdDaily, signalDaily)

if (enterTradeCondition)
    strategy.entry("MACD Long", strategy.long)

if (not na(lowOfSignalCandle))
    strategy.exit("Stop Loss", "MACD Long", stop=lowOfSignalCandle)

if (strategy.position_size == 0)
    lowOfSignalCandle := na

// // === 52 WEEK HIGH/LOW SETTINGS ===
// // Input per selezionare tra Highs/Lows o Close
// high_low_close = input.string(defval="Highs/Lows", title="Base 52 week values on candle:", options=["Highs/Lows", "Close"])

// // Calcolo dei valori delle 52 settimane
// weekly_hh = request.security(syminfo.tickerid, "W", ta.highest(high, 52), lookahead=barmerge.lookahead_on)
// weekly_ll = request.security(syminfo.tickerid, "W", ta.lowest(low, 52), lookahead=barmerge.lookahead_on)
// weekly_hc = request.security(syminfo.tickerid, "W", ta.highest(close, 52), lookahead=barmerge.lookahead_on)
// weekly_lc = request.security(syminfo.tickerid, "W", ta.lowest(close, 52), lookahead=barmerge.lookahead_on)

// // Selezione dei valori in base all'input
// high_plot = high_low_close == "Highs/Lows" ? weekly_hh : weekly_hc
// low_plot = high_low_close == "Highs/Lows" ? weekly_ll : weekly_lc

// // === LINEE ORIZZONTALI ESTESE FINO AL PREZZO ATTUALE ===
// var line highLine = na
// var line lowLine = na

// // Linea Orizzontale per il 52W High
// if (na(highLine))
//     highLine := line.new(bar_index, high_plot, bar_index + 1, high_plot, color=color.green, width=2, style=line.style_dashed, extend=extend.right)
// else
//     line.set_y1(highLine, high_plot)
//     line.set_y2(highLine, high_plot)

// // Linea Orizzontale per il 52W Low
// if (na(lowLine))
//     lowLine := line.new(bar_index, low_plot, bar_index + 1, low_plot, color=color.red, width=2, style=line.style_dashed, extend=extend.right)
// else
//     line.set_y1(lowLine, low_plot)
//     line.set_y2(lowLine, low_plot)

// // Etichette per le linee orizzontali
// var label highLabel = na
// var label lowLabel = na

// if (na(highLabel))
//     highLabel := label.new(bar_index, high_plot, "52W High", color=color.green, textcolor=color.white, style=label.style_label_down, size=size.small)
// else
//     label.set_y(highLabel, high_plot)
//     label.set_x(highLabel, bar_index)

// if (na(lowLabel))
//     lowLabel := label.new(bar_index, low_plot, "52W Low", color=color.red, textcolor=color.white, style=label.style_label_up, size=size.small)
// else
//     label.set_y(lowLabel, low_plot)
//     label.set_x(lowLabel, bar_index)

// // Tracciamento delle Linee Estese
// plot(high_plot, title="52W High", color=color.green, style=plot.style_linebr)
// plot(low_plot, title="52W Low", color=color.red, style=plot.style_linebr)