Overview
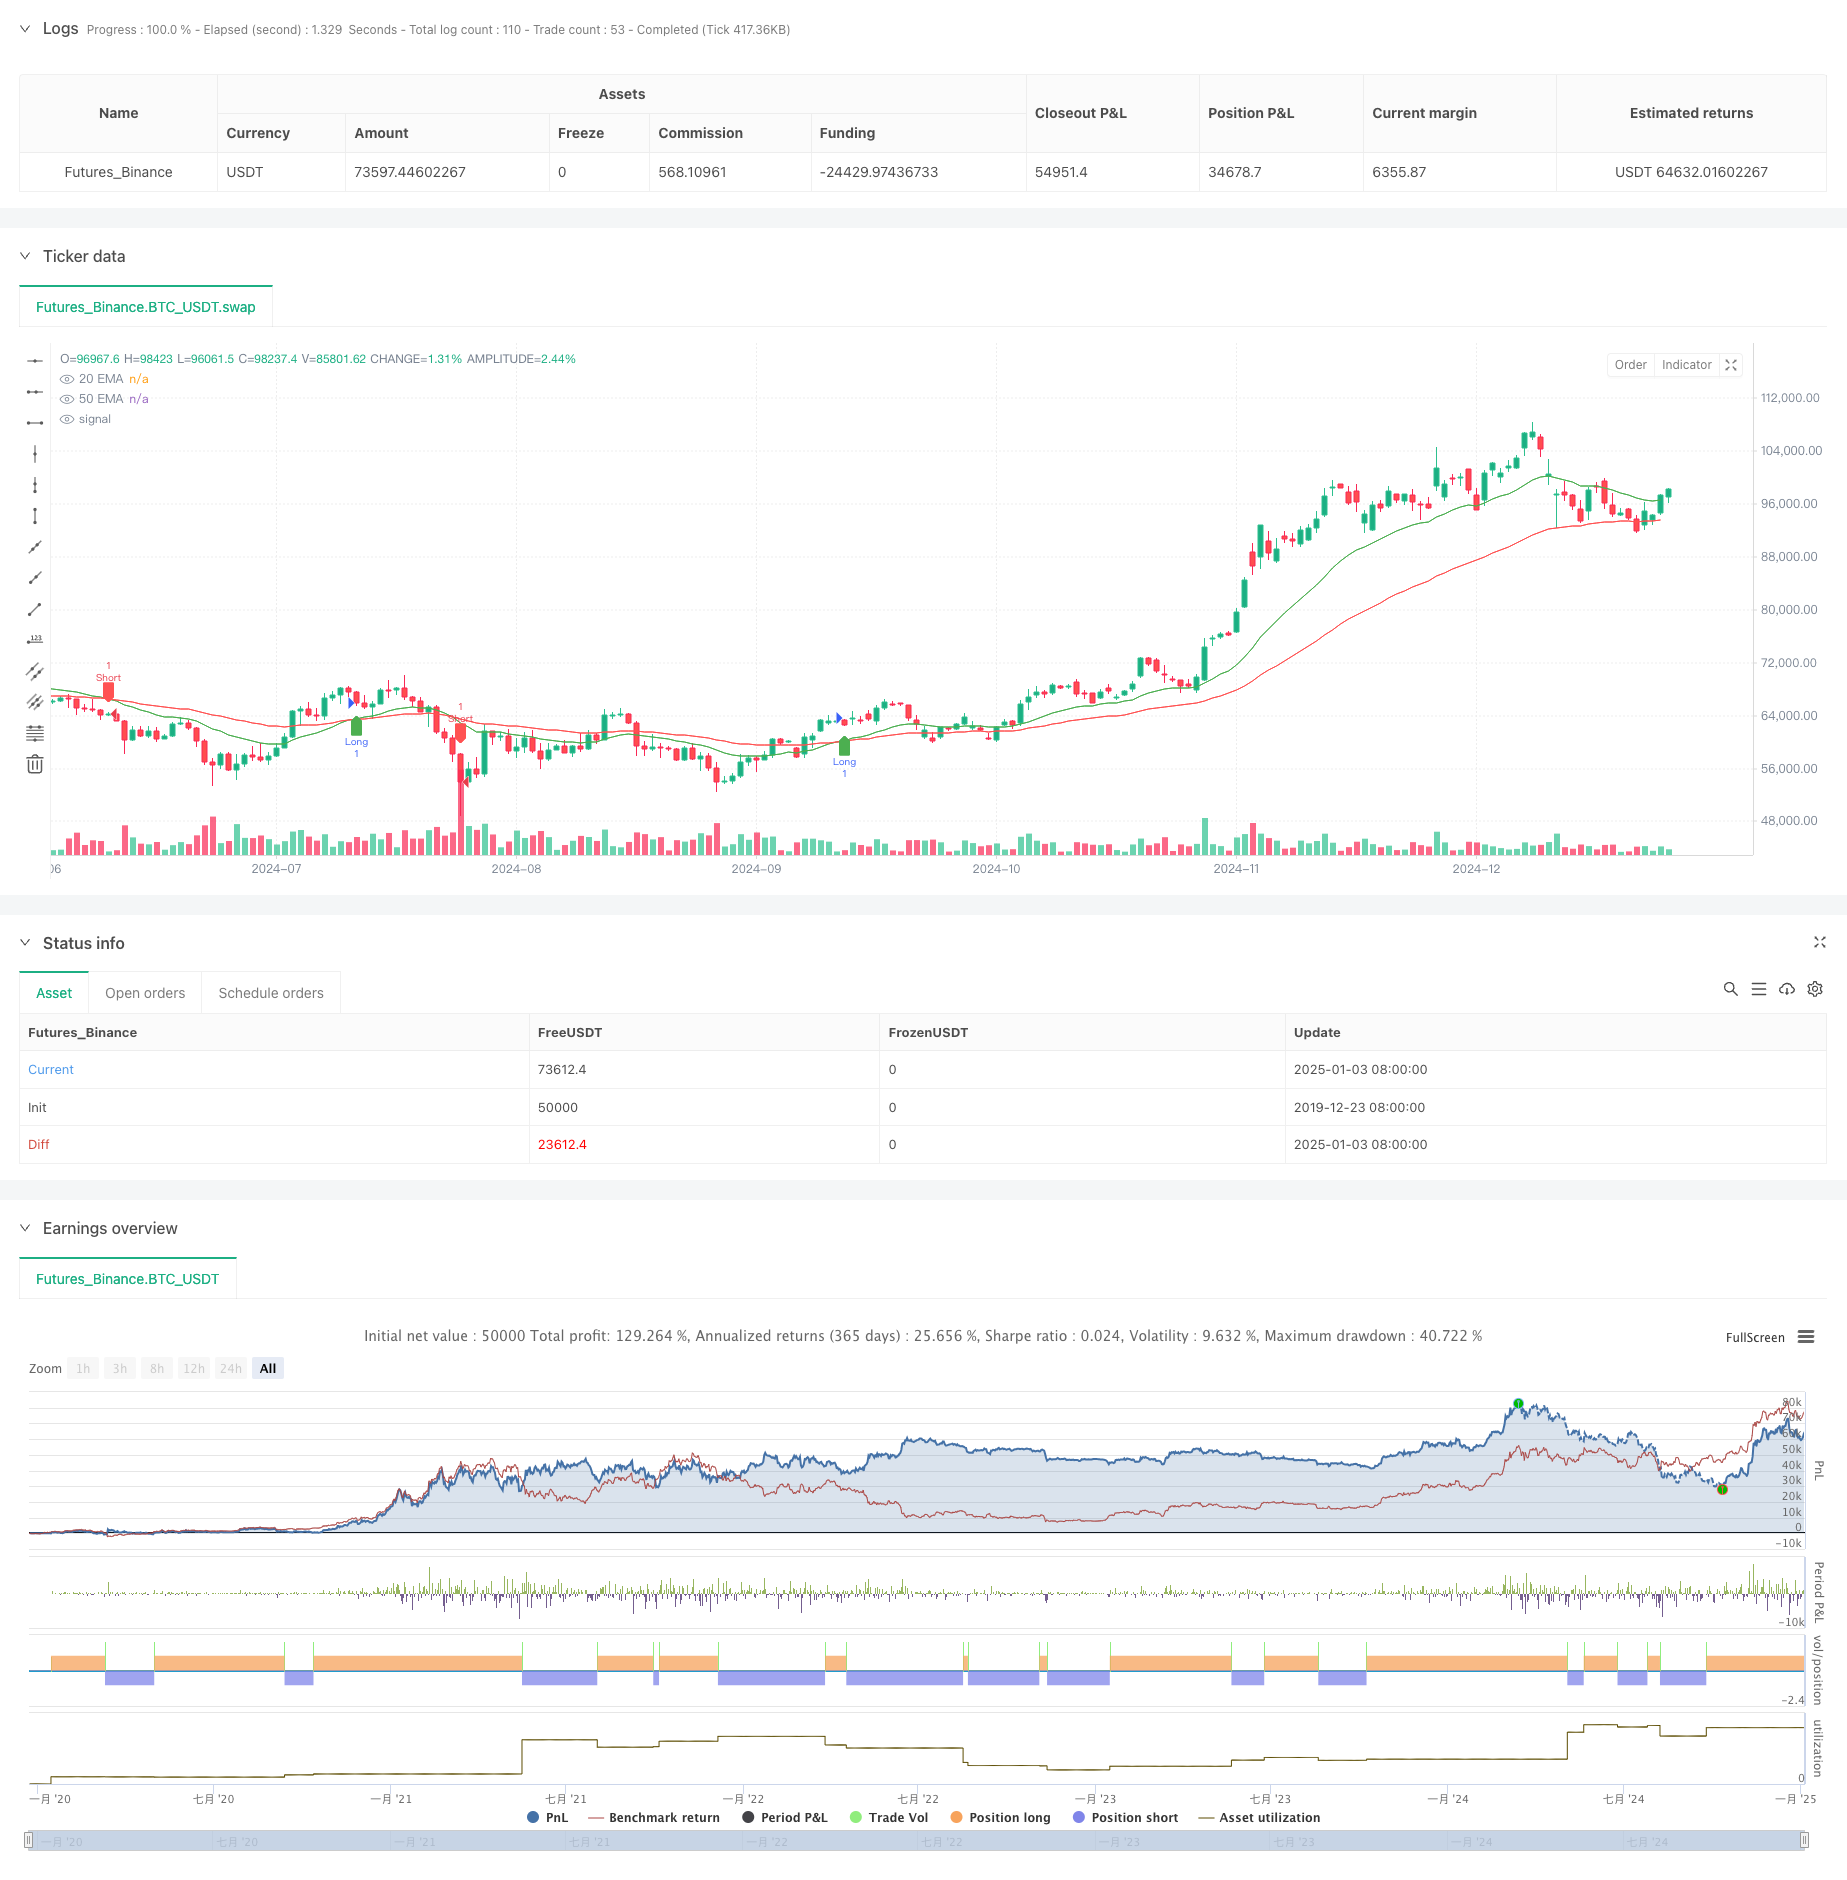
This strategy is a dynamic trend following system based on dual EMA crossover signals, which identifies market trend changes through the crossover of short-term 20-day Exponential Moving Average (EMA) and long-term 50-day EMA, executing buy and sell operations automatically. The strategy employs mature technical analysis methods, combining trend following with dynamic position management, suitable for markets with significant volatility.
Strategy Principles
The core logic of the strategy is based on the following key elements: 1. Uses two EMAs with different periods (20-day and 50-day) as trend judgment indicators 2. Generates long signals when the short-term 20-day EMA crosses above the long-term 50-day EMA 3. Generates short signals when the short-term 20-day EMA crosses below the long-term 50-day EMA 4. Dynamically tracks position status through the position variable to ensure accurate position management 5. Automatically closes existing positions and establishes new positions when crossover signals occur
Strategy Advantages
- Clear Signals: The signal judgment mechanism based on EMA crossover is simple and intuitive, reducing false signals
- Complete Risk Control: Employs dynamic position management mechanism for timely market response
- Wide Adaptability: Strategy can be applied to different market environments and trading instruments
- High Execution Efficiency: Programmatic trading ensures rapid execution after signal generation
- Convenient Backtesting: Built-in complete backtesting framework facilitates strategy optimization and verification
Strategy Risks
- Choppy Market Risk: May generate frequent false breakout signals in sideways markets
- Slippage Risk: May face significant execution slippage during severe market volatility
- Delay Risk: EMA indicators have inherent lag, potentially leading to suboptimal entry points
- Money Management Risk: Strategy lacks stop-loss and money management mechanisms, requiring additional improvement
- Systematic Risk: May face systematic risks during severe market volatility
Strategy Optimization Directions
- Introduce volatility filters to reduce false signals in choppy markets
- Add adaptive stop-loss and take-profit mechanisms to enhance capital safety
- Optimize EMA period parameters for better adaptation to different market environments
- Add volume confirmation mechanism to improve signal reliability
- Introduce dynamic position management system to optimize capital utilization efficiency
Summary
This strategy is a modern implementation of a classic trend following system, systematizing and standardizing the traditional dual EMA crossover strategy through programmatic trading. While inherent risks exist, the strategy has good application prospects through continuous optimization and improvement. It is recommended to conduct thorough parameter optimization and backtesting before live trading.
/*backtest
start: 2019-12-23 08:00:00
end: 2025-01-04 08:00:00
period: 1d
basePeriod: 1d
exchanges: [{"eid":"Futures_Binance","currency":"BTC_USDT"}]
*/

//@version=5
strategy("EMA Crossover Buy/Sell Signals", overlay=true)

// Input parameters for EMAs
emaShortLength = input.int(20, title="Short EMA Length")
emaLongLength = input.int(50, title="Long EMA Length")

// Calculating EMAs
emaShort = ta.ema(close, emaShortLength)
emaLong = ta.ema(close, emaLongLength)

// Plotting EMA crossover lines
plot(emaShort, color=color.green, title="20 EMA")
plot(emaLong, color=color.red, title="50 EMA")

// Buy and Sell signal logic
longCondition = ta.crossover(emaShort, emaLong)
exitLongCondition = ta.crossunder(emaShort, emaLong)
shortCondition = ta.crossunder(emaShort, emaLong)
exitShortCondition = ta.crossover(emaShort, emaLong)

// Plot buy and sell signals on the chart
plotshape(series=longCondition, location=location.belowbar, color=color.green, style=shape.labelup, title="Buy Signal")
plotshape(series=exitLongCondition, location=location.abovebar, color=color.red, style=shape.labeldown, title="Sell Exit")

plotshape(series=shortCondition, location=location.abovebar, color=color.red, style=shape.labeldown, title="Sell Signal")
plotshape(series=exitShortCondition, location=location.belowbar, color=color.green, style=shape.labelup, title="Buy Exit")

// Backtesting strategy logic
var float entryPrice = na
var int position = 0  // 1 for long, -1 for short, 0 for no position

if (longCondition and position == 0)
    entryPrice := close
    position := 1

if (shortCondition and position == 0)
    entryPrice := close
    position := -1

if (exitLongCondition and position == 1)
    strategy.exit("Exit Long", from_entry="Long", limit=close)
    position := 0

if (exitShortCondition and position == -1)
    strategy.exit("Exit Short", from_entry="Short", limit=close)
    position := 0

if (longCondition)
    strategy.entry("Long", strategy.long)
if (shortCondition)
    strategy.entry("Short", strategy.short)