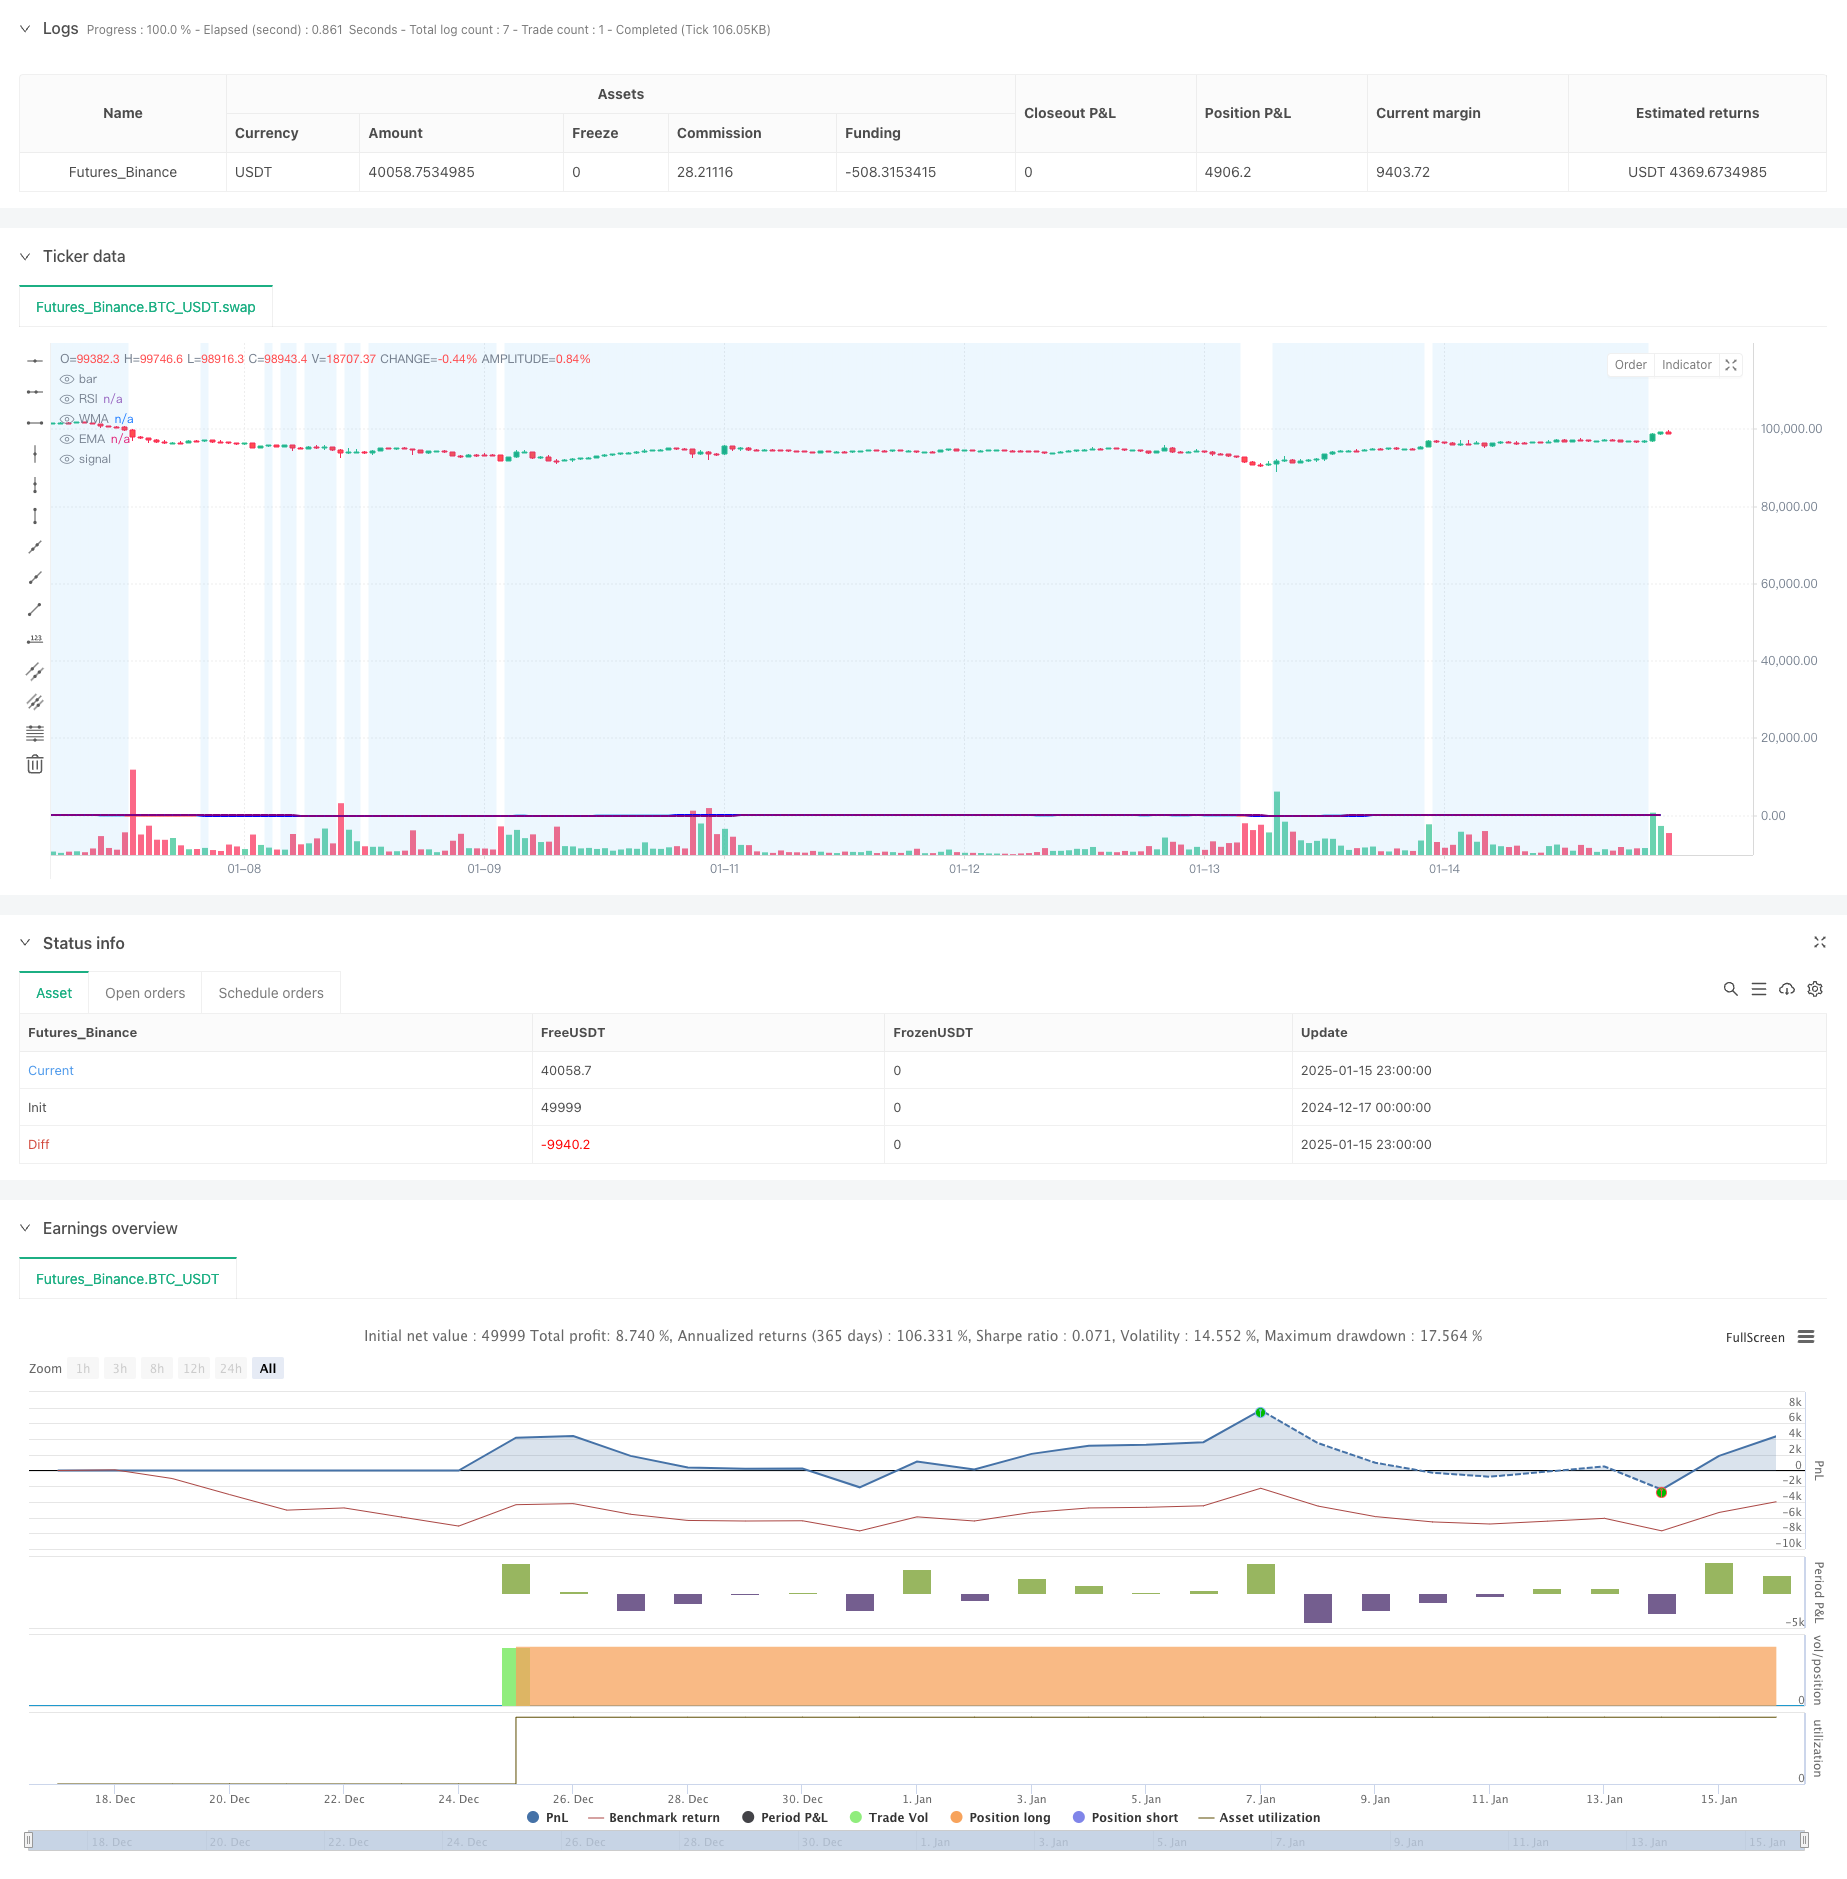
Overview
This strategy is a trend following trading system that combines the Relative Strength Index (RSI), Weighted Moving Average (WMA), and Exponential Moving Average (EMA). By utilizing multiple technical indicators, the strategy captures market momentum changes at trend reversal points to generate trading signals. The system uses WMA and EMA crossovers to confirm trend direction while incorporating RSI to filter market conditions for improved trading accuracy.
Strategy Principles
The core logic of the strategy is based on the following key elements: 1. RSI calculation uses a 14-period setting to measure market overbought/oversold conditions 2. 45-period WMA and 89-period EMA crossovers confirm trend transitions 3. Entry conditions: - Long signal: WMA crosses above EMA and RSI<50 - Short signal: WMA crosses below EMA and RSI>50 4. The system visualizes market conditions through RSI color changes, showing green when RSI>70 and red when RSI<30 5. Blue background is set in the RSI 30-70 range to help identify neutral zones
Strategy Advantages
- The combination of multiple technical indicators enhances trading signal reliability
- WMA is more sensitive to recent price changes while EMA maintains long-term trend tracking
- RSI as a filter effectively prevents false signals in overly volatile markets
- Visual interface design helps traders intuitively judge market conditions
- Includes a complete alert system to notify traders of potential trading opportunities
Strategy Risks
- May generate frequent false breakout signals in sideways markets
- Moving averages’ lag nature might cause slightly delayed entries
- Fixed RSI thresholds may not be suitable for all market environments
- Lack of volatility consideration may increase risk during high volatility periods
- Absence of stop-loss and take-profit mechanisms may affect money management effectiveness
Strategy Optimization Directions
- Introduce adaptive RSI thresholds that dynamically adjust based on market volatility
- Add ATR indicator for position sizing and dynamic stop-loss settings
- Optimize WMA and EMA periods, considering adjustments for different timeframes
- Add volume indicators as confirmation signals
- Implement more sophisticated position management systems, such as pyramid-style scaling
Summary
This is a trend following strategy based on multiple technical indicators, combining RSI, WMA, and EMA to capture market trend reversal points while maintaining trading stability. Although it has certain lag and false signal risks, through appropriate optimization and risk management measures, the strategy has good practical value and room for expansion.
/*backtest
start: 2024-12-17 00:00:00
end: 2025-01-16 00:00:00
period: 1h
basePeriod: 1h
exchanges: [{"eid":"Futures_Binance","currency":"BTC_USDT","balance":49999}]
*/

//@version=5
strategy(title="RSI + WMA + EMA Strategy", shorttitle="RSI Strategy", overlay=true)

// RSI Settings
rsiLengthInput = input.int(14, minval=1, title="RSI Length", group="RSI Settings")
rsiSourceInput = input.source(close, "Source", group="RSI Settings")

// WMA and EMA Settings
wmaLengthInput = input.int(45, minval=1, title="WMA Length", group="WMA Settings")
wmaColorInput = input.color(color.blue, title="WMA Color", group="WMA Settings")
emaLengthInput = input.int(89, minval=1, title="EMA Length", group="EMA Settings")
emaColorInput = input.color(color.purple, title="EMA Color", group="EMA Settings")

// RSI Calculation
change = ta.change(rsiSourceInput)
up = ta.rma(math.max(change, 0), rsiLengthInput)
down = ta.rma(-math.min(change, 0), rsiLengthInput)
rsi = down == 0 ? 100 : up == 0 ? 0 : 100 - (100 / (1 + up / down))

// WMA and EMA Calculation
wma = ta.wma(rsi, wmaLengthInput)
ema = ta.ema(rsi, emaLengthInput)

// RSI Color Logic
rsiColor = rsi > 70 ? color.new(color.green, 100 - math.round(rsi)) : rsi < 30 ? color.new(color.red, math.round(rsi)) : color.new(color.blue, 50)

// Plot RSI, WMA, and EMA
plot(rsi, "RSI", color=rsiColor)
plot(wma, title="WMA", color=wmaColorInput, linewidth=2)
plot(ema, title="EMA", color=emaColorInput, linewidth=2)

// Highlight RSI Area between 30 and 70
bgcolor(rsi >= 30 and rsi <= 70 ? color.new(color.blue, 90) : na)

// Entry and Exit Conditions
longCondition = ta.crossover(wma, ema) and rsi < 50
shortCondition = ta.crossunder(wma, ema) and rsi > 50

if (longCondition)
    strategy.entry("Long", strategy.long)
    alert("Buy Signal: WMA crossed above EMA, RSI < 50", alert.freq_once_per_bar)

if (shortCondition)
    strategy.entry("Short", strategy.short)
    alert("Sell Signal: WMA crossed below EMA, RSI > 50", alert.freq_once_per_bar)

// Optional: Plot Buy/Sell Signals on Chart
plotshape(series=longCondition, style=shape.labelup, location=location.belowbar, color=color.green, size=size.small, title="Buy Signal")
plotshape(series=shortCondition, style=shape.labeldown, location=location.abovebar, color=color.red, size=size.small, title="Sell Signal")