Comercio cuantitativo de criptomonedas para principiantes - acercándote a la criptomoneda cuantitativa (7)
El autor:FMZ~Lydia, Creado: 2022-08-09 11:15:23, Actualizado: 2023-09-21 21:00:10
En el artículo anterior, pensamos y diseñamos juntos una estrategia de cuadrícula de múltiples especies simple. A continuación, continuaremos aprendiendo y avanzando en el camino del comercio cuantitativo. En este artículo, exploraremos un diseño de estrategia más complejo: el diseño de estrategias de cobertura. Este artículo planea diseñar una estrategia de cobertura intertemporal de múltiples especies. Cuando se trata de estrategias de cobertura intertemporal, aquellos que están familiarizados con el comercio de futuros deben estar familiarizados con ella. Para los principiantes, es posible que no entiendan estos conceptos, así que comencemos con una breve explicación del concepto de cobertura intertemporal.
Cuentas de riesgo
En pocas palabras, la cobertura intertemporal es ir largo un contrato, ir corto un contrato, y esperar tres situaciones (largo y corto) para cerrar la posición al mismo tiempo:
- Si usted gana dinero por ir largo y perder dinero por ir corto, y cerrar su posición cuando la ganancia (como dice el dicho) es mayor que la pérdida (como dice el dicho), usted hará una ganancia después de la ganancia / pérdida balance.
- Las posiciones largas pierden dinero, las posiciones cortas ganan dinero, y se cierra la posición cuando la que es más rentable que la que pierde,... (lo mismo que arriba).
- Ganar dinero si vas largo, y ganar dinero si vas corto, así que ¿cuál es la vacilación?
En otros casos son pérdidas flotantes, que llevan o continúan a escalar en la posición. (Debido a que la fluctuación del diferencial es más moderada que la fluctuación unilateral, el riesgo relativo es menor, tenga en cuenta que sólo relativo!)
Let A1 be the price of contract A at moment 1, and set B1 to be the price of contract B at moment 1. At this time, short contract A, short price A1, long contract B, and long price B1.
Let A2 be the price of contract A at moment 2, and set B2 to be the price of contract B at moment 2. At this time, close the position contract A (short), close short A2, close the position B contract (long), and close long price B2.

Moment 1 difference:A1 - B1 = X
Moment 2 difference:A2 - B2 = Y
X - Y = A1 - B1 - (A2 - B2)
X - Y = A1 - B1 - A2 + B2
X - Y = A1 - A2 + B2 - B1

It can be seen that A1 - A2 is the profit difference in closing the position of contract A.
B2 - B1 is the profit spread of closing the position of contract B. As long as the two closed positions are overall positive, ie: A1 - A2 + B2 - B1 > 0 is profitable. That is, as long as X - Y > 0.
Because of: X - Y = A1 - A2 + B2 - B1

It is concluded that as long as the difference X of opening a position is greater than the difference Y of closing a position, it is profitable (note that it is short A, long B to open a position, the reverse will be the opposite), of course, this is theoretical, practical factors such as commission and slippage should also be considered.
Debido a que los intercambios de criptomonedas tienen contratos de entrega y contratos perpetuos. Y el precio de los contratos perpetuos siempre está cerca del precio spot debido a la tasa de financiación. Entonces elegimos usar contratos de entrega y contratos perpetuos para el arbitraje de cobertura. El contrato de entrega elige un contrato a más largo plazo, por lo que el contrato de cobertura no necesita ser establecido con frecuencia.
Calentar con una estadística de propagación de múltiples especies primero
Una vez que conozcas los principios básicos, no tienes que apresurarte a escribir estrategias. En primer lugar, puedes obtener una estadística de propagación, dibujar un gráfico y observar las propagaciones.
Diseñamos basándonos en elContrato de OKEX. Es muy simple dibujar en FMZ. Es muy fácil usar las funciones empaquetadas para dibujar.Las tablas de mayor importancia. La descripción de la función de dibujo en la documentación de la API:https://www.fmz.com/api#chart...
Dado que se trata de una multispecies, en primer lugar, es necesario determinar la diferencia de precio de esas especies antes de dibujar.
var arrSwapContractType = ["BTC-USDT-SWAP", "LTC-USDT-SWAP", "ETH-USDT-SWAP", "ETC-USDT-SWAP"]   // Perpetual contracts
var arrDeliveryContractType = ["BTC-USDT-210924", "LTC-USDT-210924", "ETH-USDT-210924", "ETC-USDT-210924"]  // Delivery contracts
Inicie la configuración del gráfico de acuerdo con el código de contrato establecido aquí. Esta configuración del gráfico ciertamente no puede ser codificada, porque no sabe qué especies y cuántas especies hacer (estos se determinan por los valores de arrDeliveryContractType y arrSwapContractType), por lo que la configuración del gráfico es devuelta por una función.
function createCfg(symbol) {
    var cfg = {
        extension: {
            // No grouping, displayed separately, default is 'group'
            layout: 'single',
            // Specify the height, which can be set as a string, "300px", and the value 300 will be replaced with "300px" automatically
            height: 300,
            // The unit value of the specified width, the total value is 12
            col: 6
        },
        title: {
            text: symbol
        },
        xAxis: {
            type: 'datetime'
        },
        series: [{
            name: 'plus',
            data: []
        }]
    }

    return cfg
}

function main() {
    // Declare arrCfg
    var arrCfg = []                                    // Declare an array to store chart configuration information
    _.each(arrSwapContractType, function(ct) {         // Record the array of perpetual contract codes iteratively, pass the XXX-USDT part of the contract name as a parameter to the createCfg function, construct the chart configuration information, and return
        arrCfg.push(createCfg(formatSymbol(ct)[0]))    // The chart configuration information returned by createCfg is pushed into the arrCfg array
    })
    var objCharts = Chart(arrCfg)                      // Call the chart function Chart of the FMZ platform to create the chart control object objCharts
    objCharts.reset()                                  // Initialize chart content

    // Hereafter omitted ...
}
A continuación, vamos a preparar los datos. Utilizamos la interfaz de mercado agregada del contrato OKEX:
Contratos perpetuos en USDT:
https://www.okex.com/api/v5/market/tickers?instType=SWAP
Contratos de entrega en USDT:
https://www.okex.com/api/v5/market/tickers?instType=FUTURES
Escribimos una función para manejar las llamadas de estas dos interfaces y poner los datos en un formato:
function getTickers(url) {
    var ret = []
    try {
        var arr = JSON.parse(HttpQuery(url)).data
        _.each(arr, function(ele) {
            ret.push({
                bid1: parseFloat(ele.bidPx),             // Price of stock buy order
                bid1Vol: parseFloat(ele.bidSz),          // Amount for the price of stock buy order
                ask1: parseFloat(ele.askPx),             // Price of stock sell order
                ask1Vol: parseFloat(ele.askSz),          // Amount for the price of stock sell order
                symbol: formatSymbol(ele.instId)[0],     // Formats into trading pairs
                type: "Futures",                         // Type
                originalSymbol: ele.instId               // Original contract code
            })
        })
    } catch (e) {
        return null
    }
    return ret
}
Escribir otra función para procesar el código del contrato
function formatSymbol(originalSymbol) {
    var arr = originalSymbol.split("-")
    return [arr[0] + "_" + arr[1], arr[0], arr[1]]
}
Todo lo que queda es emparejar los datos adquiridos iterativamente, calcular los diferenciales, trazar el resultado, etc. La prueba aquí es el diferencial entre el contrato del segundo trimestre 210924 y el contrato perpetuo. Código completo:
// Temporary parameters
var arrSwapContractType = ["BTC-USDT-SWAP", "LTC-USDT-SWAP", "ETH-USDT-SWAP", "ETC-USDT-SWAP"]
var arrDeliveryContractType = ["BTC-USDT-210924", "LTC-USDT-210924", "ETH-USDT-210924", "ETC-USDT-210924"]
var interval = 2000

function createCfg(symbol) {
    var cfg = {
        extension: {
            // No grouping, displayed separately, default is 'group'
            layout: 'single',
            // Specify the height, which can be set as a string, "300px", and the value 300 will be replaced with "300px" automatically
            height: 300,
            // The unit value of the specified width, the total value is 12
            col: 6
        },
        title: {
            text: symbol
        },
        xAxis: {
            type: 'datetime'
        },
        series: [{
            name: 'plus',
            data: []
        }]
    }

    return cfg
}

function formatSymbol(originalSymbol) {
    var arr = originalSymbol.split("-")
    return [arr[0] + "_" + arr[1], arr[0], arr[1]]
}

function getTickers(url) {
    var ret = []
    try {
        var arr = JSON.parse(HttpQuery(url)).data
        _.each(arr, function(ele) {
            ret.push({
                bid1: parseFloat(ele.bidPx),
                bid1Vol: parseFloat(ele.bidSz),
                ask1: parseFloat(ele.askPx),
                ask1Vol: parseFloat(ele.askSz),
                symbol: formatSymbol(ele.instId)[0],
                type: "Futures",
                originalSymbol: ele.instId
            })
        })
    } catch (e) {
        return null
    }
    return ret
}

function main() {
    // Declare arrCfg
    var arrCfg = []
    _.each(arrSwapContractType, function(ct) {
        arrCfg.push(createCfg(formatSymbol(ct)[0]))
    })
    var objCharts = Chart(arrCfg)
    objCharts.reset()

    while (true) {
        // Obtain market data
        var deliveryTickers = getTickers("https://www.okex.com/api/v5/market/tickers?instType=FUTURES")
        var swapTickers = getTickers("https://www.okex.com/api/v5/market/tickers?instType=SWAP")
        if (!deliveryTickers || !swapTickers) {
            Sleep(2000)
            continue
        }

        var tbl = {
            type : "table",
            title : "delivery - perpetual spread",
            cols : ["trading pairs", "delivery", "perpetual", "positive hedging", "negative hedging"],
            rows : []
        }

        var subscribeDeliveryTickers = []
        var subscribeSwapTickers = []
        _.each(deliveryTickers, function(deliveryTicker) {
            _.each(arrDeliveryContractType, function(symbol) {
                if (deliveryTicker.originalSymbol == symbol) {
                    subscribeDeliveryTickers.push(deliveryTicker)
                }
            })
        })
        _.each(swapTickers, function(swapTicker) {
            _.each(arrSwapContractType, function(symbol) {
                if (swapTicker.originalSymbol == symbol) {
                    subscribeSwapTickers.push(swapTicker)
                }
            })
        })

        var pairs = []
        var ts = new Date().getTime()
        _.each(subscribeDeliveryTickers, function(deliveryTicker) {
            _.each(subscribeSwapTickers, function(swapTicker) {
                if (deliveryTicker.symbol == swapTicker.symbol) {
                    var pair = {symbol: swapTicker.symbol, swapTicker: swapTicker, deliveryTicker: deliveryTicker, plusDiff: deliveryTicker.bid1 - swapTicker.ask1, minusDiff: deliveryTicker.ask1 - swapTicker.bid1}
                    pairs.push(pair)
                    tbl.rows.push([pair.symbol, deliveryTicker.originalSymbol, swapTicker.originalSymbol, pair.plusDiff, pair.minusDiff])
                    for (var i = 0 ; i < arrCfg.length ; i++) {
                        if (arrCfg[i].title.text == pair.symbol) {
                            objCharts.add([i, [ts, pair.plusDiff]])
                        }
                    }
                }
            })
        })

        LogStatus(_D(), "\n`" + JSON.stringify(tbl) + "`")
        Sleep(interval)
    }
}
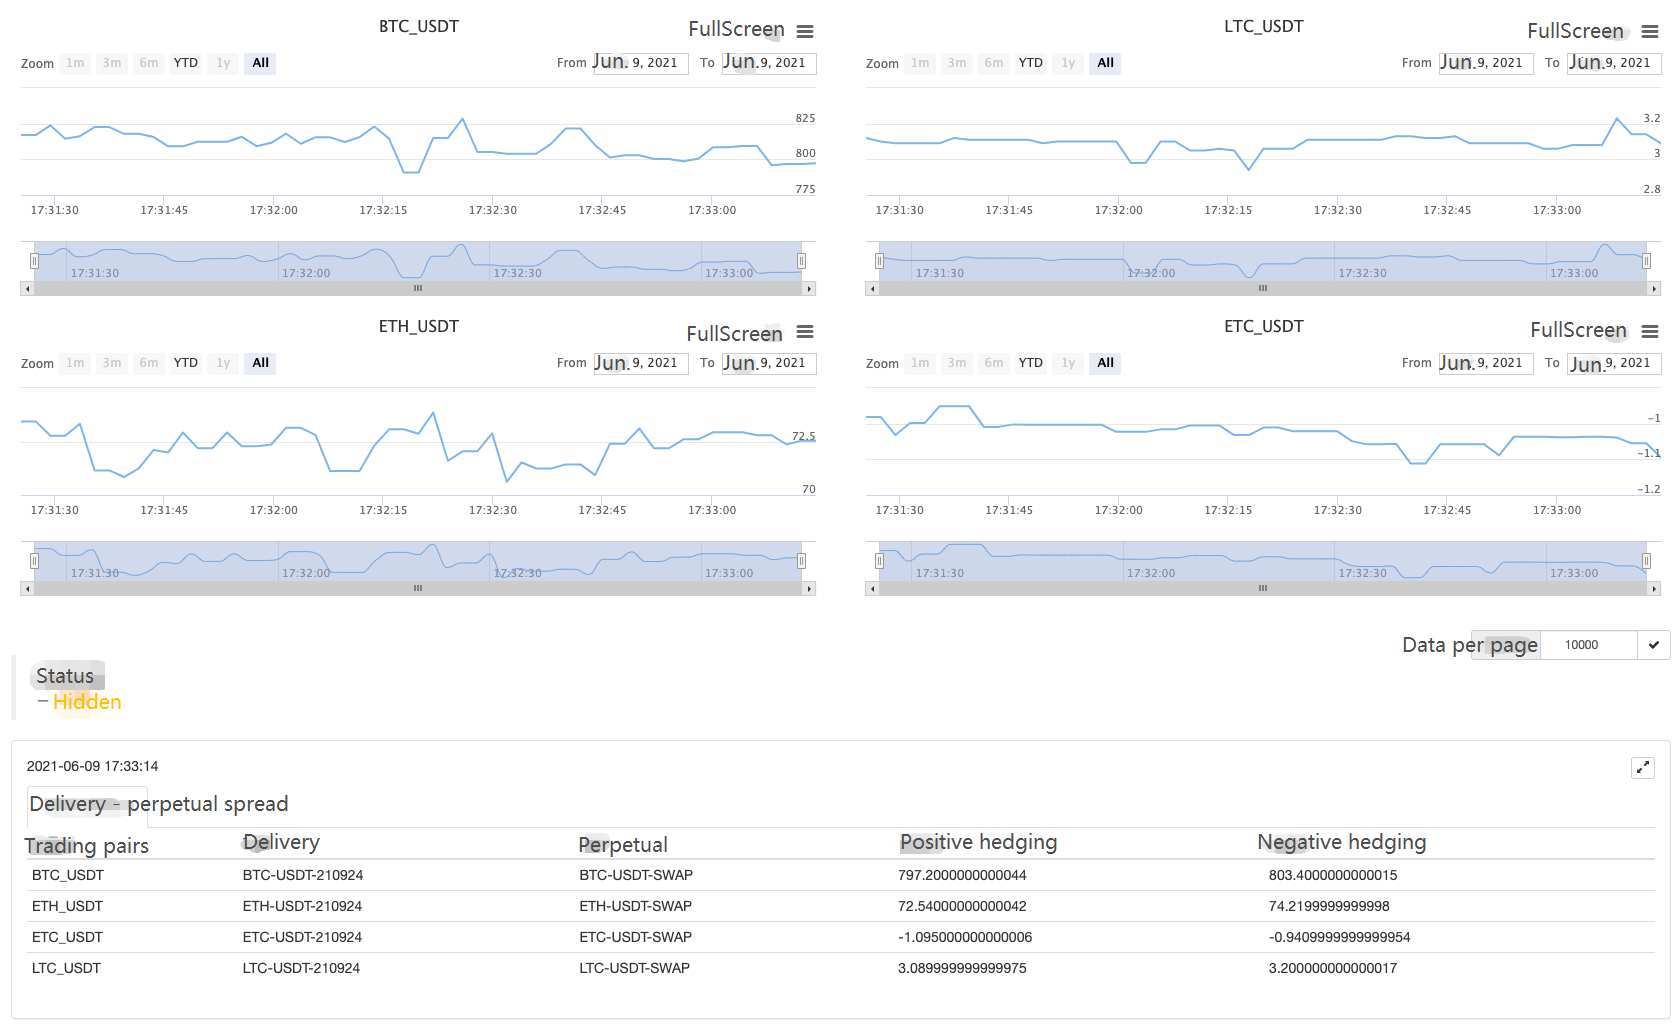
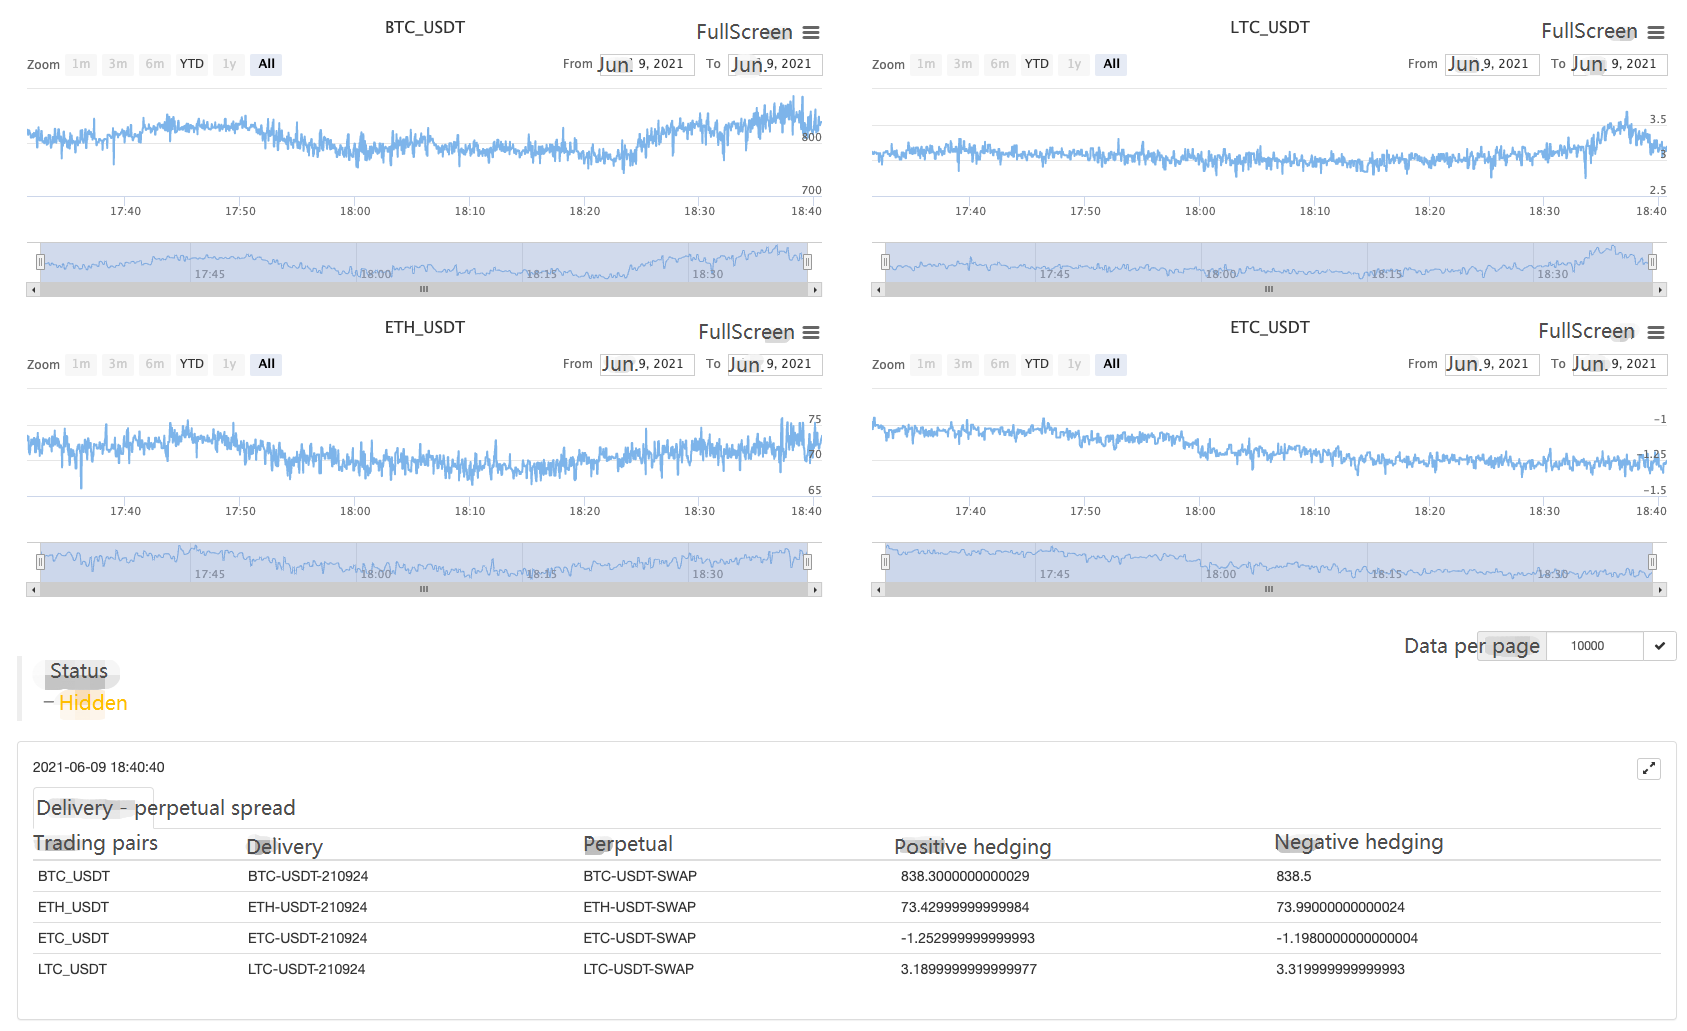
Un bot de verdad corriendo.

Corriendo por un tiempo ~

¡Observa la propagación y luego habla de ello!
- Introducción al arbitraje de lead-lag en criptomonedas (2)
- Introducción al conjunto de Lead-Lag en las monedas digitales (2)
- Discusión sobre la recepción de señales externas de la plataforma FMZ: una solución completa para recibir señales con servicio HTTP incorporado en la estrategia
- Exploración de la recepción de señales externas de la plataforma FMZ: estrategias para una solución completa de recepción de señales de servicios HTTP integrados
- Introducción al arbitraje de lead-lag en criptomonedas (1)
- Introducción al conjunto de Lead-Lag en las monedas digitales (1)
- Discusión sobre la recepción de señales externas de la plataforma FMZ: API extendida VS estrategia Servicio HTTP incorporado
- Exploración de la recepción de señales externas de la plataforma FMZ: API de expansión vs estrategia de servicio HTTP incorporado
- Discusión sobre el método de prueba de estrategias basado en el generador de tickers aleatorios
- Explorar métodos de prueba de estrategias basados en generadores de mercado aleatorios
- Nueva característica de FMZ Quant: Utilice la función _Serve para crear servicios HTTP fácilmente
- Revisión del mercado de divisas digitales en 2021 y la estrategia más simple 10 veces perdida
- Modelo de factor de moneda digital
- La estrategia mágica de doble EMA de la línea uniforme de YouTube
- Escribir una herramienta de transacción semiautomática en el lenguaje Pine
- Modelo de factores de la moneda digital
- Ser su propio salvador en el negocio.
- Estrategia de cobertura de futuros y spot manuales de criptomonedas
- Diseño de una estrategia de cobertura al contado de criptomonedas (1)
- Una estrategia de equilibrio perpetuo adecuada para el mercado bajista
- Comercio cuantitativo de criptomonedas para principiantes - acercándote a la criptomoneda cuantitativa (8)
- Comercio cuantitativo de criptomonedas para principiantes - acercándote a la criptomoneda cuantitativa (6)
- Visión general y arquitectura de la interfaz principal de la plataforma de negociación cuántica FMZ
- Diseño de estrategia de Martingale para futuros de criptomonedas
- Comercio cuantitativo de criptomonedas para principiantes - acercándote a la criptomoneda cuantitativa (5)
- Comercio cuantitativo de criptomonedas para principiantes - acercándote a la criptomoneda cuantitativa (4)
- Comercio cuantitativo de criptomonedas para principiantes - acercándote a la criptomoneda cuantitativa (3)
- Comercio cuantitativo de criptomonedas para principiantes: acercándote a la criptomoneda cuantitativa (2)
- Comercio cuantitativo de criptomonedas para principiantes - acercándote a la criptomoneda cuantitativa (1)
- Diseño de una estrategia de cobertura al contado de criptomonedas (2)
- Ejemplo de contrato de acceso al protocolo general en FMZ