Venta y compra intradiarias
El autor:¿ Qué pasa?, Fecha: 2022-05-25 17:44:23Las etiquetas:Indicador de riesgoLa SMA
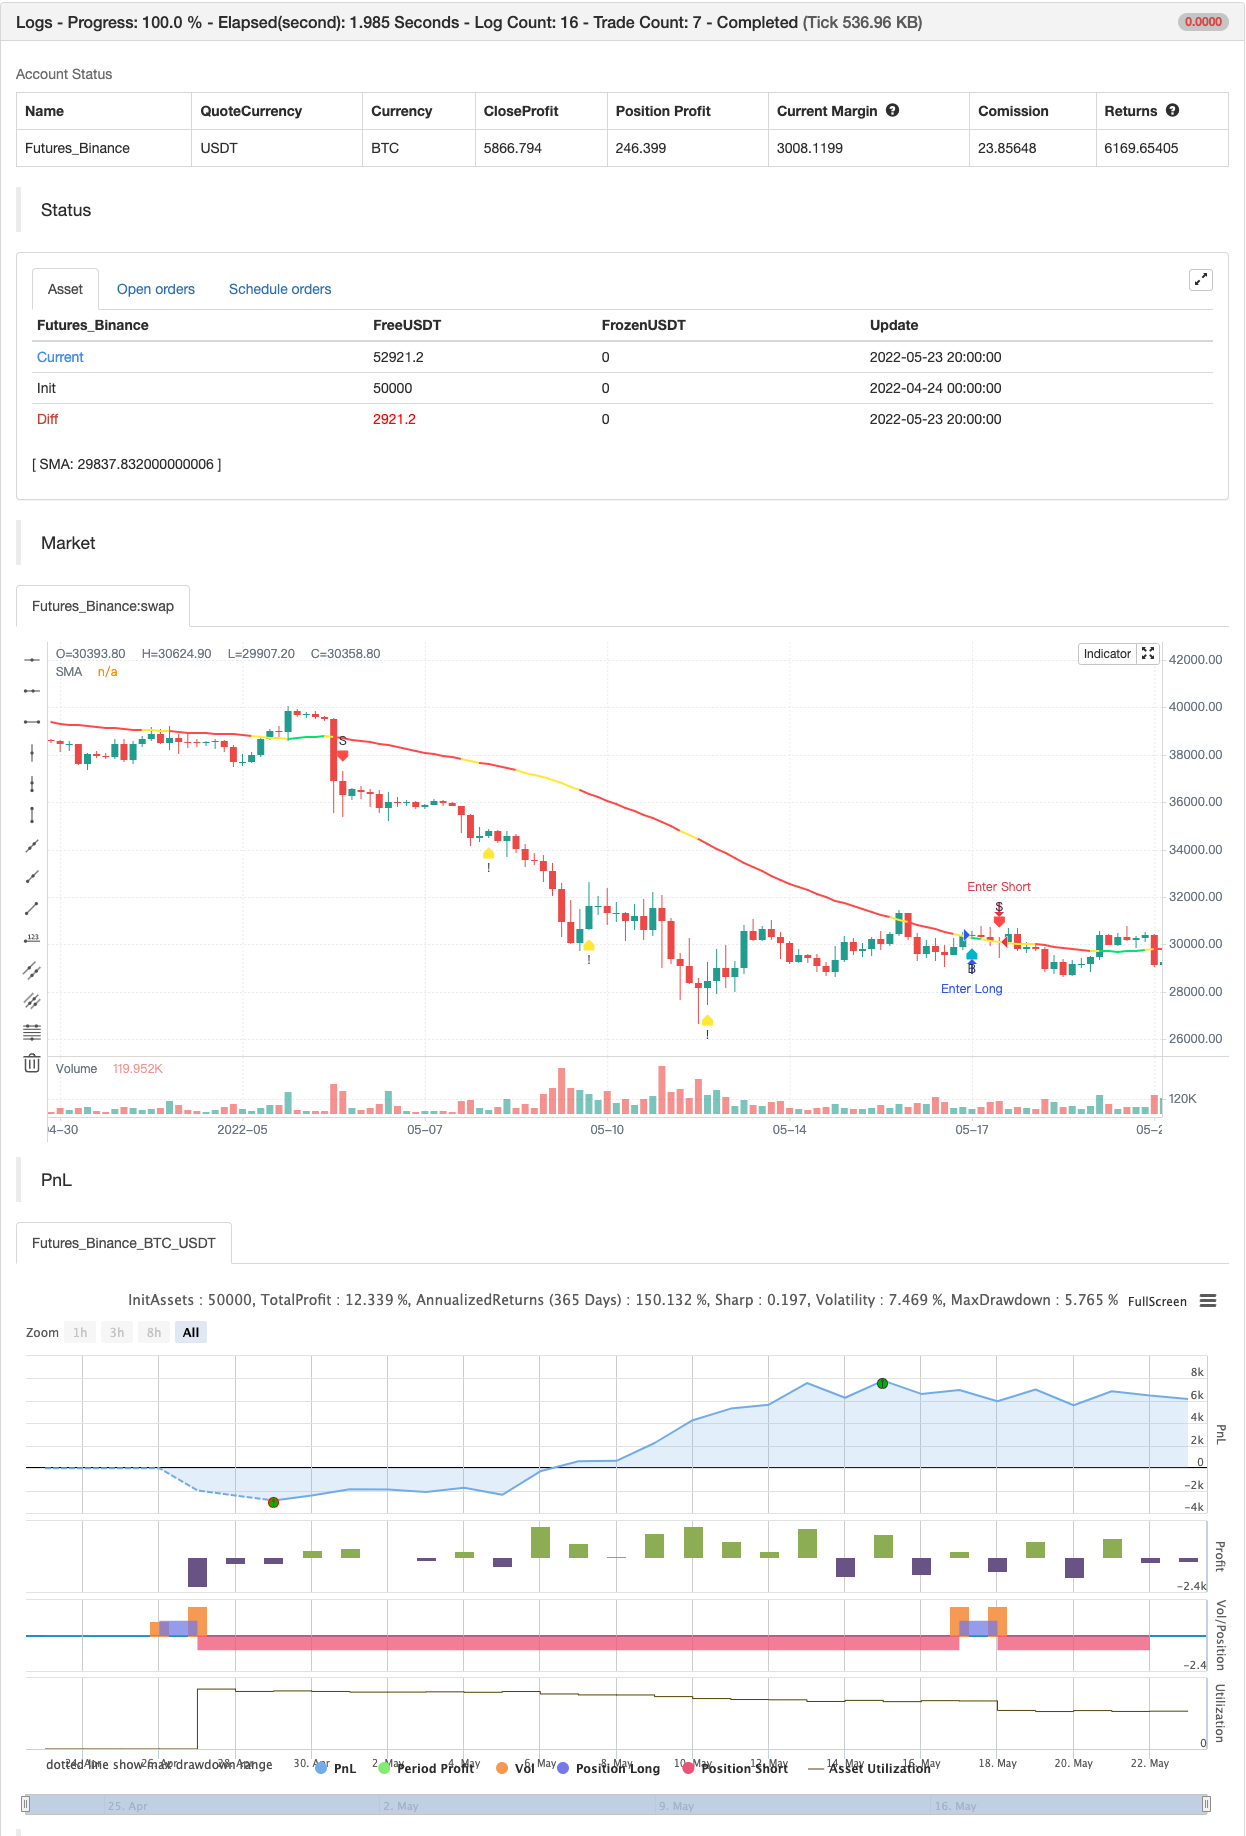
Compra y venta de señales de cuero cabelludo para futuros de petróleo crudo (o se puede utilizar con cualquier escritura con una buena cantidad de volumen) basado en alerta de sobrecompra / sobreventa de Sma & RSI (!) para una posible indicación de reversión.
Tome la posición de compra sólo si la vela rompe el máximo de la vela de alerta y para las posiciones de venta, tome la posición si la vela rompe el mínimo de la vela de alerta.
Lo mejor para realizar con un marco de tiempo de 3 min en los futuros de petróleo crudo
Prueba posterior

/*backtest
start: 2022-04-24 00:00:00
end: 2022-05-23 23:59:00
period: 4h
basePeriod: 15m
exchanges: [{"eid":"Futures_Binance","currency":"BTC_USDT"}]
*/

// This source code is subject to the terms of the Mozilla Public License 2.0 at https://mozilla.org/MPL/2.0/
// © nicks1008

//@version=4
study(title="CRUDE OIL BUY/SELL",shorttitle="CRUDE Scalp |3 Min",precision=2,overlay=true)

Rsi_value=input(14,title="RSI Length",step=1)
hl=input(75,title="Higher Value of RSI",step=1)
ll=input(25,title="Lower value of RSI",step=1)
rs=rsi(close,Rsi_value)

sma_value=input(50,title="SMA Length",step=1)
sma1=sma(close,sma_value)

dist_SMA=1
candle_length=1

mycolor= iff(rs>=hl or rs<=ll,color.yellow,iff(low> sma1,color.lime,iff(high<sma1,color.red,color.yellow)))
gaps=sma1+dist_SMA  //Gap between price and SMA for Sell
gapb=sma1-dist_SMA  //Gap between price and SMA for Buy
chartgap=gaps or gapb  //for both below or above the SMA
gap1=sma1+5
gapvalue=(open/100)*candle_length     //setting % with its Share price
gapp=(high-low)>gapvalue //or rs<50     // Condition for Min candle size to be eligible for giving signal - Buy Calls
gapp2=(high-low)>gapvalue //or rs>55    // Condition for Min candle size to be eligible for giving signal - Sell Calls
bull=open<close and (high-low)>2*gapvalue and close>(high+open)/2
bear=open>close and (high-low)>2*gapvalue and close<(low+open)/2


rev1=rs>68 and open>close and open>gaps and (high-low)>gapvalue+0.5 and low!=close      //over red candles  "S" - uptrend
rev1a=rs>90 and open<close and close>gaps and high!=close and open!=low                             // over green candles"S" - uptrend
sellrev= rev1 or rev1a

rev2=rs<50 and open<close and open<gapb and open==low  //over green candles"B"
rev3=rs<30 and open>close and high>gapb and open!=high and barstate.isconfirmed!=bear  //over red candles"B"
rev4=rs<85 and close==high and (high-low)>gapvalue and open<close    //over green candle in both trends
hlrev_s=crossunder(rs,hl)
llrev_b=crossover(rs,ll) and open<close

buycall=open<close and open>sma1 and cross(close[1],sma1) and close>sma1
sellcall=cross(close,sma1) and open>close
BUY=crossover(close[1],sma1) and close[1]>open[1] and high[0]>high[1] and close[0]>open[0]
SELL=crossunder(low[1],sma1) and close[1]<open[1] and low[0]<low[1] and close[0]<open[0]

plotshape(SELL,title="SELL",style=shape.labeldown,color=color.red,text="S",textcolor=color.black,transp=30)
plotshape(BUY,title="BUY",style=shape.labelup,color=color.aqua,text="B",textcolor=color.black,transp=30,location=location.belowbar)

plotshape(hlrev_s,title="Reversal1",style=shape.labeldown,color=color.yellow,text="!",textcolor=color.black,transp=20)
plotshape(llrev_b,title="Reversal2",style=shape.labelup,color=color.yellow,text="!",textcolor=color.black,transp=20,location=location.belowbar)

plot(sma1,title="SMA",color=mycolor,linewidth=2)
alertcondition(hlrev_s or llrev_b,title="Reversal Signal", message="Reversal Alert")
alertcondition(SELL or BUY,title="Buy/Sale Signal", message="Buy/Sell Alert")

if BUY
    strategy.entry("Enter Long", strategy.long)
else if SELL
    strategy.entry("Enter Short", strategy.short)
Contenido relacionado
- Seguimiento de tendencias y estrategias de respuesta de gráficos de doble línea uniforme para detener pérdidas dinámicas.
- Estrategia de regreso de la media del índice de la fortaleza y de la debilidad
- La estrategia de cruce de SMA combinada con el filtro y la alerta del RSI
- Brin con estrategias de negociación cuantitativas de mercado neutro RSI
- Triple estrategia de intercambio de índices cuantificados
- RSI estrategia de trading de movimiento de tendencia combinada con doble media y confirmación de transacciones
- Las redes dinámicas de RSI siguen las tendencias de las estrategias de negociación
- RSI2 estrategia de retrospección de la tasa de reversión de ganancias en el día
- La estrategia de negociación con el RSI de Brin
- Estrategias de seguimiento de tendencias de movimiento multilineal
Más contenido
- Super Tendencia Diaria 2.0 BF
- Hull Moving Average Swing Trader (Tradador de movimiento de la media del casco)
- FTSMA - Tendencia es su amigo
- Filtro de rango Comprar y vender
- Canal SSL
- Estrategia de la suite del casco
- Parabólico SAR Comprar y vender
- El valor de las emisiones de gases de efecto invernadero es el valor de las emisiones de gases de efecto invernadero.
- Nick Rypock trasero hacia atrás (NRTR)
- ZigZag PA estrategia V4.1
- Fractal roto: el sueño roto de alguien es su beneficio!
- Maximizador de ganancias PMax
- Una estrategia de victoria impecable
- Estocástico + RSI, doble estrategia
- Estrategia Swing Hull/rsi/EMA
- Instrumento de negociación de movimiento de cuero cabelludo R1-4
- La mejor estrategia de ingestión + escape
- Bollinger Awesome Alerta R1 en el momento en el que se produce el cambio
- Plugins para intercambio simultáneo
- Triángulo de interés (para obtener el precio de mercado de las monedas pequeñas)