资源加载中... loading...

Bollinger Bands RSI Neutral Market Quantitative Trading Strategy

Author: ChaoZhang, Date: 2024-07-30 15:47:49
Tags: RSISMA

img

Overview

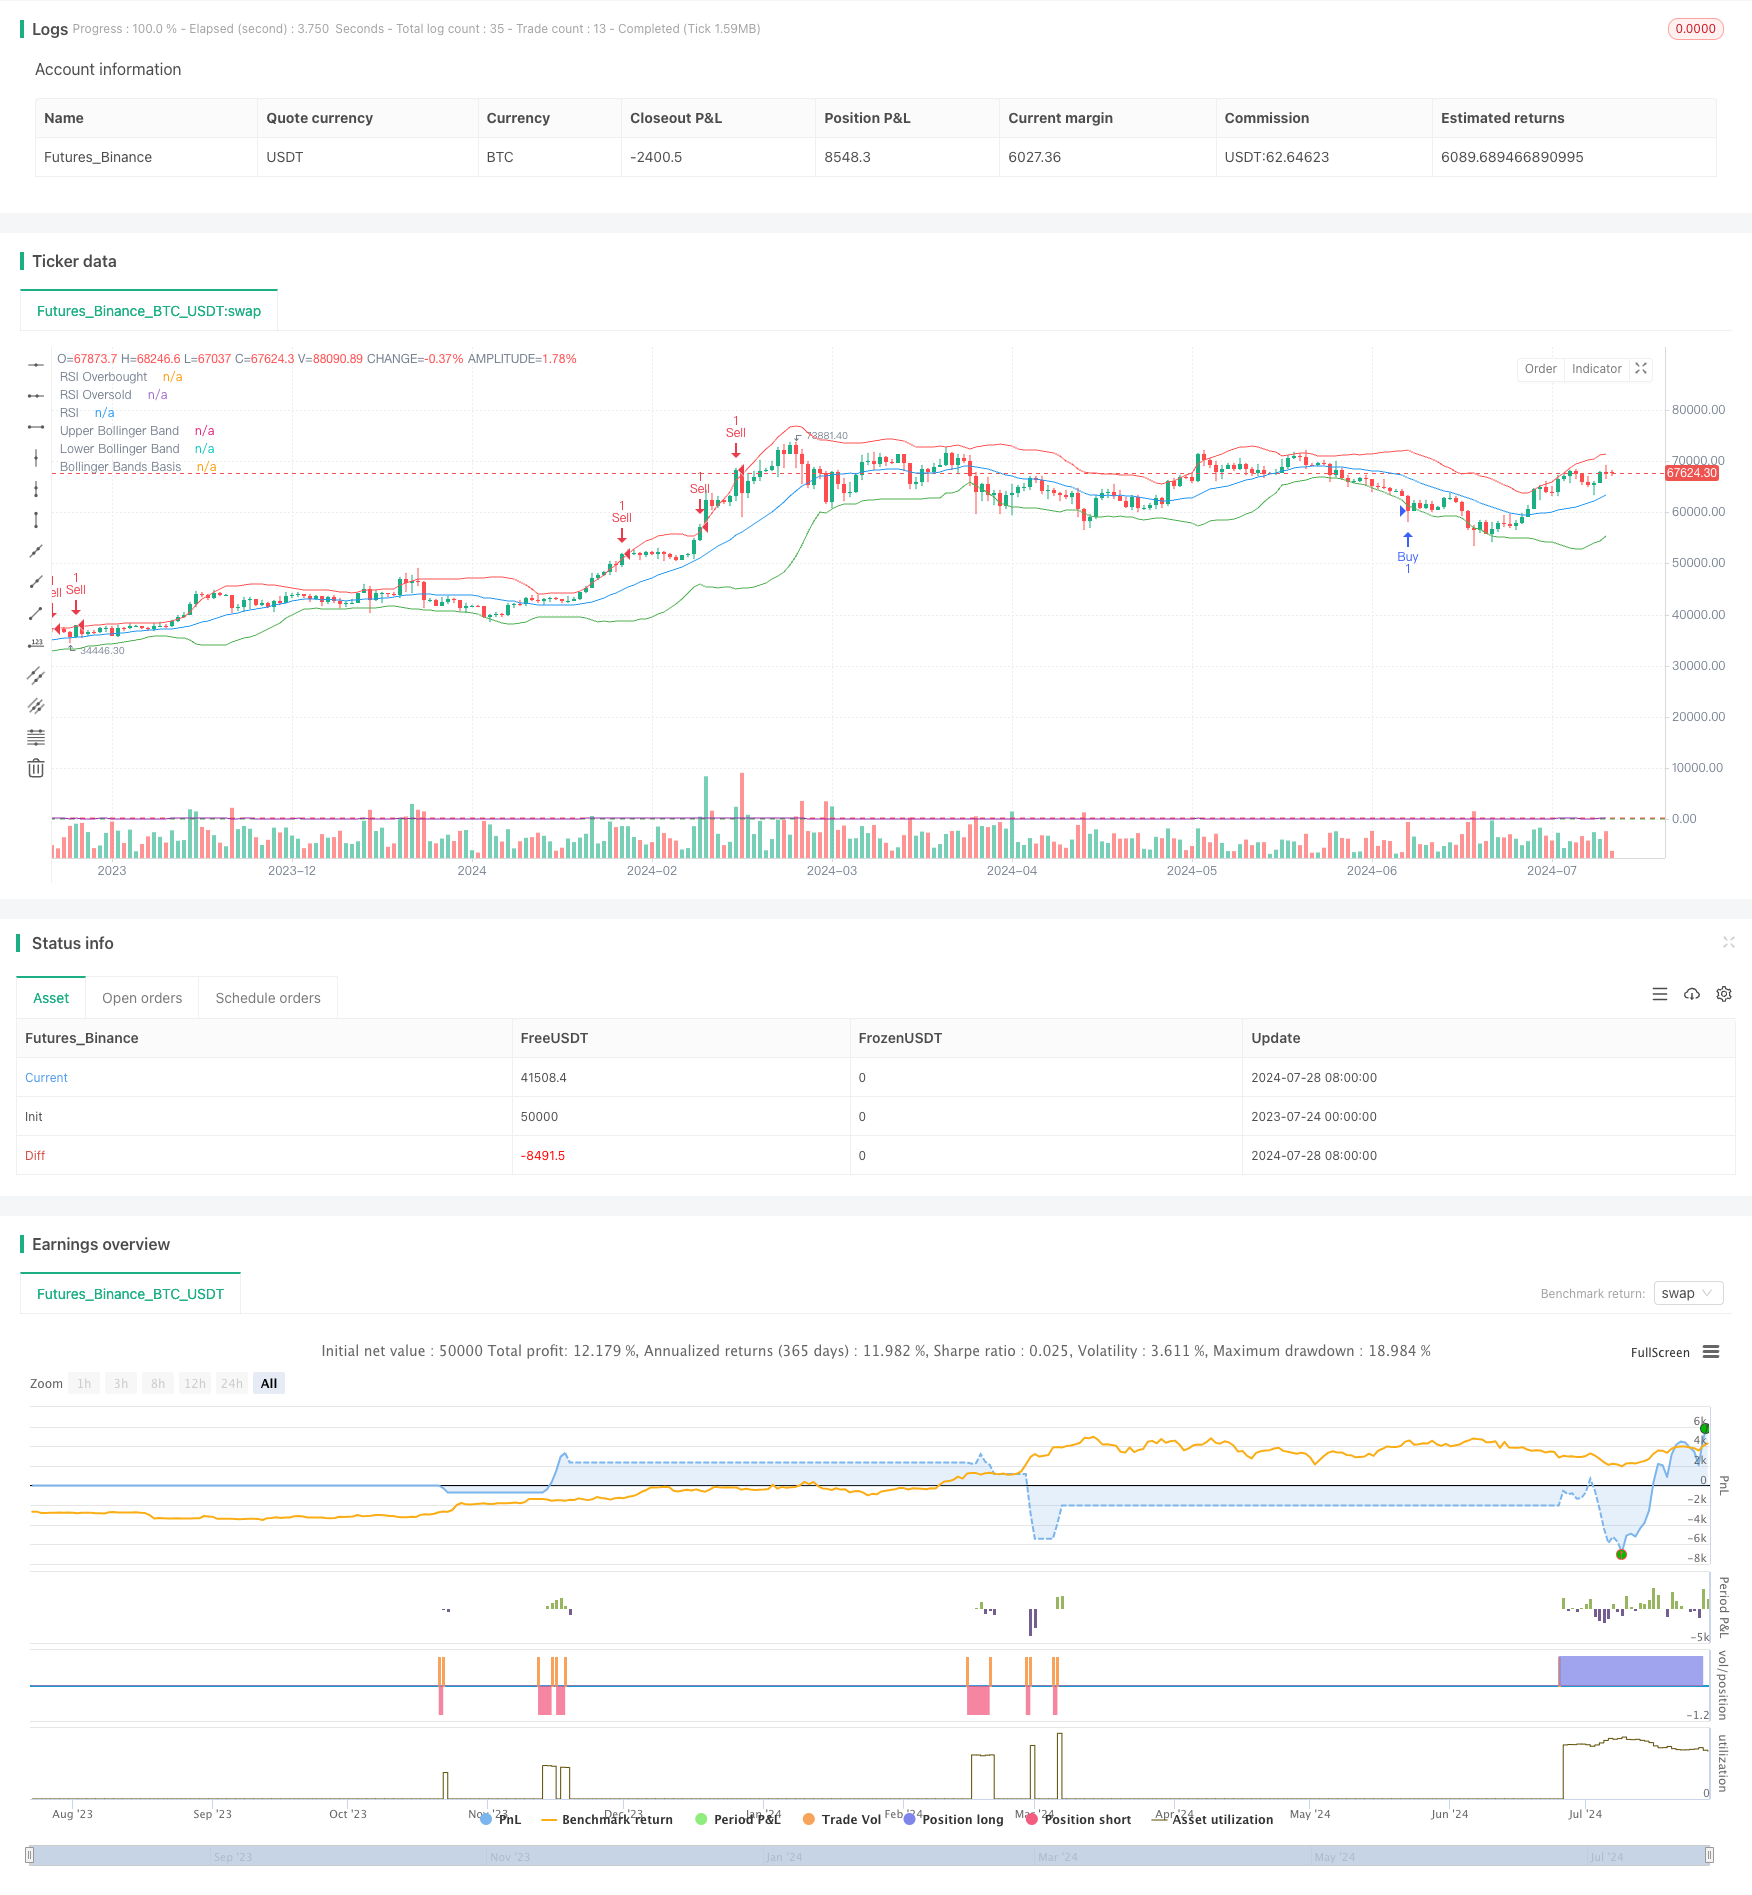
This article introduces a neutral market quantitative trading strategy based on Bollinger Bands and the Relative Strength Index (RSI). The strategy aims to identify potential overbought and oversold opportunities by combining price volatility and momentum indicators, allowing for trading in markets maintaining a neutral trend. The core idea is to buy when the price touches the lower Bollinger Band and the RSI is in the oversold zone, and to sell when the price touches the upper Bollinger Band and the RSI is in the overbought zone. By combining these two technical indicators, the strategy attempts to capture short-term reversal opportunities amidst market fluctuations while managing risk through the implementation of stop-loss and take-profit mechanisms.

Strategy Principle

The core principles of this strategy are based on the following key components:

  1. Bollinger Bands:

    • Uses a 20-period Simple Moving Average (SMA) as the middle band.
    • Upper and lower bands are set at 2 standard deviations above and below the middle band.
    • Bollinger Bands are used to measure the price position relative to its recent volatility range.
  2. Relative Strength Index (RSI):

    • Uses a 14-period RSI.
    • Sets 70 as the overbought threshold and 30 as the oversold threshold.
    • RSI is used to measure price momentum and potential overbought/oversold conditions.
  3. Trading Signals:

    • Buy signal: Price crosses below the lower Bollinger Band and RSI is below 30.
    • Sell signal: Price crosses above the upper Bollinger Band and RSI is above 70.
  4. Risk Management:

    • Uses percentage-based stop-loss (default 2%) and take-profit (default 4%) to manage risk and reward for each trade.

The strategy’s logic is that when the price touches the lower Bollinger Band, it typically indicates that the price is at a low point relative to its recent range, while an RSI below 30 further confirms an oversold condition. In this situation, the price often tends to rebound. Conversely, when the price touches the upper Bollinger Band and the RSI is above 70, it suggests that the price may be overvalued and likely to fall.

Strategy Advantages

  1. Multi-indicator Synergy: Combining Bollinger Bands and RSI can provide more reliable trading signals, reducing the risk of false breakouts.

  2. Adapts to Market Volatility: Bollinger Bands automatically adjust their width based on market volatility, allowing the strategy to adapt to different market environments.

  3. Integrated Risk Management: Built-in stop-loss and take-profit mechanisms help control the risk of each trade, protecting capital safety.

  4. Suitable for Neutral Markets: This strategy is particularly suitable for sideways or trendless market environments, capturing short-term price fluctuations.

  5. High Objectivity: Based on clear technical indicators and mathematical calculations, reducing bias from subjective judgments.

  6. Easy to Automate: The strategy logic is clear, facilitating programming implementation and backtesting optimization.

Strategy Risks

  1. False Breakout Risk: In highly volatile markets, frequent false breakouts may occur, leading to excessive trading and fee losses.

  2. Underperformance in Trending Markets: In strong unidirectional trend markets, the strategy may frequently hit stop-losses, missing out on major trends.

  3. Parameter Sensitivity: The parameter settings for Bollinger Bands and RSI significantly impact strategy performance, potentially requiring different settings for different markets.

  4. Slippage and Liquidity Risk: In less liquid markets, actual execution prices may deviate significantly from signal prices.

  5. Overtrading Risk: In highly volatile markets, too many trading signals may be generated, increasing trading costs.

  6. Systematic Risk: Relying solely on technical indicators may ignore fundamental factors, potentially leading to losses during major events.

Strategy Optimization Directions

  1. Dynamic Parameter Adjustment: Consider dynamically adjusting Bollinger Bands and RSI parameters based on market volatility to adapt to different market environments.

  2. Additional Filtering Conditions: Introduce extra technical indicators or market sentiment indicators, such as volume or volatility indicators, to improve signal reliability.

  3. Timeframe Optimization: Experiment with applying the strategy on different timeframes to find the optimal trading cycle.

  4. Stop-Loss and Take-Profit Optimization: Consider using dynamic stop-loss and take-profit levels, such as trailing stops or ATR-based stops, to better adapt to market volatility.

  5. Trend Filtering: Introduce long-term trend indicators, like long-period moving averages, to reduce counter-trend trades in strong trending markets.

  6. Enhanced Risk Management: Implement daily or weekly maximum loss limits to prevent significant capital drawdowns due to consecutive losses.

  7. Market State Classification: Develop a market state classification model to use different strategy parameters or trading logic under various market conditions (e.g., trending, ranging, high volatility).

  8. Machine Learning Optimization: Utilize machine learning algorithms to analyze historical data, automatically optimize strategy parameters, or generate new trading rules.

Conclusion

The Bollinger Bands RSI Neutral Market Quantitative Trading Strategy is a neutral market trading approach that combines price volatility and momentum indicators. By leveraging the price channel of Bollinger Bands and momentum information from RSI, this strategy aims to capture short-term market reversal opportunities. Its strengths lie in multi-indicator synergy, adaptation to market volatility, integrated risk management, and strong objectivity, making it particularly suitable for application in range-bound markets. However, the strategy also faces risks such as false breakouts, underperformance in trending markets, and parameter sensitivity.

To further enhance the strategy’s robustness and profitability, considerations can be made in areas such as dynamic parameter adjustment, additional filtering conditions, timeframe optimization, stop-loss and take-profit optimization, and trend filtering. Additionally, incorporating machine learning techniques and market state classification models may bring about more significant breakthroughs.

Overall, this is a promising neutral market trading strategy that, through continuous optimization and risk management, has the potential to achieve stable performance across various market environments. However, investors should remain cautious when using this strategy, fully understand its limitations, and make appropriate adjustments and applications in conjunction with their own risk tolerance and investment objectives.


/*backtest
start: 2023-07-24 00:00:00
end: 2024-07-29 00:00:00
period: 1d
basePeriod: 1h
exchanges: [{"eid":"Futures_Binance","currency":"BTC_USDT"}]
*/

//@version=5
strategy("Neutral Market Strategy with Bollinger Bands and RSI", overlay=true)

// Input Parameters
bbLength = input.int(20, title="Bollinger Bands Length")
bbMultiplier = input.float(2.0, title="Bollinger Bands Multiplier")
rsiLength = input.int(14, title="RSI Length")
rsiOverbought = input.int(70, title="RSI Overbought Level")
rsiOversold = input.int(30, title="RSI Oversold Level")

// Calculate Bollinger Bands
basis = ta.sma(close, bbLength)
dev = bbMultiplier * ta.stdev(close, bbLength)
upperBB = basis + dev
lowerBB = basis - dev

// Calculate RSI
rsi = ta.rsi(close, rsiLength)

// Plot Bollinger Bands
plot(upperBB, title="Upper Bollinger Band", color=color.red)
plot(lowerBB, title="Lower Bollinger Band", color=color.green)
plot(basis, title="Bollinger Bands Basis", color=color.blue)

// Plot RSI
hline(rsiOverbought, "RSI Overbought", color=color.red)
hline(rsiOversold, "RSI Oversold", color=color.green)
plot(rsi, title="RSI", color=color.purple)

// Define Conditions
buyCondition = ta.crossunder(close, lowerBB) and rsi < rsiOversold
sellCondition = ta.crossover(close, upperBB) and rsi > rsiOverbought

// Entry and Exit Signals
if (buyCondition)
    strategy.entry("Buy", strategy.long)

if (sellCondition)
    strategy.entry("Sell", strategy.short)

// Strategy Settings
stopLoss = input.float(2, title="Stop Loss (%)", step=0.1) / 100
takeProfit = input.float(4, title="Take Profit (%)", step=0.1) / 100

// Apply Stop Loss and Take Profit
strategy.exit("Take Profit/Stop Loss", from_entry="Buy", limit=close * (1 + takeProfit), stop=close * (1 - stopLoss))
strategy.exit("Take Profit/Stop Loss", from_entry="Sell", limit=close * (1 - takeProfit), stop=close * (1 + stopLoss))


Related

More