概述
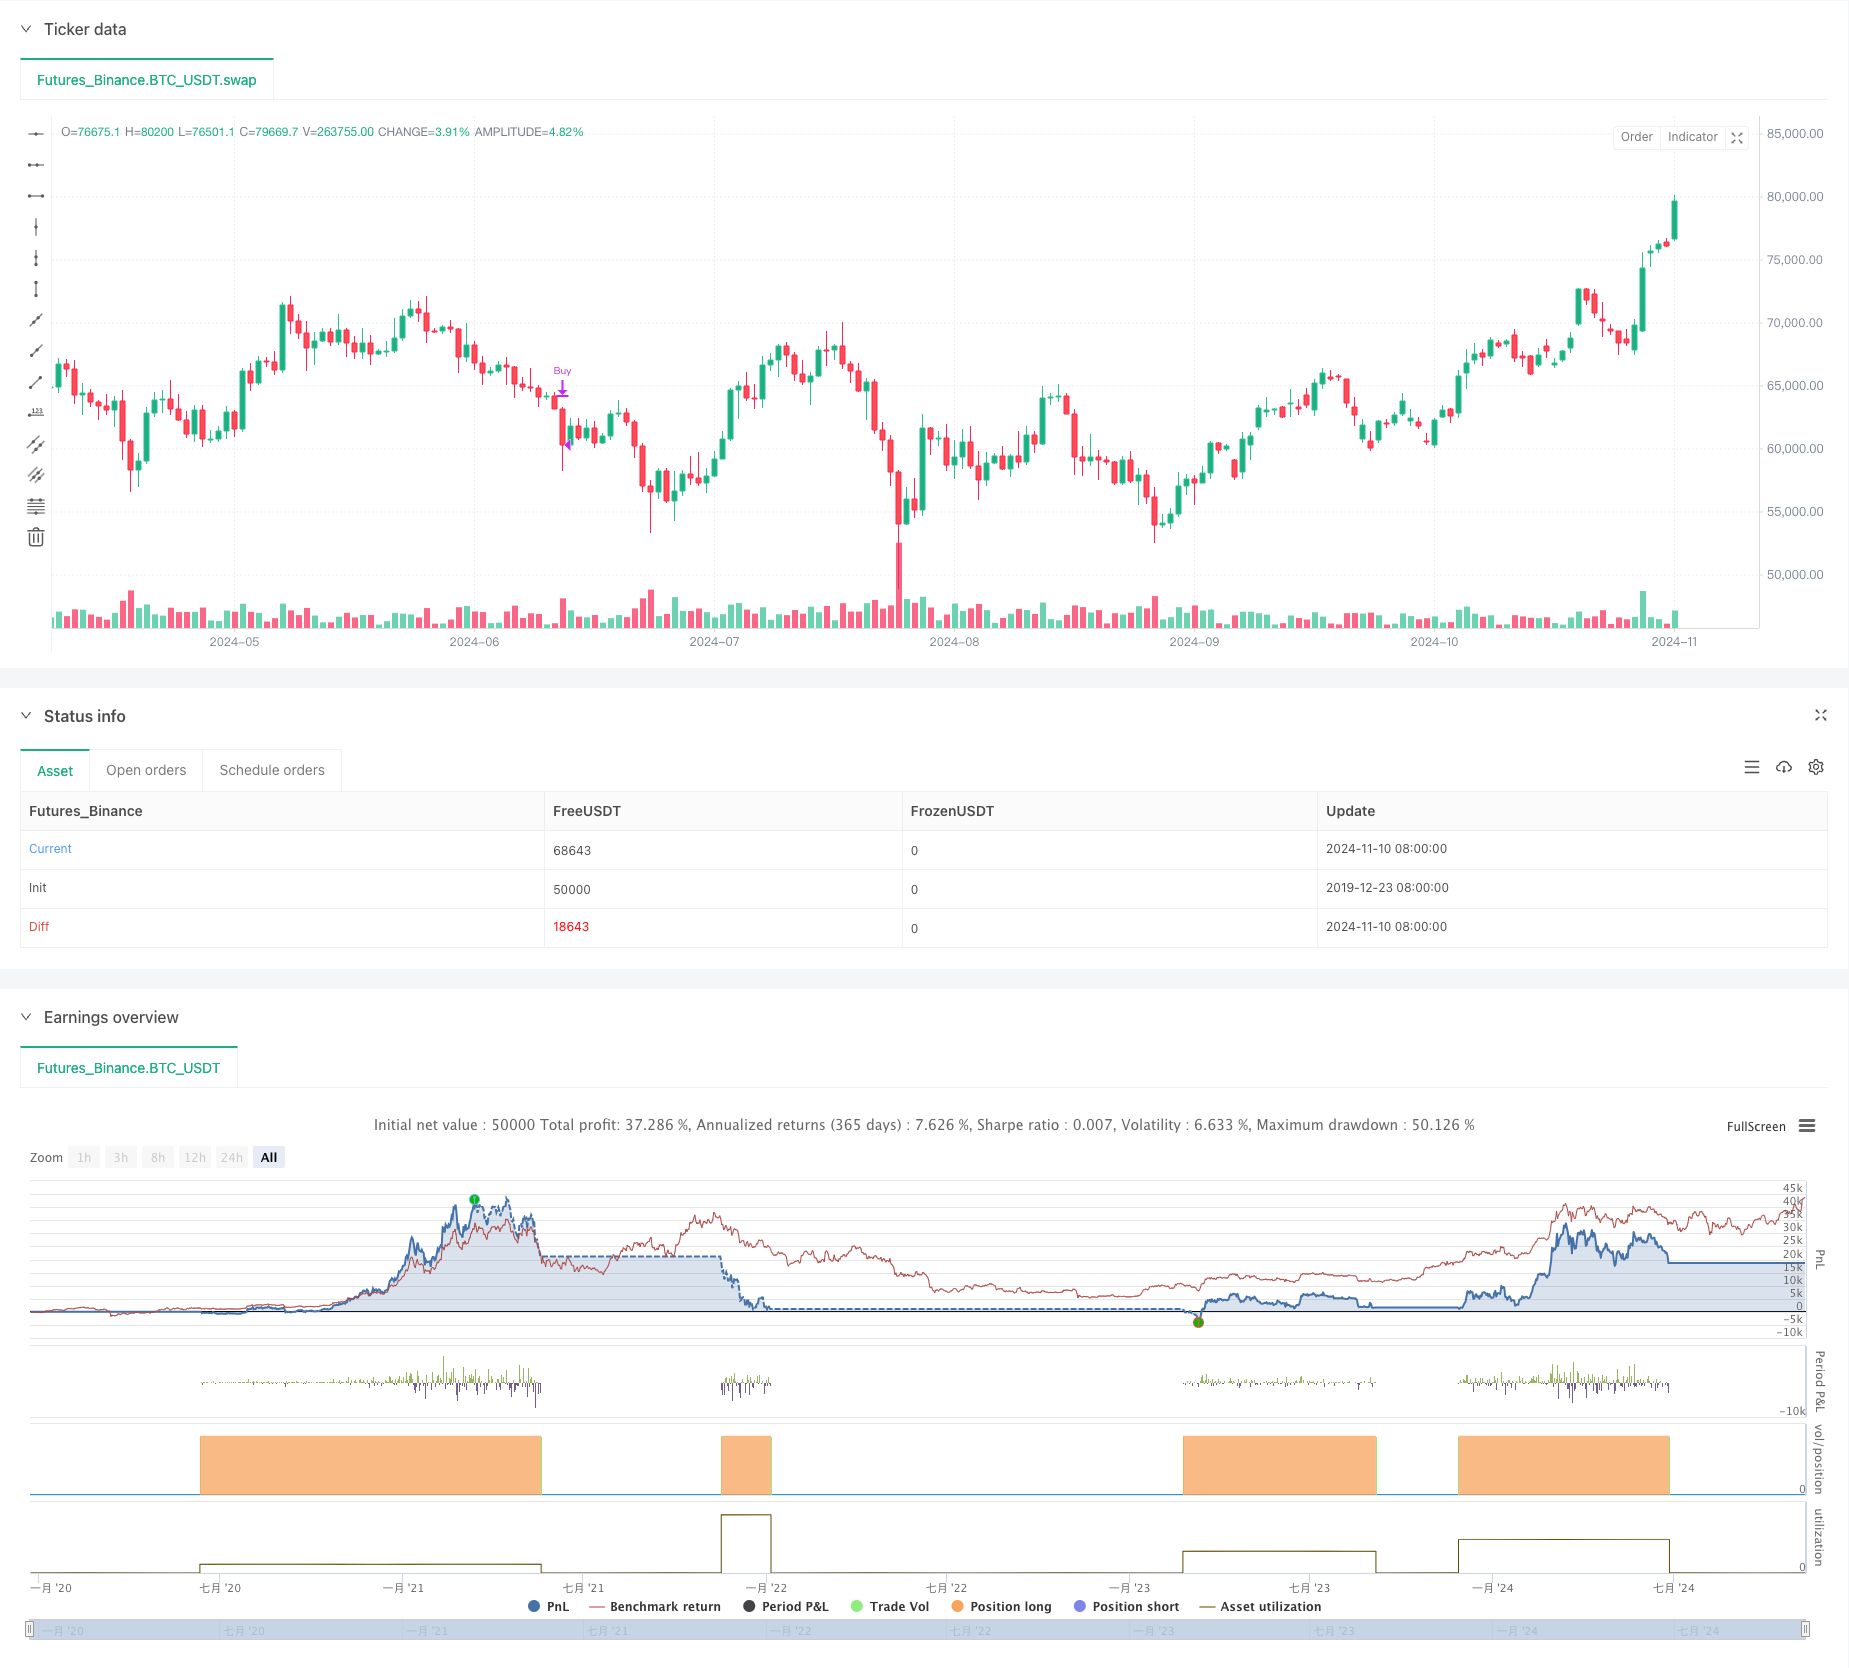
该策略是一个基于多重均线和动量指标的趋势跟踪交易系统。策略主要利用20日、50日、150日和200日简单移动平均线(SMA)的动态关系,结合成交量和RSI指标,在日线级别上捕捉强劲的上升趋势,并在趋势转弱时及时平仓。该策略通过多重技术指标的配合使用,有效地过滤了虚假信号,提高了交易的准确性。
策略原理
策略的核心逻辑包含以下几个关键部分: 1. 均线系统:使用20/50/150/200日均线构建趋势判断体系,要求多均线呈现多头排列。 2. 动量确认:使用RSI指标和其移动平均线判断价格动量,要求RSI大于55或RSI SMA大于50且RSI向上。 3. 成交量验证:通过20日成交量均线和近期成交量比较,确认买卖信号的有效性。 4. 趋势持续性验证:检查50日均线在过去40个交易日中至少25天保持上升趋势。 5. 位置确认:价格需要站稳150日均线上方至少20个交易日。
买入条件要求满足: - 近10天中超过4天为阳线且至少1天放量 - RSI指标满足动量条件 - 均线系统呈现多头排列且持续上升 - 价格稳定运行在150日均线之上
卖出条件包含: - 价格跌破150日均线 - 出现连续的放量下跌 - 50日均线跌破150日均线 - 近期以阴线为主且成交量放大
策略优势
- 多重技术指标交叉验证,有效降低误判率
- 趋势持续性要求严格,能够过滤短期波动
- 结合成交量分析,提高信号可靠性
- 清晰的止损止盈条件,有效控制风险
- 适合捕捉中长期趋势,减少交易频率
- 策略逻辑清晰,易于理解和执行
策略风险
- 均线系统具有滞后性,可能错过趋势初期阶段
- 严格的进场条件可能导致错过部分交易机会
- 在震荡市场中可能产生频繁的假信号
- 对行情反转的识别存在一定延迟
- 需要较大的资金规模来承受回撤
风险控制建议: - 设置合理的止损位置 - 资金管理要适度保守 - 考虑增加趋势确认指标 - 根据市场环境调整参数
策略优化方向
- 增加自适应参数
- 根据市场波动率动态调整均线周期
- 优化RSI阈值设置
- 完善止损机制
- 增加追踪止损
- 设置时间止损
- 引入市场环境分析
- 增加趋势强度指标
- 考虑波动率指标
- 优化交易规模
- 设计动态仓位管理
- 根据信号强度调整
总结
这是一个设计严谨的趋势跟踪策略,通过多重技术指标的配合使用,能够有效捕捉强劲的趋势性机会。策略的主要优势在于其完备的信号确认机制和严格的风险控制体系。虽然存在一定的滞后性,但通过合理的参数优化和风险管理,该策略能够在长期运行中保持稳定的表现。建议投资者在实盘应用时,注意市场环境的适配性,合理控制仓位,并根据实际情况进行针对性优化。
/*backtest
start: 2019-12-23 08:00:00
end: 2024-11-11 00:00:00
period: 1d
basePeriod: 1d
exchanges: [{"eid":"Futures_Binance","currency":"BTC_USDT"}]
*/

//@version=5
strategy("Micho's 150 (1D Time Frame Only)", overlay=true)

// Define the length for the SMAs and RSI
sma20Length = 20
sma50Length = 50
sma150Length = 150
sma200Length = 200
volumeMaLength = 20
rsiLength = 14
rsiSmaLength = 14
smaCheckLength = 40  // Check the last month of trading days (~20 days)
requiredRisingDays = 25  // Require SMA to rise in at least 16 of the past 20 days
sma150AboveSma200CheckDays = 1  // Require SMA150 > SMA200 for the last 10 days

// Calculate the SMAs for price
sma20 = ta.sma(close, sma20Length)
sma50 = ta.sma(close, sma50Length)
sma150 = ta.sma(close, sma150Length)
sma200 = ta.sma(close, sma200Length)

// Calculate the 20-period moving average of volume
volumeMA20 = ta.sma(volume, volumeMaLength)

// Calculate the 14-period RSI
rsi = ta.rsi(close, rsiLength)

// Calculate the 14-period SMA of RSI
rsiSMA = ta.sma(rsi, rsiSmaLength)

// Check if most of the last 5 days are buyer days (close > open)
buyerDays = 0
for i = 0 to 9
    if close[i] > open[i]
        buyerDays := buyerDays + 1

// Check if at least 1 day has volume higher than the 20-period volume MA
highVolumeDays = 0
for i = 0 to 9
    if close[i] > open[i] and volume[i] > volumeMA20
        highVolumeDays := highVolumeDays + 1

// Define the new RSI condition
rsiCondition = (rsi >= 55) or (rsiSMA > 50 and rsi > rsi[1])

// Check if the 50-day SMA has been rising on at least 16 of the last 20 trading days
risingDays = 0
for i = 1 to smaCheckLength
    if sma50[i] > sma50[i + 1]
        risingDays := risingDays + 1

// Check if the SMA has risen on at least 16 of the last 20 days
sma50Rising = risingDays >= requiredRisingDays

// Check if the price has been above the SMA150 for the last 20 trading days
priceAboveSma150 = true
for i = 1 to smaCheckLength
    if close[i] < sma150[i]
        priceAboveSma150 := false

// Check if the SMA150 has been above the SMA200 for the last 10 days
sma150AboveSma200 = true
for i = 1 to sma150AboveSma200CheckDays
    if sma150[i] < sma200[i]
        sma150AboveSma200 := false

// Define the conditions for the 150-day and 200-day SMAs being rising
sma150Rising = sma150 > sma150[1]
sma200Rising = sma200 > sma200[1]

// Check if most of the last 5 days are seller days (close < open)
sellerDays = 0
for i = 0 to 9
    if close[i] < open[i]
        sellerDays := sellerDays + 1

// Check if at least 1 day has seller volume higher than the 20-period volume MA
highSellerVolumeDays = 0
for i = 0 to 9
    if close[i] < open[i] and volume[i] > volumeMA20
        highSellerVolumeDays := highSellerVolumeDays + 1

// Check in the last N days the price below 150
priceBelowSma150 = true
for i = 0 to 0
    if close[i] > sma150[i]
        priceBelowSma150 := false

// Restrict the strategy to 1D time frame
if timeframe.isdaily
    // Buy condition:
    // - Most of the last 5 days are buyer days (buyerDays > 2)
    // - At least 1 of those days has high buyer volume (highVolumeDays >= 1)
    // - RSI SMA (14-period) between 45 and 50 with RSI >= 55, or RSI SMA > 50 and RSI rising
    // - 50-day SMA > 150-day SMA and 150-day SMA > 200-day SMA
    // - 50-day SMA has been rising on at least 16 of the last 20 trading days
    // - The price hasn't been below the 150-day SMA in the last 20 days
    // - 150-day SMA has been above the 200-day SMA for the last 10 days
    // - 150-day and 200-day SMAs are rising
    buyCondition = (close > sma150 and buyerDays > 4 and highVolumeDays >= 1 and rsiCondition  and sma50 > sma150 and sma50Rising and sma150Rising and sma200Rising and priceAboveSma150)

    // Sell condition:
    // - Price crossing below SMA 150
    // - Seller volume (current volume > volume MA 20)
    // - 150-day SMA crosses below 200-day SMA
    // - Most of the last 5 days are seller days (sellerDays > 2) and at least 1 day of higher seller volume (highSellerVolumeDays >= 1)
    sellCondition = (priceBelowSma150 and (sma50 < sma150 or (sellerDays >5 and highSellerVolumeDays >= 5)))

    // Execute buy when all conditions are met
    if (buyCondition)
        strategy.entry("Buy", strategy.long)

    // Execute sell when all conditions are met
    if (sellCondition)
        strategy.close("Buy")