Combinación de estrategias multifactoriales
Este es un artículo detallado de análisis de estrategias basado en el código de estrategias de trading que me proporcionaste:
Descripción general
La estrategia consiste en una combinación de varios factores, con el objetivo de aprovechar las ventajas de los diferentes factores para construir una estrategia de negociación integral. La principal combinación de los siguientes factores:
- Stoch.RSI - índice aleatorio de las medias móviles
- RSI - Indicador de la fuerza y debilidad relativa
- Estrategia Doble - Estrategia doble para el indicador aleatorio y el RSI
- CM Williams Vix Fix - Corrección de la volatilidad de Williams para buscar el fondo del mercado
- DMI - Indicador de tendencias
Al combinar varios factores, se puede aprovechar las ventajas de cada uno, obtener más oportunidades de negociación y reducir el riesgo de depender de un solo factor.
Principio de estrategia
La estrategia se basa en los siguientes indicadores técnicos:
Stoch.RSI- El indicador RSI aleatorio, que combina las ventajas del RSI y el indicador aleatorio. Utiliza el valor del RSI como la entrada del indicador aleatorio para determinar si el mercado está sobrecomprado o sobrevendido. Cuando la línea %K cruza la línea %D desde la zona de sobrecompra, hace más; cuando la línea %K cruza la línea %D desde la zona de sobreventa, hace vacío.
RSI- Un índice de fuerza relativa, que determina el estado de sobrecompra y sobreventa en el mercado. El RSI mayor a 70 es la zona de sobrecompra y menor a 30 es la zona de sobreventa. El RSI oscila entre 30 y 70, lo que representa que el mercado está en un estado de ordenamiento horizontal.
Double Strategy- Una doble estrategia combinada con el uso de indicadores aleatorios y el RSI. Cuando la línea del indicador aleatorio%K cruza la línea del%D desde la zona de sobreventa y el RSI cruza la zona de sobreventa, haga más; cuando la línea del indicador aleatorio%K cruza la línea del%D desde la zona de sobreventa y el RSI cruza la zona de sobreventa, haga hueco.
CM Williams Vix Fix- El índice de reparación de la volatilidad de Williams, que determina si el mercado está en un punto de inflexión calculando el rango porcentual de la volatilidad de los precios en el período más reciente.
DMI- Indicador de tendencia, para determinar la dirección de la tendencia del mercado mediante el cálculo de la diferencia entre +DI y -DI. El índice ADX puede usarse para determinar la intensidad de la tendencia.
El uso integrado de las ventajas de cada uno de estos indicadores para evaluar las tendencias del mercado y los puntos de venta desde diferentes perspectivas puede mejorar la estabilidad y la tasa de éxito de la estrategia.
Ventajas estratégicas
- La combinación de múltiples factores, los diferentes factores que complementan y complementan, es más completa.
- Las señales de cambio de tendencia y de reversión, entre otros, ofrecen más oportunidades.
- Al mismo tiempo, es necesario determinar las zonas de sobreventa y sobrecompra para detectar la formación y reversión de estados extremos.
- La adopción de parámetros optimizados para la configuración de indicadores, más adaptados a las diferentes circunstancias del mercado;
- Combina los indicadores de tendencia para determinar la intensidad de la tendencia y evitar el comercio en contra.
Análisis de riesgos
- La combinación de múltiples factores y la robustez de la estrategia en su conjunto están a la espera de ser verificadas.
- Hay problemas de homogeneización en algunos indicadores, lo que permite optimizar aún más la combinación.
- Cuando las señales de múltiples espacios aparezcan al mismo tiempo, es necesario definir el principio de elección de la dirección estratégica.
- La configuración de los parámetros requiere una optimización de retroalimentación estricta y no es adecuada para cambiar arbitrariamente los parámetros;
- La eficacia a largo plazo puede no ser buena y se necesita una retirada de pérdidas a tiempo.
Dirección de optimización
- Se realizó una selección más detallada de los indicadores en la cartera para preservar los factores únicos que actúan.
- Optimizar la configuración de los parámetros de cada indicador para que sea más adecuado para el mercado objetivo;
- Establecer una clara línea de entrada y salida;
- La combinación de métodos como el stop loss y el retiro de ganancias para controlar el riesgo;
- Prueba el impacto de la duración de las posiciones en el rendimiento.
Resumir
Esta estrategia utiliza las ventajas de varios indicadores técnicos para formar señales de negociación a través de factores como Stoch.RSI, RSI, Double Strategy, CM Williams Vix Fix y DMI. Proporciona una base de juicio más completa y estable, pero también hace que la optimización de los parámetros de la estrategia sea más compleja.
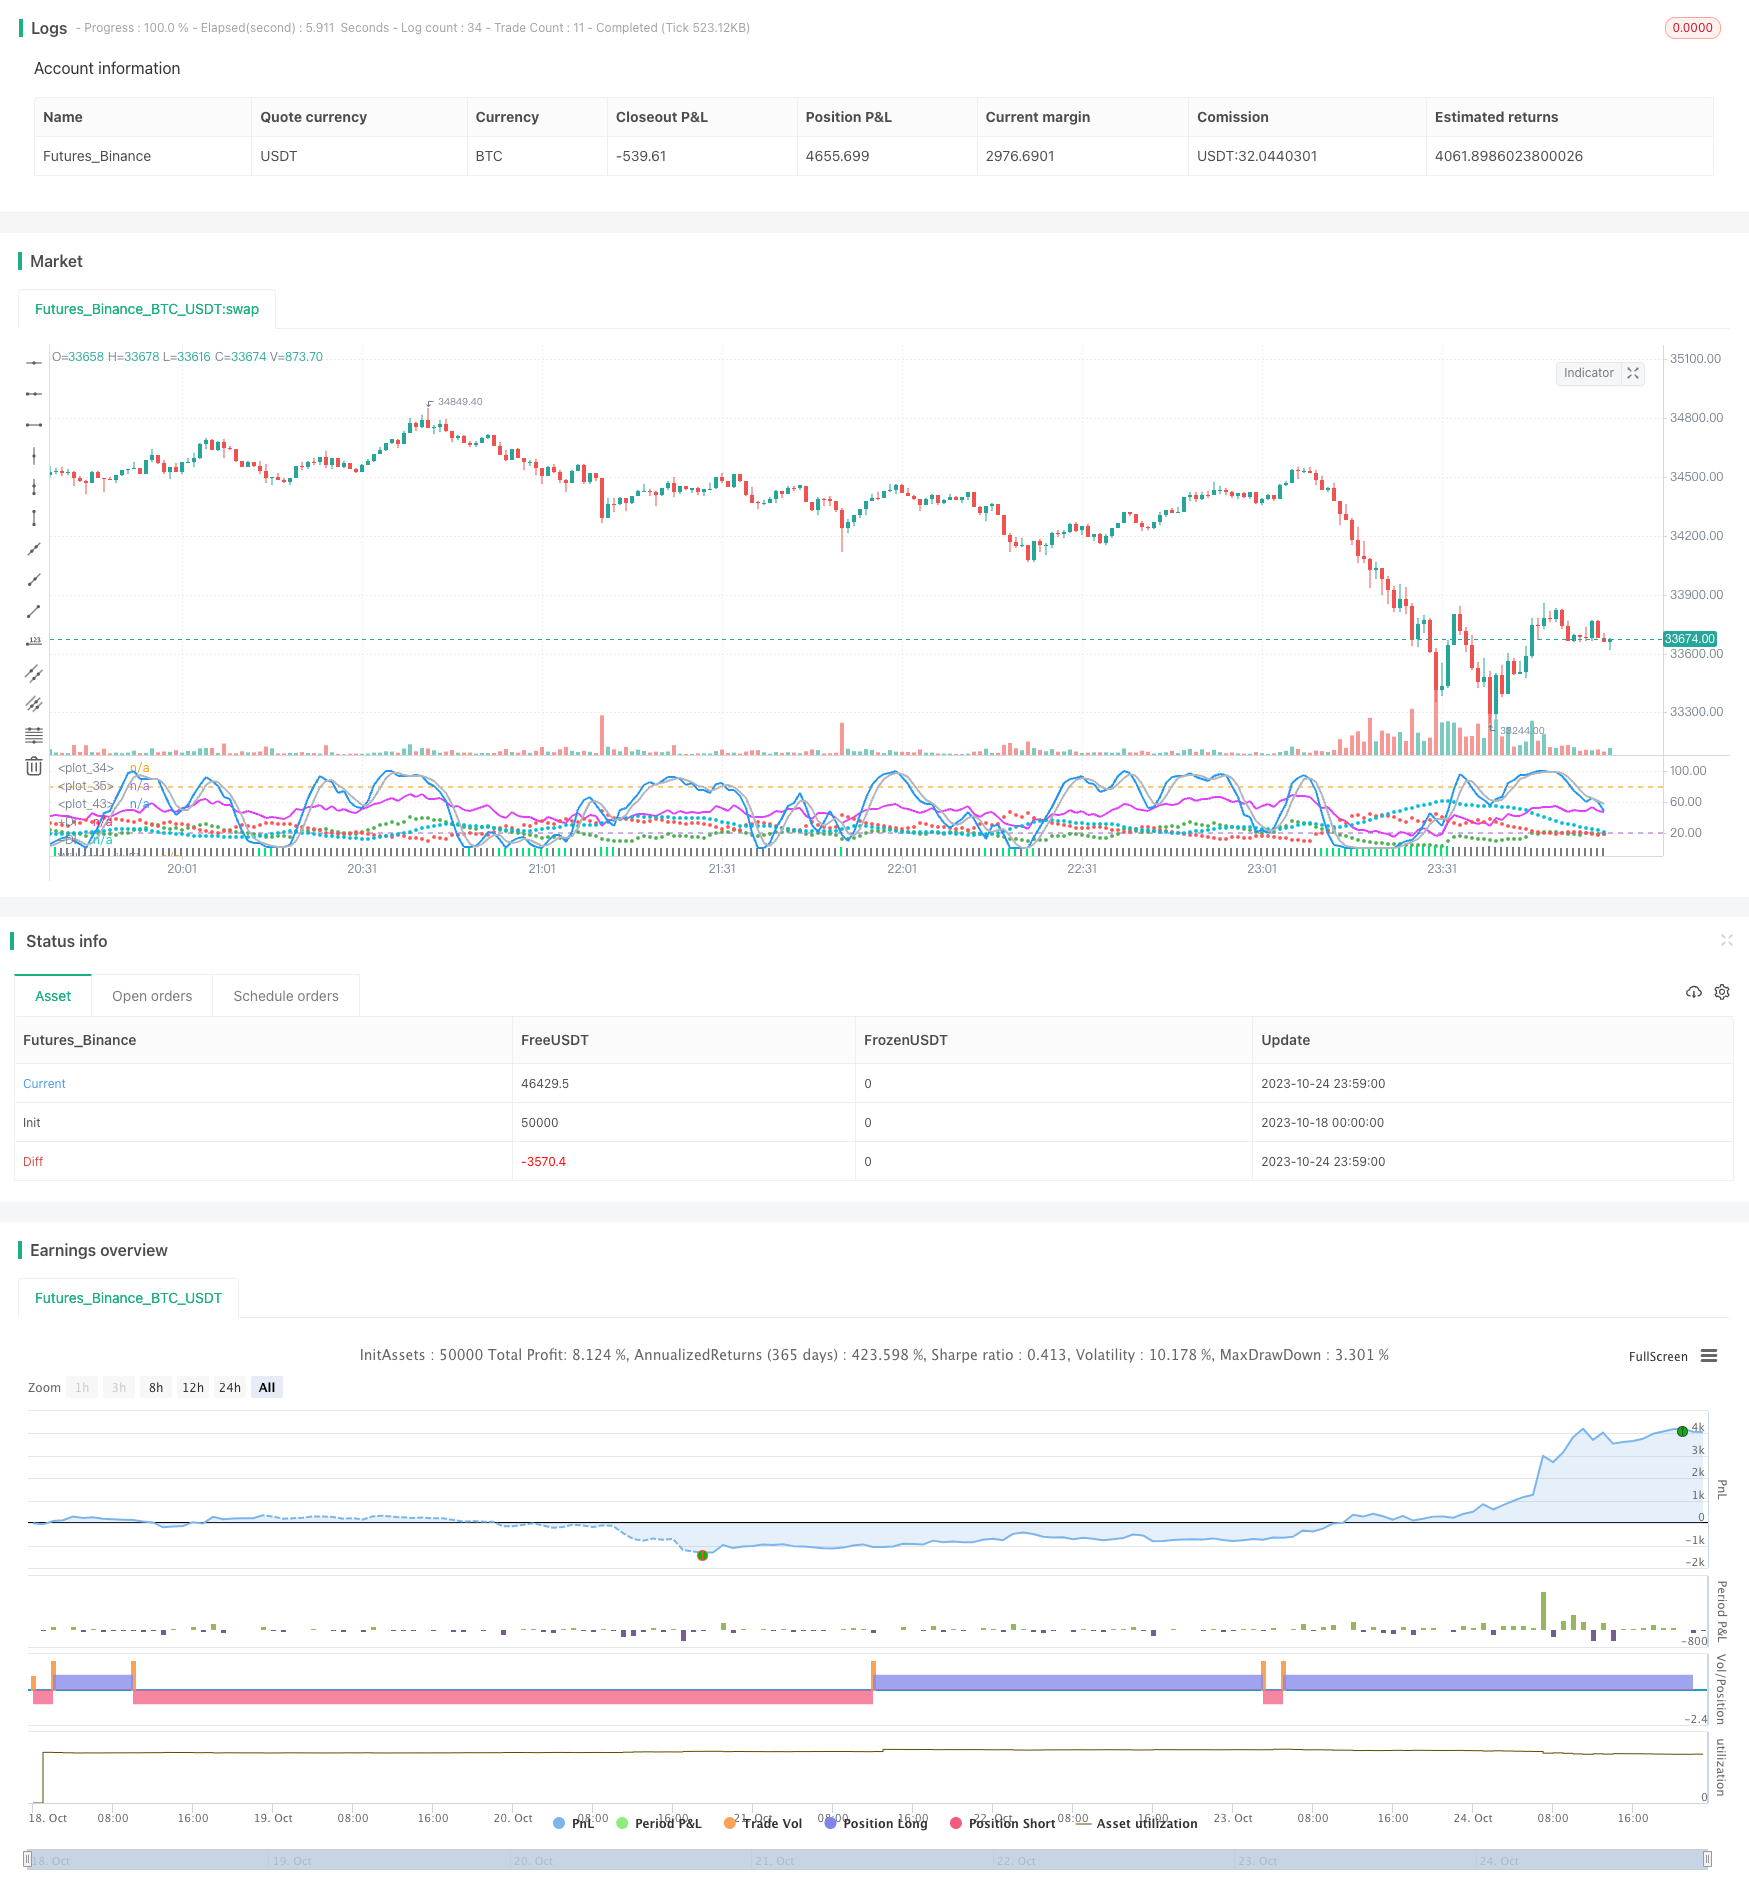
/*backtest
start: 2023-10-18 00:00:00
end: 2023-10-25 00:00:00
period: 1m
basePeriod: 1m
exchanges: [{"eid":"Futures_Binance","currency":"BTC_USDT"}]
*/


     //////////////////////////////////////////////////////////////////////
    ////  STOCHASTIC_RSI+RSI+DOUBLE_STRATEGY+CM_WILLIAMS_VIX_FIX+DMI  ////
   //////////////////////////////////////////////////////////////////////


//  This is a simple combination of integrated and published scripts, useful
//  if you don't have a PRO account and want to bypass the 3 indicator limit.
//  It includes:
//  1) Stoch.RSI
//  2) Relative strenght index
//  3) Stochastic + RSI, Double Strategy (by ChartArt)
//  4) CM_Williams_Vix_Fix Finds Market Bottoms (by ChrisMoody)
//  5) Directional Movement Index (DMI)
//  For more details about 3) and 4) check the original scripts.


//@version=3

strategy(title="Stoch.RSI+RSI+DoubleStrategy+CMWilliamsVixFix+DMI", shorttitle="Stoch.RSI+RSI+DoubleStrategy+CMWilliamsVixFix+DMI")


///STOCH.RSI///
smoothK = input(3, minval=1, title="Stochastic %K Smoothing")
smoothD = input(3, minval=1, title="Stochastic %K Moving Average")
lengthRSI = input(14, minval=1, title="RSI Lenght")
lengthStoch = input(14, minval=1, title="Stochastic Lenght")
RSIprice = close
rsi1 = rsi(RSIprice, lengthRSI)
k = sma(stoch(rsi1, rsi1, rsi1, lengthStoch), smoothK)
d = sma(k, smoothD)
plot(k, color=blue, linewidth=2)
plot(d, color=silver, linewidth=2)
h0 = hline(80)
h1 = hline(20)
fill(h0, h1, color=purple, transp=78)


///RSI///
up = rma(max(change(RSIprice), 0), lengthRSI)
down = rma(-min(change(RSIprice), 0), lengthRSI)
rsi2 = down == 0 ? 100 : up == 0 ? 0 : 100 - (100 / (1 + up / down))
plot(rsi2, color=fuchsia, linewidth=2)
// band0 = hline(70, linestyle=dotted)
// band1 = hline(30, linestyle=dotted)
// fill(band0, band1, color=purple, transp=100)


///OVERBOUGHT-OVERSOLD STRATEGY///
StochOverBought = input(80, title="Stochastic overbought condition")
StochOverSold = input(20, title="Stochastic oversold condition")
ks = sma(stoch(close, high, low, lengthStoch), smoothK)
ds = sma(k, smoothD)
RSIOverBought = input( 70  , title="RSI overbought condition")
RSIOverSold = input( 30  , title="RSI oversold condition")
vrsi = rsi(RSIprice, lengthRSI)
if (not na(ks) and not na(ds))
    if (crossover(ks,ds) and k < StochOverSold)
        if (not na(vrsi)) and (crossover(vrsi, RSIOverSold))
            strategy.entry("LONG", strategy.long, comment="LONG")
if (crossunder(ks,ds) and ks > StochOverBought)
    if (crossunder(vrsi, RSIOverBought))
        strategy.entry("SHORT", strategy.short, comment="SHORT")


///CM WILLIAMS VIX FIX///
pd = input(22, title="LookBack Period Standard Deviation High")
bbl = input(20, title="Bollinger Band Length")
mult = input(2.0    , minval=1, maxval=5, title="Bollinger Band Standard Devaition Up")
lb = input(50  , title="Look Back Period Percentile High")
ph = input(.85, title="Highest Percentile - 0.90=90%, 0.95=95%, 0.99=99%")
pl = input(1.01, title="Lowest Percentile - 1.10=90%, 1.05=95%, 1.01=99%")
hp = input(false, title="Show High Range (Based on Percentile and LookBack Period)?")
sd = input(false, title="Show Standard Deviation Line?")
wvf = ((highest(close, pd)-low)/(highest(close, pd)))*100
sDev = mult * stdev(wvf, bbl)
midLine = sma(wvf, bbl)
lowerBand = midLine - sDev
upperBand = midLine + sDev
rangeHigh = (highest(wvf, lb)) * ph
rangeLow = (lowest(wvf, lb)) * pl
col = wvf >= upperBand or wvf >= rangeHigh ? lime : gray
plot(hp and rangeHigh ? rangeHigh : na, title="Range High Percentile", style=line, linewidth=4, color=orange)
plot(hp and rangeLow ? rangeLow : na, title="Range High Percentile", style=line, linewidth=4, color=orange)
plot(wvf, title="Williams Vix Fix", style=columns, linewidth = 4, color=col, transp=85)
plot(sd and upperBand ? upperBand : na, title="Upper Band", style=line, linewidth = 3, color=aqua)


///DIRECTIONAL MOVEMENT INDEX///
len3 = input(14, minval=1, title="DI Length")
lensig3 = input(14, title="ADX Smoothing", minval=1, maxval=50)
up3 = change(high)
down3 = -change(low)
plusDM3 = na(up3) ? na : (up3 > down3 and up3 > 0 ? up3 : 0)
minusDM3 = na(down3) ? na : (down3 > up3 and down3 > 0 ? down3 : 0)
trur3 = rma(tr, len3)
plus3 = fixnan(100 * rma(plusDM3, len3) / trur3)
minus3 = fixnan(100 * rma(minusDM3, len3) / trur3)
sum3 = plus3 + minus3
adx3 = 100 * rma(abs(plus3 - minus3) / (sum3 == 0 ? 1 : sum3), lensig3)
plot(plus3, color=green, style=circles, linewidth=2, title="+DI")
plot(minus3, color=red, style=circles, linewidth=2, title="-DI")
plot(adx3, color=aqua, style=circles, linewidth=3, title="ADX")