Estrategia bipolar de retorno mensual
Fecha de creación:
2023-11-06 16:06:55
Última modificación:
2023-11-06 16:06:55
Copiar:
0
Número de Visitas:
394
1
Seguir
1213
Seguidores
Resumen
La estrategia utiliza los puntos centrales de la línea K para determinar la reversión de la tendencia y para señalar el comercio de más de la cabeza en blanco. En el momento de la ganancia, la estrategia se bloquea en los beneficios que se han logrado en el mes, para evitar una mayor pérdida en el período de retiro.
Principios de la estrategia
- Aprovecho
pivothigh()ypivotlow()La función calcula el eje central de la línea K. El eje central puede determinar la inversión de tendencia. - Cuando el precio supera el eje superior, se hace una posición de más cabeza. Cuando el precio cae por debajo del eje inferior, se hace una posición de menos cabeza.
- Al comienzo de cada mes, se calcula el rendimiento del mes anterior y se guarda en un array.
- Al comienzo de cada año, se calcula el rendimiento del año anterior y se guarda en un array.
- Traza una tabla de rentabilidad que te permita visualizar la rentabilidad de cada mes y año.
Análisis de las ventajas
- El eje central puede utilizarse para evaluar la reversión de la tendencia y filtrar parte de la señal de negociación de ruido.
- El bloqueo de ganancias mensualmente reduce el impacto de los meses de pérdidas y polariza las ganancias.
- La tabla de ganancias muestra de forma intuitiva los beneficios de cada mes, lo que permite ver con claridad los buenos y malos momentos de la estrategia.
Análisis de riesgos
- Los cambios en los puntos centrales pueden causar una apertura inversa errónea. Se pueden optimizar los parámetros adecuadamente o agregar condiciones de filtración.
- Si se obliga a cerrar posiciones al comienzo del mes, se perderá la oportunidad de obtener ganancias durante el resto del mes.
- La tabla no puede mostrar indicadores de riesgo como la retirada máxima. Se puede considerar agregar otros indicadores para medir el riesgo de la estrategia.
Dirección de optimización
- Se pueden agregar condiciones de filtración cerca de los puntos centrales para evitar el uso frecuente de inversiones no válidas.
- Se puede bloquear solo una parte de la posición, no la totalidad, lo que reduce la posibilidad de pérdidas.
- Se puede aumentar la visualización de indicadores de riesgo cuantitativos en la tabla, como la retirada máxima y el índice de Sharpe.
Resumen
La estrategia utiliza los puntos centrales para determinar el cambio de tendencia y bloquear los beneficios al final de la semana para controlar el riesgo de retiro. Sin embargo, algunos parámetros y la lógica de la estrategia pueden optimizarse aún más para que las señales de negociación sean más precisas y el control del riesgo más estable.
Código Fuente de la Estrategia
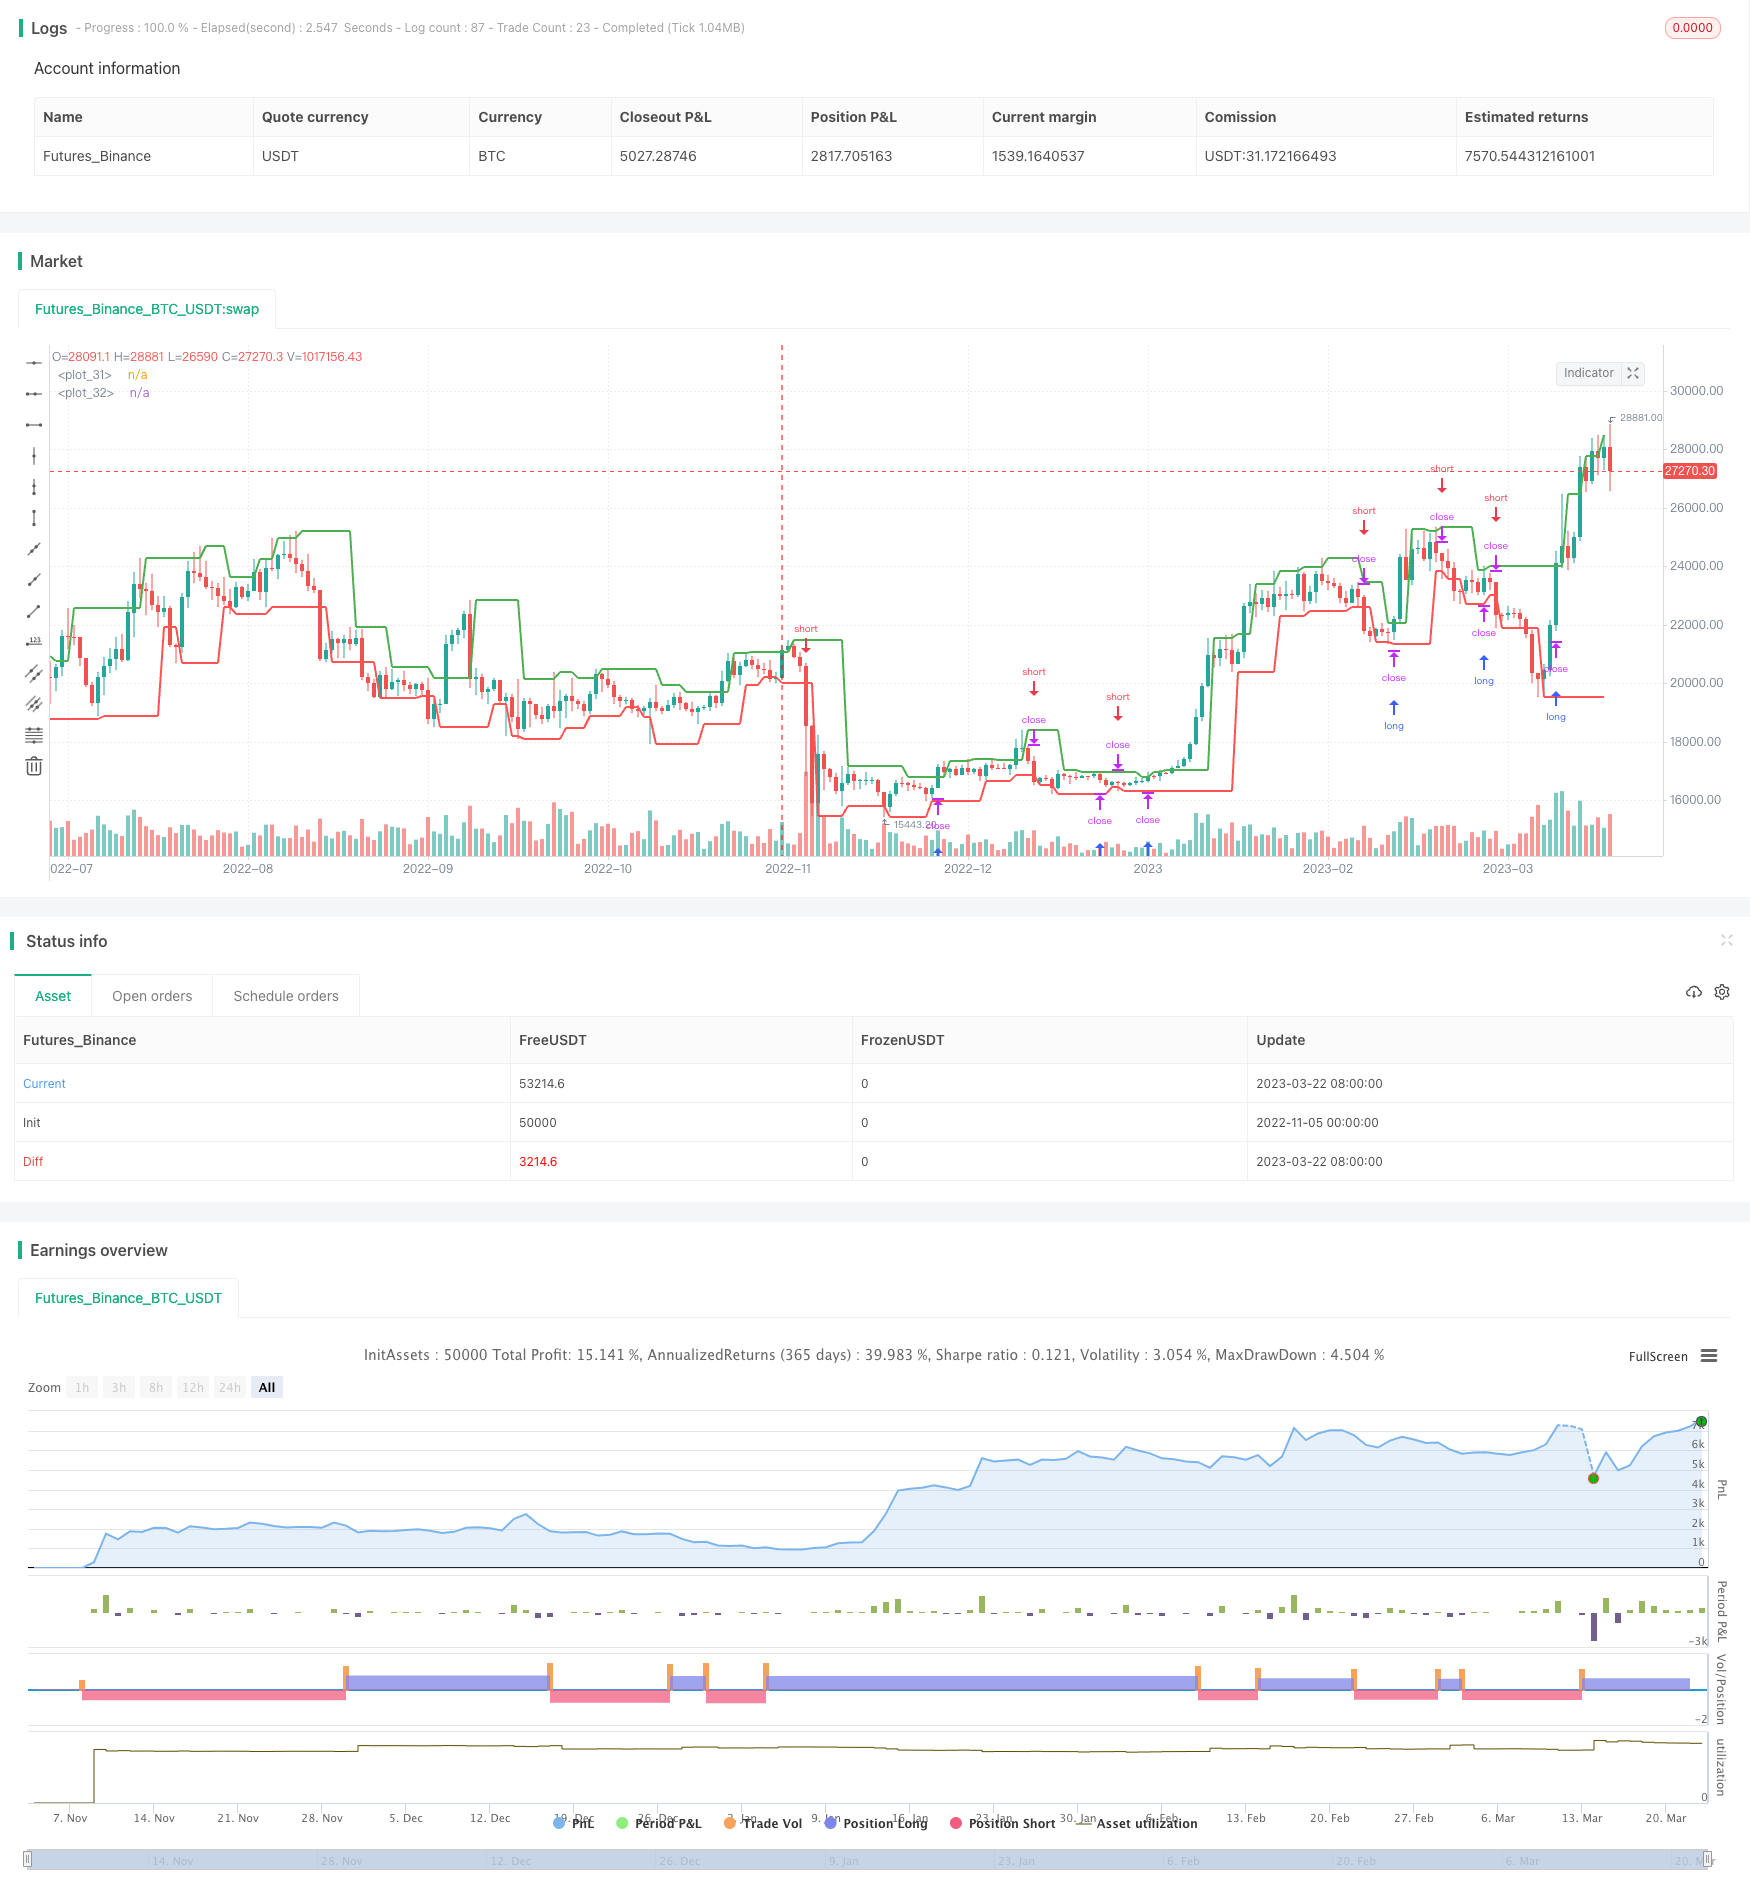
/*backtest
start: 2022-11-05 00:00:00
end: 2023-03-23 05:20:00
period: 1d
basePeriod: 1h
exchanges: [{"eid":"Futures_Binance","currency":"BTC_USDT"}]
*/

//@version=4
strategy("Monthly Returns in PineScript Strategies", overlay = true, default_qty_type = strategy.percent_of_equity, default_qty_value = 25, calc_on_every_tick = true, commission_type = strategy.commission.percent, commission_value = 0.1)

// Inputs
leftBars  = input(2)
rightBars = input(1)
prec      = input(2, title = "Return Precision")

// Pivot Points
swh = pivothigh(leftBars, rightBars)
swl = pivotlow(leftBars, rightBars)

hprice = 0.0
hprice := not na(swh) ? swh : hprice[1]

lprice = 0.0
lprice := not na(swl) ? swl : lprice[1]

le = false
le := not na(swh) ? true : (le[1] and high > hprice ? false : le[1])

se = false
se := not na(swl) ? true : (se[1] and low < lprice ? false : se[1])

if (le)
	strategy.entry("PivRevLE", strategy.long, comment="PivRevLE", stop=hprice + syminfo.mintick)

if (se)
	strategy.entry("PivRevSE", strategy.short, comment="PivRevSE", stop=lprice - syminfo.mintick)

plot(hprice, color = color.green, linewidth = 2)
plot(lprice, color = color.red,   linewidth = 2)

///////////////////
// MONTHLY TABLE //

new_month = month(time) != month(time[1])
new_year  = year(time)  != year(time[1])

eq = strategy.equity

bar_pnl = eq / eq[1] - 1

cur_month_pnl = 0.0
cur_year_pnl  = 0.0

// Current Monthly P&L
cur_month_pnl := new_month ? 0.0 :
                 (1 + cur_month_pnl[1]) * (1 + bar_pnl) - 1

// Current Yearly P&L
cur_year_pnl := new_year ? 0.0 :
                 (1 + cur_year_pnl[1]) * (1 + bar_pnl) - 1

// Arrays to store Yearly and Monthly P&Ls
var month_pnl  = array.new_float(0)
var month_time = array.new_int(0)

var year_pnl  = array.new_float(0)
var year_time = array.new_int(0)

if (not na(cur_month_pnl[1]) and (new_month or barstate.islast))
    array.push(month_pnl , cur_month_pnl[1])
    array.push(month_time, time[1])

if (not na(cur_year_pnl[1]) and (new_year or barstate.islast))
    array.push(year_pnl , cur_year_pnl[1])
    array.push(year_time, time[1])

// Monthly P&L Table
var monthly_table = table(na)

if (barstate.islast)
    monthly_table := table.new(position.bottom_right, columns = 14, rows = array.size(year_pnl) + 1, border_width = 1)

    table.cell(monthly_table, 0,  0, "",     bgcolor = #cccccc)
    table.cell(monthly_table, 1,  0, "Jan",  bgcolor = #cccccc)
    table.cell(monthly_table, 2,  0, "Feb",  bgcolor = #cccccc)
    table.cell(monthly_table, 3,  0, "Mar",  bgcolor = #cccccc)
    table.cell(monthly_table, 4,  0, "Apr",  bgcolor = #cccccc)
    table.cell(monthly_table, 5,  0, "May",  bgcolor = #cccccc)
    table.cell(monthly_table, 6,  0, "Jun",  bgcolor = #cccccc)
    table.cell(monthly_table, 7,  0, "Jul",  bgcolor = #cccccc)
    table.cell(monthly_table, 8,  0, "Aug",  bgcolor = #cccccc)
    table.cell(monthly_table, 9,  0, "Sep",  bgcolor = #cccccc)
    table.cell(monthly_table, 10, 0, "Oct",  bgcolor = #cccccc)
    table.cell(monthly_table, 11, 0, "Nov",  bgcolor = #cccccc)
    table.cell(monthly_table, 12, 0, "Dec",  bgcolor = #cccccc)
    table.cell(monthly_table, 13, 0, "Year", bgcolor = #999999)


    for yi = 0 to array.size(year_pnl) - 1
        table.cell(monthly_table, 0,  yi + 1, tostring(year(array.get(year_time, yi))), bgcolor = #cccccc)

        y_color = array.get(year_pnl, yi) > 0 ? color.new(color.green, transp = 50) : color.new(color.red, transp = 50)
        table.cell(monthly_table, 13, yi + 1, tostring(round(array.get(year_pnl, yi) * 100, prec)), bgcolor = y_color)

    for mi = 0 to array.size(month_time) - 1
        m_row   = year(array.get(month_time, mi))  - year(array.get(year_time, 0)) + 1
        m_col   = month(array.get(month_time, mi))
        m_color = array.get(month_pnl, mi) > 0 ? color.new(color.green, transp = 70) : color.new(color.red, transp = 70)

        table.cell(monthly_table, m_col, m_row, tostring(round(array.get(month_pnl, mi) * 100, prec)), bgcolor = m_color)