Estrategia de seguimiento de tendencias basada en la rotación del impulso en múltiples marcos temporales
Descripción general
La estrategia utiliza una combinación de promedios móviles a lo largo de los marcos temporales para identificar la rotación de tendencias en el gráfico de horas grandes y medianas, lo que permite realizar operaciones de seguimiento de tendencias de bajo riesgo. La estrategia tiene una configuración flexible y ofrece ventajas de sencillez y alta eficiencia de capital, adecuadas para los operadores que mantienen posiciones de seguimiento de tendencias en la línea media y larga.
Análisis de la interpretación original
La estrategia utiliza tres medias móviles de 5, 20 y 40 días para juzgar la combinación de tendencias en diferentes marcos de tiempo. De acuerdo con el principio de consistencia de tendencias de gráficos horarios grandes y medianos, se determina el período de espacio múltiple.
Concretamente, 5 días en la línea rápida a través de 20 días en la línea media se considera una señal de corto en línea, 20 días en la línea media a través de 40 días en la línea lenta se considera una señal de corto en línea. Cuando rápido y lento 3 líneas en línea recta ((5 días> 20 días> 40 días), se juzga como un ciclo de múltiples cabezas; cuando rápido y lento 3 líneas en línea inversa ((5 días < 20 días < 40 días), se juzga como un ciclo de cabeza vacía.
De esta manera, en función de la dirección de la tendencia del ciclo grande, y luego en combinación con la intensidad del ciclo pequeño para detectar la entrada concreta. Es decir, sólo en el caso de que la tendencia sea homogénea y el ciclo pequeño sea fuerte, se puede abrir una posición para filtrar eficazmente la ruptura de la inversión y la inversión, para lograr una operación de alta tasa de ganancia.
Además, la estrategia utiliza el ATR Stop Loss para controlar el riesgo individual y aumentar aún más la rentabilidad.
Análisis de las ventajas
Flexible configuración, el usuario puede ajustar los parámetros de la media móvil para adaptarse a diferentes variedades y preferencias de negociación
Es fácil de implementar y fácil de usar para los principiantes.
Eficiencia en el uso de los fondos y aprovechamiento de los fondos
Los riesgos son controlables y los mecanismos de suspensión de pérdidas son efectivos para evitar pérdidas importantes
Fuerte capacidad de seguimiento de tendencias, ganancias continuas después de que el ciclo grande determine la dirección
Mayor probabilidad de éxito, buena calidad de la señal de transacción, menos errores de cambio de carril
Riesgos y mejoras
El juicio de grandes períodos depende de la disposición de la línea media desplazada, con riesgo de error de juicio por retraso
Detección de intensidad en pequeños ciclos con un solo cable K, que puede activarse con anticipación y relajarse adecuadamente
El stop loss está fijo y se puede optimizar para que sea dinámico
Se puede considerar la inclusión de condiciones de filtración adicionales, como la energía del volumen de transacción.
Puede probar diferentes combinaciones de parámetros de la media móvil, estrategias de optimización
Resumir
Esta estrategia integra análisis de múltiples marcos de tiempo y gestión de stop loss, lo que permite realizar operaciones de seguimiento de tendencias de bajo riesgo. Al ajustar los parámetros, se puede aplicar a diferentes variedades para satisfacer las necesidades de los seguidores de tendencias. En comparación con los sistemas tradicionales de un solo marco de tiempo, sus decisiones de negociación son más sólidas y sus señales más eficientes.
Overview
This strategy uses a combination of moving averages across timeframes to identify trend rotations on the hourly, daily and weekly charts. It allows low-risk trend following trading. The strategy is flexible, simple to implement, capital efficient and suitable for medium-long term trend traders.
Trading Logic
The strategy employs 5, 20 and 40-day moving averages to determine the alignment of trends across different timeframes. Based on the consistency between larger and smaller timeframes, it identifies bullish and bearish cycles.
Specifically, the crossing of 5-day fast MA above 20-day medium MA indicates an uptrend in the short term. The crossing of 20-day medium MA above 40-day slow MA signals an uptrend in the medium term. When the fast, medium and slow MAs are positively aligned (5-day > 20-day > 40-day), it is a bull cycle. When they are negatively aligned (5-day < 20-day < 40-day), it is a bear cycle.
By determining direction from the larger cycles and confirming strength on the smaller cycles, this strategy opens positions only when major trend and minor momentum align. This effectively avoids false breakouts and achieves high win rate.
The strategy also utilizes ATR trailing stops to control single trade risks and further improve profitability.
Advantages
Flexible configurations to suit different instruments and trading styles
Simple to implement even for beginner traders
High capital efficiency to maximize leverage
Effective risk control to avoid significant losses
Strong trend following ability for sustained profits
High win rate due to robust signals and fewer whipsaws
Risks and Improvements
MA crossovers may lag and cause late trend detection
Single candle strength detection could trigger premature entry, relax condition
Fixed ATR stop loss, optimize to dynamic stops
Consider adding supplementary filters like volume
Explore different MA parameters for optimization
Conclusion
This strategy integrates multiple timeframe analysis and risk management for low-risk trend following trading. By adjusting parameters, it can be adapted to different instruments to suit trend traders. Compared to single timeframe systems, it makes more robust trading decisions and generates higher efficiency signals. In conclusion, this strategy has good market adaptiveness and development potential.
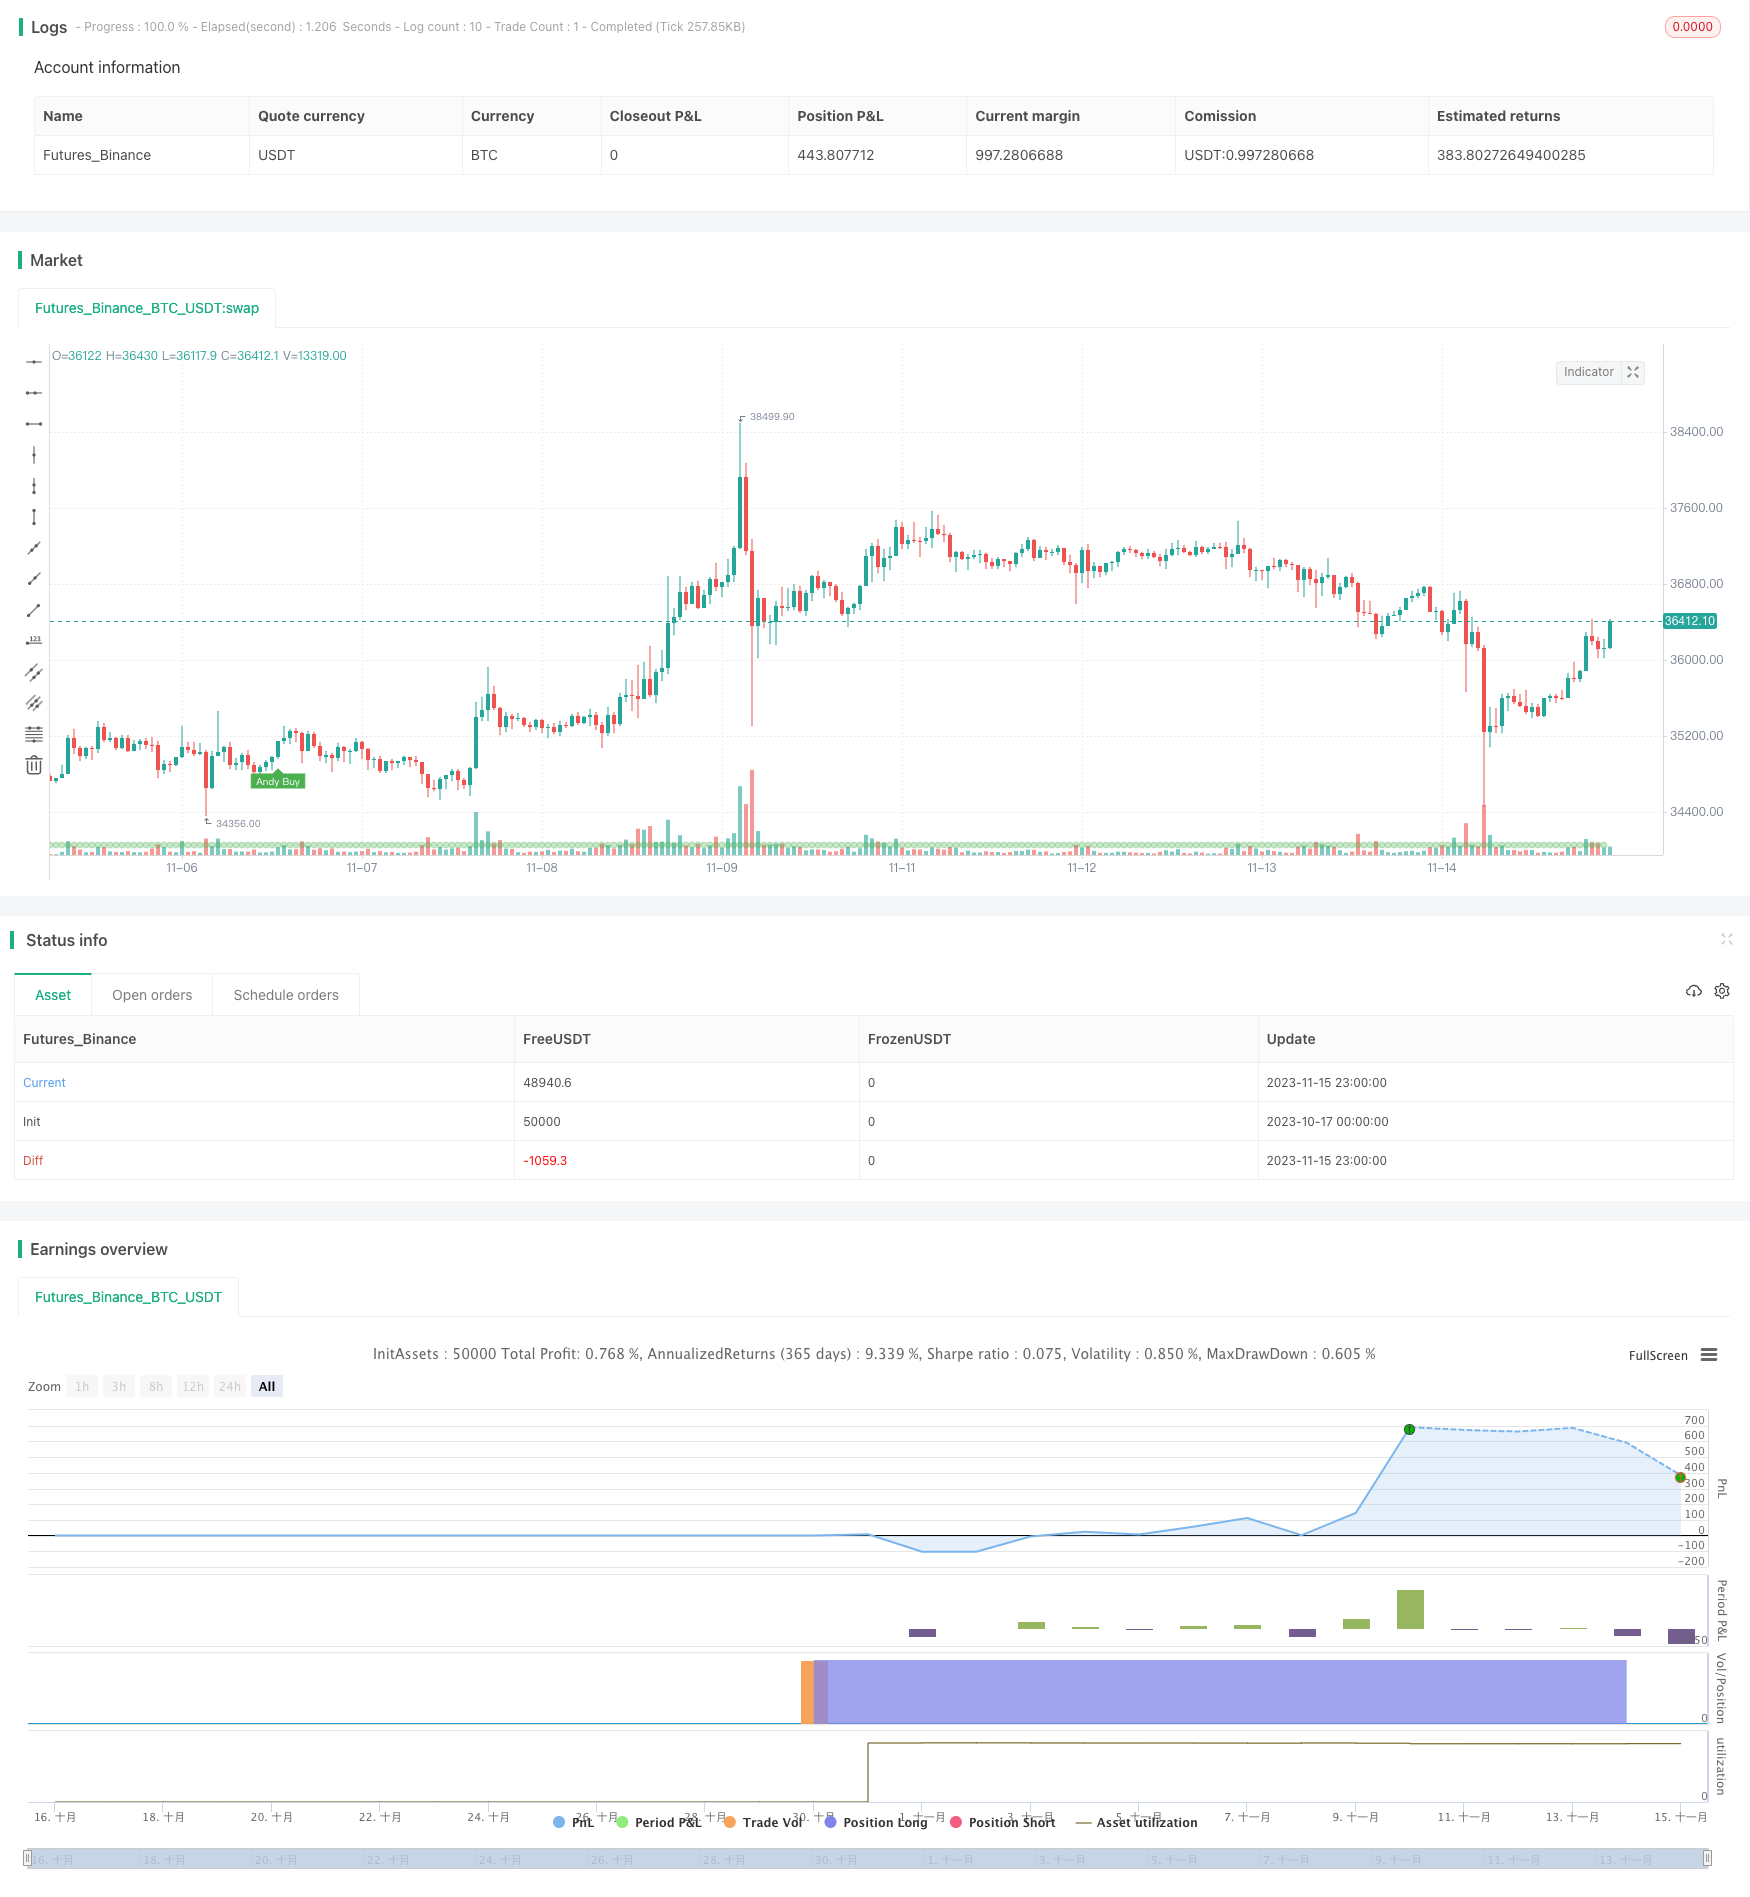
/*backtest
start: 2023-10-17 00:00:00
end: 2023-11-16 00:00:00
period: 1h
basePeriod: 15m
exchanges: [{"eid":"Futures_Binance","currency":"BTC_USDT"}]
*/

// This source code is subject to the terms of the Mozilla Public License 2.0 at https://mozilla.org/MPL/2.0/
// © kgynofomo

//@version=5
strategy(title="[Salavi] | Andy Advance Pro Strategy [BTC|M15]",overlay = true, pyramiding = 1,initial_capital = 10000, default_qty_type = strategy.cash,default_qty_value = 10000)

ema_short = ta.ema(close,5)
ema_middle = ta.ema(close,20)
ema_long = ta.ema(close,40)

cycle_1 = ema_short>ema_middle and ema_middle>ema_long
cycle_2 = ema_middle>ema_short and ema_short>ema_long
cycle_3 = ema_middle>ema_long and ema_long>ema_short
cycle_4 = ema_long>ema_middle and ema_middle>ema_short
cycle_5 = ema_long>ema_short and ema_short>ema_middle
cycle_6 = ema_short>ema_long and ema_long>ema_middle

bull_cycle = cycle_1 or cycle_2 or cycle_3
bear_cycle = cycle_4 or cycle_5 or cycle_6
// label.new("cycle_1")
// bgcolor(color=cycle_1?color.rgb(82, 255, 148, 60):na)
// bgcolor(color=cycle_2?color.rgb(82, 255, 148, 70):na)
// bgcolor(color=cycle_3?color.rgb(82, 255, 148, 80):na)
// bgcolor(color=cycle_4?color.rgb(255, 82, 82, 80):na)
// bgcolor(color=cycle_5?color.rgb(255, 82, 82, 70):na)
// bgcolor(color=cycle_6?color.rgb(255, 82, 82, 60):na)

// Inputs
a = input(2, title='Key Vaule. \'This changes the sensitivity\'')
c = input(7, title='ATR Period')
h = false

xATR = ta.atr(c)
nLoss = a * xATR

src = h ? request.security(ticker.heikinashi(syminfo.tickerid), timeframe.period, close, lookahead=barmerge.lookahead_off) : close

xATRTrailingStop = 0.0
iff_1 = src > nz(xATRTrailingStop[1], 0) ? src - nLoss : src + nLoss
iff_2 = src < nz(xATRTrailingStop[1], 0) and src[1] < nz(xATRTrailingStop[1], 0) ? math.min(nz(xATRTrailingStop[1]), src + nLoss) : iff_1
xATRTrailingStop := src > nz(xATRTrailingStop[1], 0) and src[1] > nz(xATRTrailingStop[1], 0) ? math.max(nz(xATRTrailingStop[1]), src - nLoss) : iff_2

pos = 0
iff_3 = src[1] > nz(xATRTrailingStop[1], 0) and src < nz(xATRTrailingStop[1], 0) ? -1 : nz(pos[1], 0)
pos := src[1] < nz(xATRTrailingStop[1], 0) and src > nz(xATRTrailingStop[1], 0) ? 1 : iff_3

xcolor = pos == -1 ? color.red : pos == 1 ? color.green : color.blue

ema = ta.ema(src, 1)
above = ta.crossover(ema, xATRTrailingStop)
below = ta.crossover(xATRTrailingStop, ema)

buy = src > xATRTrailingStop and above
sell = src < xATRTrailingStop and below

barbuy = src > xATRTrailingStop
barsell = src < xATRTrailingStop


atr = ta.atr(14)
atr_length = input.int(25)
atr_rsi = ta.rsi(atr,atr_length)
atr_valid = atr_rsi>50

long_condition =  buy and bull_cycle and atr_valid
short_condition =  sell and bear_cycle and atr_valid

Exit_long_condition = short_condition
Exit_short_condition = long_condition

if long_condition
    strategy.entry("Andy Buy",strategy.long, limit=close,comment="Andy Buy Here")

if Exit_long_condition
    strategy.close("Andy Buy",comment="Andy Buy Out")
    // strategy.entry("Andy fandan Short",strategy.short, limit=close,comment="Andy 翻單 short Here")
    // strategy.close("Andy fandan Buy",comment="Andy short Out")


if short_condition
    strategy.entry("Andy Short",strategy.short, limit=close,comment="Andy short Here")


// strategy.exit("STR","Long",stop=longstoploss)
if Exit_short_condition
    strategy.close("Andy Short",comment="Andy short Out")
    // strategy.entry("Andy fandan Buy",strategy.long, limit=close,comment="Andy 翻單 Buy Here")
    // strategy.close("Andy fandan Short",comment="Andy Buy Out")


inLongTrade = strategy.position_size > 0
inLongTradecolor = #58D68D
notInTrade = strategy.position_size == 0
inShortTrade = strategy.position_size < 0

// bgcolor(color = inLongTrade?color.rgb(76, 175, 79, 70):inShortTrade?color.rgb(255, 82, 82, 70):na)
plotshape(close!=0,location = location.bottom,color = inLongTrade?color.rgb(76, 175, 79, 70):inShortTrade?color.rgb(255, 82, 82, 70):na)


plotshape(long_condition, title='Buy', text='Andy Buy', style=shape.labelup, location=location.belowbar, color=color.new(color.green, 0), textcolor=color.new(color.white, 0), size=size.tiny)
plotshape(short_condition, title='Sell', text='Andy Sell', style=shape.labeldown, location=location.abovebar, color=color.new(color.red, 0), textcolor=color.new(color.white, 0), size=size.tiny)


//atr > close *0.01* parameter

// MONTHLY TABLE PERFORMANCE - Developed by @QuantNomad
// *************************************************************************************************************************************************************************************************************************************************************************
show_performance = input.bool(true, 'Show Monthly Performance ?', group='Performance - credits: @QuantNomad')
prec = input(2, 'Return Precision', group='Performance - credits: @QuantNomad')

if show_performance
    new_month = month(time) != month(time[1])
    new_year  = year(time)  != year(time[1])

    eq = strategy.equity

    bar_pnl = eq / eq[1] - 1

    cur_month_pnl = 0.0
    cur_year_pnl  = 0.0

    // Current Monthly P&L
    cur_month_pnl := new_month ? 0.0 :
                     (1 + cur_month_pnl[1]) * (1 + bar_pnl) - 1

    // Current Yearly P&L
    cur_year_pnl := new_year ? 0.0 :
                     (1 + cur_year_pnl[1]) * (1 + bar_pnl) - 1

    // Arrays to store Yearly and Monthly P&Ls
    var month_pnl  = array.new_float(0)
    var month_time = array.new_int(0)

    var year_pnl  = array.new_float(0)
    var year_time = array.new_int(0)

    last_computed = false

    if (not na(cur_month_pnl[1]) and (new_month or barstate.islastconfirmedhistory))
        if (last_computed[1])
            array.pop(month_pnl)
            array.pop(month_time)

        array.push(month_pnl , cur_month_pnl[1])
        array.push(month_time, time[1])

    if (not na(cur_year_pnl[1]) and (new_year or barstate.islastconfirmedhistory))
        if (last_computed[1])
            array.pop(year_pnl)
            array.pop(year_time)

        array.push(year_pnl , cur_year_pnl[1])
        array.push(year_time, time[1])

    last_computed := barstate.islastconfirmedhistory ? true : nz(last_computed[1])

    // Monthly P&L Table
    var monthly_table = table(na)

    if (barstate.islastconfirmedhistory)
        monthly_table := table.new(position.bottom_center, columns = 14, rows = array.size(year_pnl) + 1, border_width = 1)

        table.cell(monthly_table, 0,  0, "",     bgcolor = #cccccc)
        table.cell(monthly_table, 1,  0, "Jan",  bgcolor = #cccccc)
        table.cell(monthly_table, 2,  0, "Feb",  bgcolor = #cccccc)
        table.cell(monthly_table, 3,  0, "Mar",  bgcolor = #cccccc)
        table.cell(monthly_table, 4,  0, "Apr",  bgcolor = #cccccc)
        table.cell(monthly_table, 5,  0, "May",  bgcolor = #cccccc)
        table.cell(monthly_table, 6,  0, "Jun",  bgcolor = #cccccc)
        table.cell(monthly_table, 7,  0, "Jul",  bgcolor = #cccccc)
        table.cell(monthly_table, 8,  0, "Aug",  bgcolor = #cccccc)
        table.cell(monthly_table, 9,  0, "Sep",  bgcolor = #cccccc)
        table.cell(monthly_table, 10, 0, "Oct",  bgcolor = #cccccc)
        table.cell(monthly_table, 11, 0, "Nov",  bgcolor = #cccccc)
        table.cell(monthly_table, 12, 0, "Dec",  bgcolor = #cccccc)
        table.cell(monthly_table, 13, 0, "Year", bgcolor = #999999)


        for yi = 0 to array.size(year_pnl) - 1
            table.cell(monthly_table, 0,  yi + 1, str.tostring(year(array.get(year_time, yi))), bgcolor = #cccccc)

            y_color = array.get(year_pnl, yi) > 0 ? color.new(color.teal, transp = 40) : color.new(color.gray, transp = 40)
            table.cell(monthly_table, 13, yi + 1, str.tostring(math.round(array.get(year_pnl, yi) * 100, prec)), bgcolor = y_color, text_color=color.new(color.white, 0))

        for mi = 0 to array.size(month_time) - 1
            m_row   = year(array.get(month_time, mi))  - year(array.get(year_time, 0)) + 1
            m_col   = month(array.get(month_time, mi))
            m_color = array.get(month_pnl, mi) > 0 ? color.new(color.teal, transp = 40) : color.new(color.gray, transp = 40)

            table.cell(monthly_table, m_col, m_row, str.tostring(math.round(array.get(month_pnl, mi) * 100, prec)), bgcolor = m_color, text_color=color.new(color.white, 0))