Estrategia de maximización de beneficios Y
Descripción general
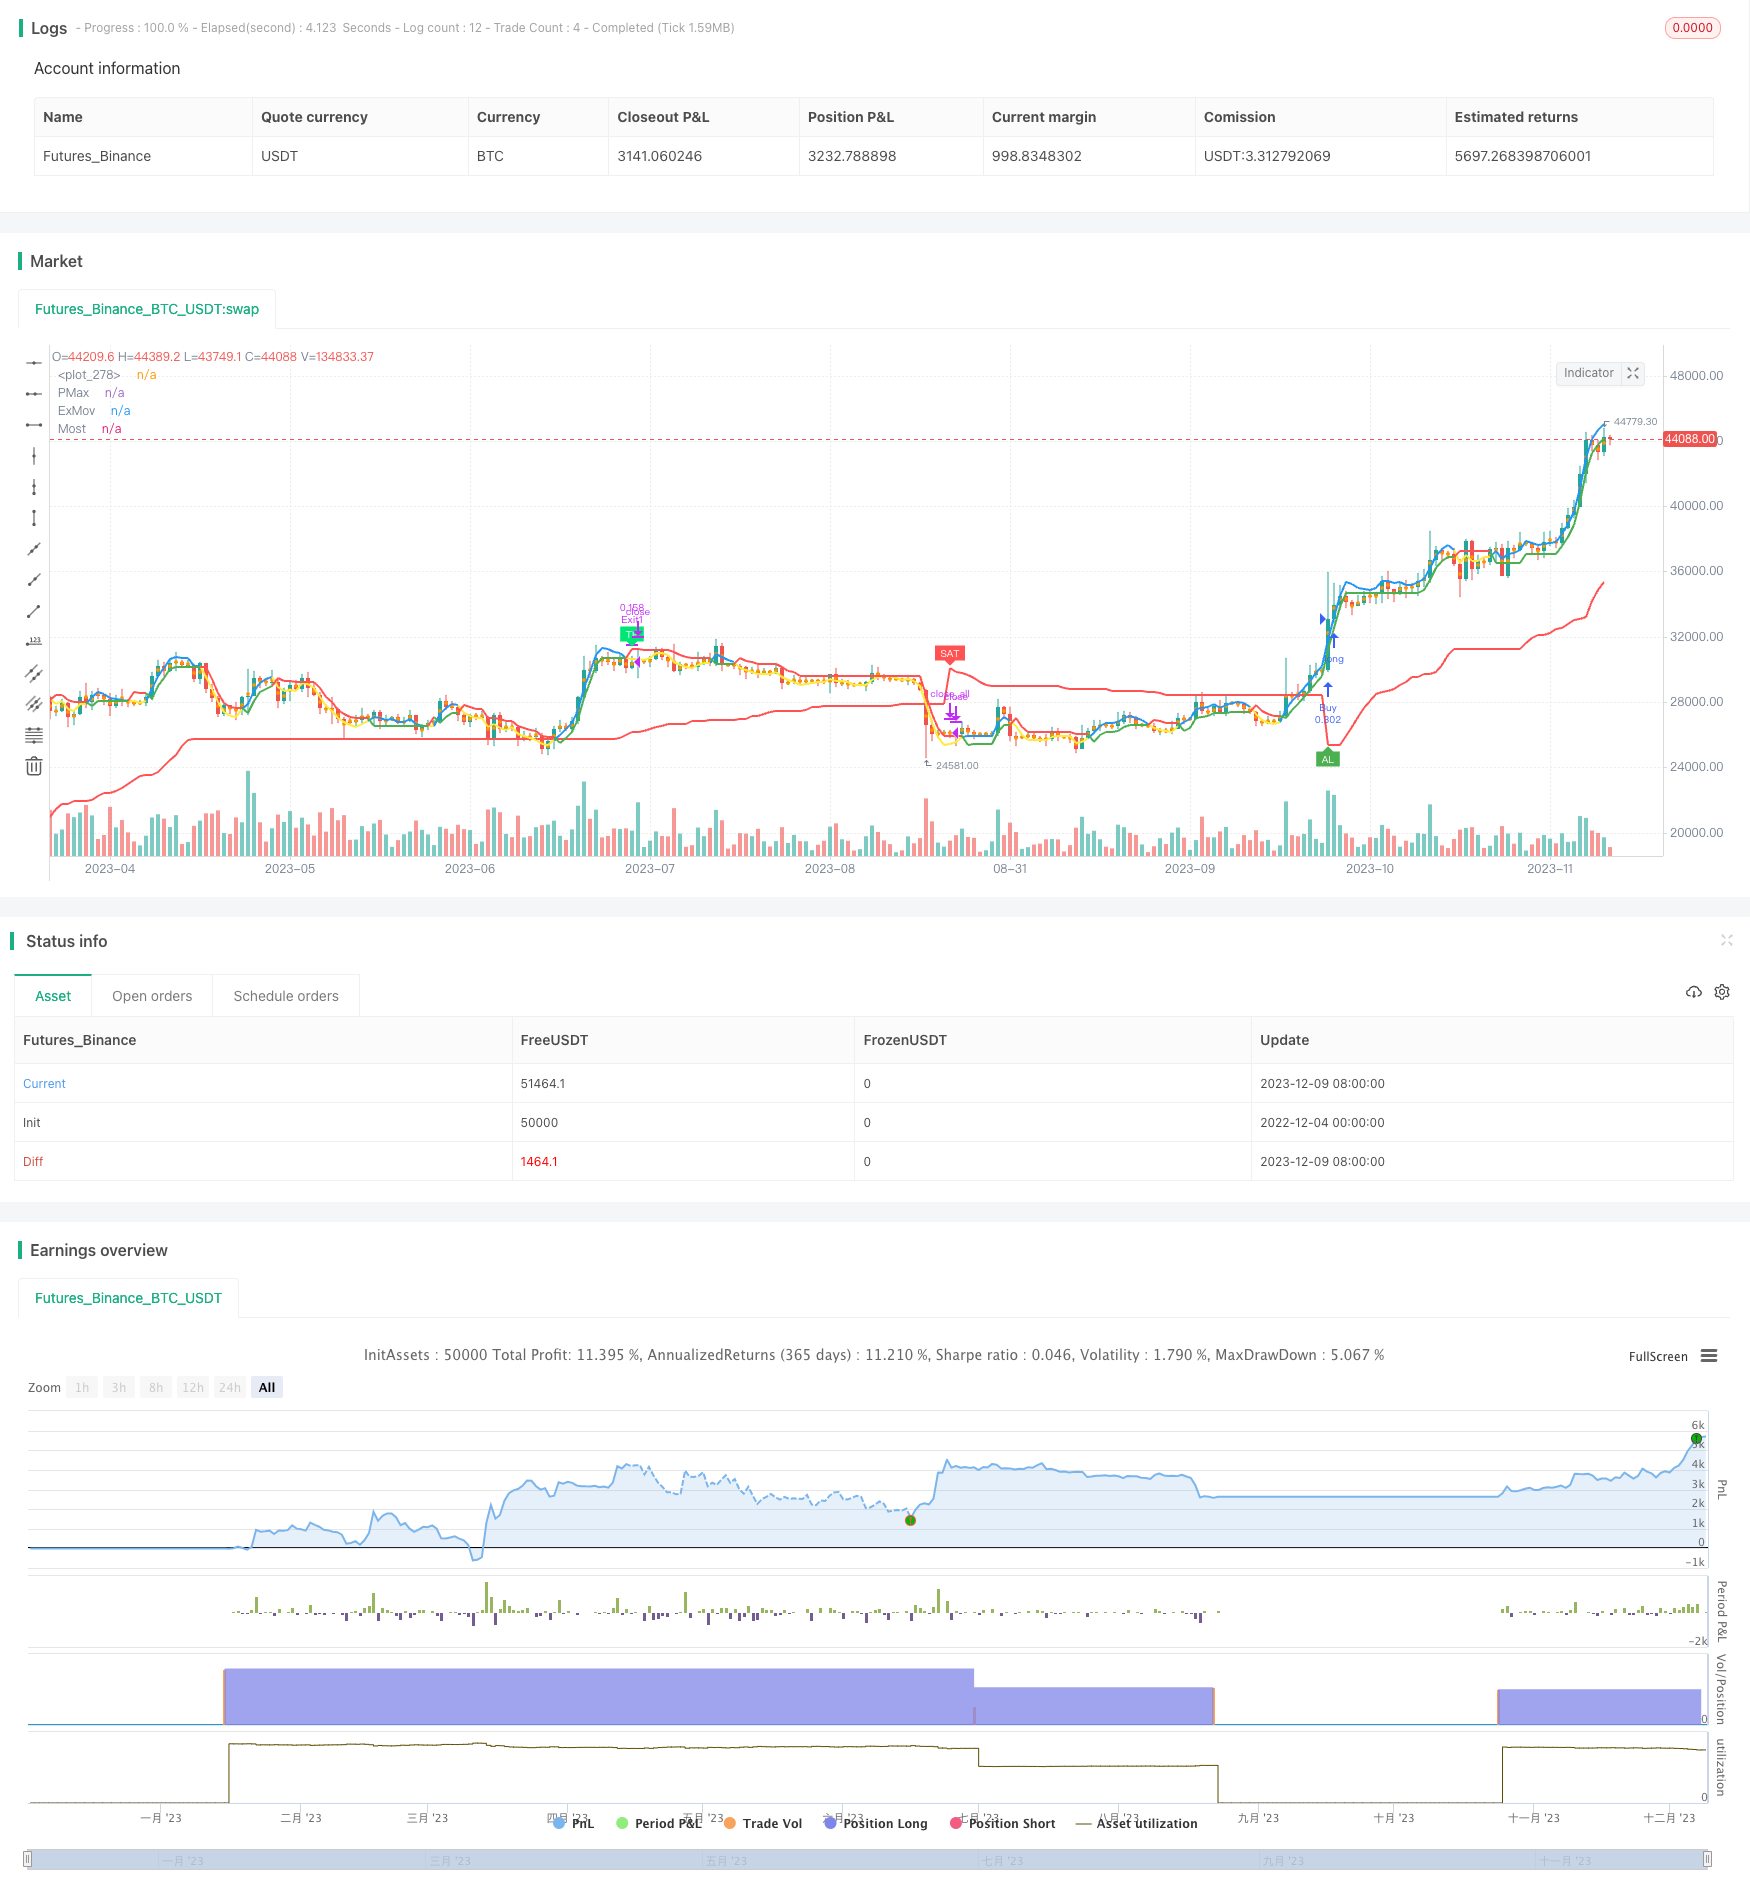
La idea central de esta estrategia es maximizar el valor del seguimiento de la pérdida móvil, complementado con filtros y métodos de parada para optimizar la entrada. La forma Y en el nombre de la estrategia representa la forma cruzada de la línea de señal de la estrategia.
Principio de estrategia
Esta estrategia se basa principalmente en la estrategia del explorador PMax de KivancOzbilgic, con algunas modificaciones.
PMax calculado basado en ATR y la media móvil. Genera una señal de compra cuando el precio cruza PMax.
Incorpora el indicador T3 y el precio como filtro para asegurar la entrada en una tendencia al alza.
Configuración del método de parada: configure la estrategia de doble BAND para determinar la primera parada; luego, mediante la estrategia de la cuchara, para determinar las paradas y los puntos de parada posteriores.
El indicador MOST ayuda a juzgar las tendencias para reducir las inversiones innecesarias.
Análisis de las ventajas
La estrategia PMax en sí misma tiene la ventaja de evitar la búsqueda de alto stop loss, y el mecanismo de stop loss móvil es más favorable para reducir el DD.
El doble filtro asegura la entrada sólo en la tendencia al alza, evitando falsas rupturas.
La configuración de múltiples puntos de parada permite una mayor flexibilidad en las ganancias.
El indicador MOST asegura que sólo se realicen operaciones múltiples y se evite el comercio inverso.
Análisis de riesgos
El PMax es algo retrasado en sí mismo, y es fácil que se pierda la primera brecha.
El exceso de configuración de filtros también puede hacer que se pierda el punto de entrada de oro.
Si se pone el tope demasiado optimista, los pedidos no se cumplen.
Las operaciones individuales son difíciles de rentabilizar en variedades con alta volatilidad.
Dirección de optimización
Los indicadores MACD de la clase de adherencia pueden ser probados para determinar el desvío a corto plazo para determinar el momento de entrada.
Se puede probar un filtro simplificado, conservando solo un indicador de filtro.
Se puede agregar un mecanismo de frenado de ajuste automático, ajustando el punto de frenado posterior según la volatilidad y la dinámica de la rentabilidad.
Se puede probar el vacío permitido y ajustar la proporción de posición según el filtro.
Resumir
La estrategia en su conjunto toma el juicio de entrada como el núcleo de PMax y diseña una multicapa de filtros y métodos de frenado para optimizar, obteniendo mejores ganancias en las variedades de tendencia. En el futuro, mediante la simplificación de los filtros, la optimización de la configuración de frenado y el ajuste adecuado de la administración de la posición, la estrategia puede ser optimizada para optimizar Parameter madura, adaptarse a más variedades, y obtener un mejor rendimiento en el disco real.
/*backtest
start: 2022-12-04 00:00:00
end: 2023-12-10 00:00:00
period: 1d
basePeriod: 1h
exchanges: [{"eid":"Futures_Binance","currency":"BTC_USDT"}]
*/

//@version=4
// This source code is subject to the terms of the Mozilla Public License 2.0 at https://mozilla.org/MPL/2.0/
// © KivancOzbilgic
//developer: @KivancOzbilgic
//author: @enesyetkin

strategy("Y-Profit Maximizer Strategy with Exit Points", shorttitle="Y-PMax Strategy with Exit Points", overlay=true, default_qty_type=strategy.cash, default_qty_value=10000, initial_capital=10000, currency=currency.USD, commission_value=0.1, commission_type=strategy.commission.percent)
baslik1 = input(title="-------------------- PMax Ayarları -------------------", defval=false)
src = input(hl2, title="Kaynak")
Periods = input(title="ATR uzunluğu", type=input.integer, defval=10)
Multiplier = input(title="ATR Multiplier", type=input.float, step=0.1, defval=3.0)
mav = input(title="Moving Average Tipi", defval="VAR", options=["SMA", "EMA", "WMA", "TMA", "VAR", "WWMA", "ZLEMA", "TSF"])
length =input(13, "Moving Average uzunluğu", minval=1)
filtrelemeacik = input(title="Filtreleme Açık/Kapalı", type=input.bool, defval=false)
filtreleme = input(title="Filtreleme T3/Src (T3 Açık/Src Kapalı)", type=input.bool, defval=false)
changeATR= input(title="ATR Hesaplama Yöntemi Değişsin mi?", type=input.bool, defval=true)
showsupport = input(title="Moving Average i göster?", type=input.bool, defval=false)
showsignalsk = input(title="Al Sat Sinyallerini göster?", type=input.bool, defval=true)
showsignalsc = input(title="Fiyat/Pmax kesişim sinyallerini göster?", type=input.bool, defval=false)
highlighting = input(title="Bulut Açık/Kapalı?", type=input.bool, defval=false)


baslik4 = input(title="-------------------- T3 Ayarları --------------------", defval=false)
length1 = input(89, "T3 Uzunluğu")
length2 = input(5, "T3 Filter Uzunluğu")
a1 = input(0.84, "T3 Volume Faktörü")
a13 = 0.84
length12 = input(5, "Fibo T3 Uzunluğu")
a12 = input(0.618, "T3 Fİbo Volume Faktörü")
T31Show = input(title="T3 ü göster?", type=input.bool, defval=false)
T32Show = input(title= "T3 filtreyi göster?", type=input.bool, defval=false)
T3FiboLine = input(false, title="T3 Fibonacci Oranlı Çizgiler?")

shownum = true

baslik7 = input(title="---------------- Take Profit Ayarları --------------", defval=false)

len = input(25, "Yılan Genişliği")
domcycle = input(20, minval=10, title="Dominant Döngü Genişliği")
rapida = input(8, "Hızlı Ort")
lenta = input(26, "Yavaş Ort")
stdv = input(0.8, "Genişlik")
tpfiltre = input(false, title="TP Filtresi avg2/avg4?")
tplevelshow = input(false, title="TP Level ve Exit Level Sayım Açık Kapalı?")
tp1show =  input(false, title="Erken TP Açık Kapalı")

baslik8 = input(title="------------------- MOST Ayarları ------------------", defval=false)

src_most=input(close,"Source")
AP2 = input(defval=8,title="Length",minval=1)
AF2 = input(defval=2,title="Percent",minval=0.1)/100
mav1 = input(title="Moving Average Tipi", defval="ZLEMovA", options=["EMovA","ZLEMovA"])
plotbuysell = input(true, "Al Sat Etiketleri", input.bool)


///T3 1&2
e1 = ema((high + low + 2 * close) / 4, length1)
e2 = ema(e1, length1)
e3 = ema(e2, length1)
e4 = ema(e3, length1)
e5 = ema(e4, length1)
e6 = ema(e5, length1)
c1 = -a1 * a1 * a1
c2 = 3 * a1 * a1 + 3 * a1 * a1 * a1
c3 = -6 * a1 * a1 - 3 * a1 - 3 * a1 * a1 * a1
c4 = 1 + 3 * a1 + a1 * a1 * a1 + 3 * a1 * a1
T3 = c1 * e6 + c2 * e5 + c3 * e4 + c4 * e3

e13 = ema((high + low + 2 * close) / 4, length2)
e23 = ema(e13, length2)
e33 = ema(e23, length2)
e43 = ema(e33, length2)
e53 = ema(e43, length2)
e63 = ema(e53, length2)
c13 = -a13 * a13 * a13
c23 = 3 * a13 * a13 + 3 * a13 * a13 * a13
c33 = -6 * a13 * a13 - 3 * a13 - 3 * a13 * a13 * a13
c43 = 1 + 3 * a13 + a13 * a13 * a13 + 3 * a13 * a13
T33 = c13 * e63 + c23 * e53 + c33 * e43 + c43 * e33


///PMax

atr2 = sma(tr, Periods)
atr= changeATR ? atr(Periods) : atr2
valpha=2/(length+1)
vud1=src>src[1] ? src-src[1] : 0
vdd1=src<src[1] ? src[1]-src : 0
vUD=sum(vud1,9)
vDD=sum(vdd1,9)
vCMO=nz((vUD-vDD)/(vUD+vDD))
VAR=0.0
VAR:=nz(valpha*abs(vCMO)*src)+(1-valpha*abs(vCMO))*nz(VAR[1])
wwalpha = 1/ length
WWMA = 0.0
WWMA := wwalpha*src + (1-wwalpha)*nz(WWMA[1])
zxLag = length/2==round(length/2) ? length/2 : (length - 1) / 2
zxEMAData = (src + (src - src[zxLag]))
ZLEMA = ema(zxEMAData, length)
lrc = linreg(src, length, 0)
lrc1 = linreg(src,length,1)
lrs = (lrc-lrc1)
TSF = linreg(src, length, 0)+lrs
getMA(src, length) =>
    ma = 0.0
    if mav == "SMA"
        ma := sma(src, length)
        ma

    if mav == "EMA"
        ma := ema(src, length)
        ma

    if mav == "WMA"
        ma := wma(src, length)
        ma

    if mav == "TMA"
        ma := sma(sma(src, ceil(length / 2)), floor(length / 2) + 1)
        ma

    if mav == "VAR"
        ma := VAR
        ma

    if mav == "WWMA"
        ma := WWMA
        ma

    if mav == "ZLEMA"
        ma := ZLEMA
        ma

    if mav == "TSF"
        ma := TSF
        ma

    if mav == "T3"
        ma := T3
        ma
    ma

MAvg=getMA(src, length)
longStop = MAvg - Multiplier*atr
longStopPrev = nz(longStop[1], longStop)
longStop := MAvg > longStopPrev ? max(longStop, longStopPrev) : longStop
shortStop = MAvg + Multiplier*atr
shortStopPrev = nz(shortStop[1], shortStop)
shortStop := MAvg < shortStopPrev ? min(shortStop, shortStopPrev) : shortStop
dir = 1
dir := nz(dir[1], dir)
dir := dir == -1 and MAvg > shortStopPrev ? 1 : dir == 1 and MAvg < longStopPrev ? -1 : dir
PMax = dir==1 ? longStop: shortStop


///MOST
zxLag1 = AP2/2==round(AP2/2) ? AP2/2 : (AP2 - 1) / 2
zxEMAData1 = (src_most + (src_most - src_most[zxLag1]))
ZLEMA1 = ema(zxEMAData1, AP2)

getMA1(src, length) =>
    ma1 = 0.0
    if mav1 == "EMovA"
        ma1 := ema(close, 8)
        ma1

    if mav1 == "ZLEMovA"
        ma1 := ZLEMA1
        ma1

Trail1 = getMA1(src, length)
SL2 = Trail1*AF2 // Stop Loss

Trail2 = 0.0
Trail2 := iff(Trail1>nz(Trail2[1],0) and Trail1[1]>nz(Trail2[1],0),max(nz(Trail2[1],0),Trail1-SL2),iff(Trail1<nz(Trail2[1],0) and Trail1[1]<nz(Trail2[1],0),min(nz(Trail2[1],0),Trail1+SL2),iff(Trail1>nz(Trail2[1],0),Trail1-SL2,Trail1+SL2)))

Buy = crossover(Trail1, Trail2)
Sell = crossunder(Trail1, Trail2)
SR=(iff(Trail1 > Trail2 ,1, iff(Trail2 > Trail1,-1,0)))


////T3 TILLSON 1


col1 = T3 > T3[1]
col3 = T3 < T3[1]
col4 = T33 > T33[1]
col5 = T33 < T33[1]
color_1 = col1 ? color.green : col3 ? color.red : color.yellow
color_4 = col4 ? color.green : col5 ? color.red : color.yellow


e12 = ema((high + low + 2 * close) / 4, length12)
e22 = ema(e12, length12)
e32 = ema(e22, length12)
e42 = ema(e32, length12)
e52 = ema(e42, length12)
e62 = ema(e52, length12)
c12 = -a12 * a12 * a12
c22 = 3 * a12 * a12 + 3 * a12 * a12 * a12
c32 = -6 * a12 * a12 - 3 * a12 - 3 * a12 * a12 * a12
c42 = 1 + 3 * a12 + a12 * a12 * a12 + 3 * a12 * a12
T32 = c12 * e62 + c22 * e52 + c32 * e42 + c42 * e32

col12 = T32 > T32[1]
col32 = T32 < T32[1]


///TP BB ve SNAKE

h = ema(high, len)
l = ema(low, len)

hp = h / h[len]
lp = l / l[len]

avg = avg(hp, lp)

havg = ema(highest(avg, len), len)
lavg = ema(lowest(avg, len), len)

avg2 = avg(havg, lavg)
avg3 = avg(havg, avg2)
avg4 = avg(havg, avg3)

dif = havg - avg2

ust = havg + dif
alt = lavg - dif

///BB on MACD

SDev = 0.0
banda_supe = 0.0
banda_inf = 0.0
m_rapida = ema(close,rapida)
m_lenta = ema(close,lenta)
BBMacd = m_rapida - m_lenta
Avg = ema(BBMacd,9)
SDev := stdev(BBMacd,9)
banda_supe := Avg + stdv * SDev
banda_inf := Avg - stdv * SDev

color2 = col12 ? color.blue : col32 ? color.purple : color.yellow

TS1 = plot(Trail1, "ExMov", style=plot.style_line,color=Trail1 > Trail2 ? color.blue : color.yellow, linewidth=2)
TS2 = plot(Trail2, "Most", style=plot.style_line,color=Trail1 > Trail2 ? color.green : color.red, linewidth=2)


tp1 = tpfiltre ? crossunder(BBMacd,banda_supe)  and (avg>avg2) and (MAvg>PMax) and nz(MAvg[10]) > nz(PMax[10]) : crossunder(BBMacd,banda_supe)  and (avg>avg4) and (MAvg>PMax) and nz(MAvg[15]) > nz(PMax[15])
plotshape(tp1 and tp1show, title="TP1", text="TP1", location=location.abovebar, style=shape.labeldown, size=size.tiny, color=color.aqua, textcolor=color.white,transp=0)

plot(T31Show ? T3 : na, color=color_1, linewidth=3, title="T3")
plot(T32Show ? T33 : na, color=color_4, linewidth=3, title="T3 Filter")
plot(T3FiboLine and T32 ? T32 : na, color=color2, linewidth=2, title="T3fibo")
plot(showsupport ? MAvg : na, color=#0585E1, linewidth=2, title="Moving Avg Line")
pALL=plot(PMax, color=color.red, linewidth=2, title="PMax", transp=100)
alertcondition(crossover(MAvg, PMax), title="1- Alım Sinyali", message="{{ticker}}, kapanış fiyatı = {{close}} için Alım Sinyali!")
alertcondition(crossunder(MAvg, PMax), title="2- Satım Sinyali", message="{{ticker}}, kapanış fiyatı = {{close}} için Satım Sinyali!")


buySignalk = filtrelemeacik ? filtreleme ? (crossover(MAvg, PMax) and T33>T3) : (crossover(MAvg, PMax) and src>T3): crossover(MAvg, PMax)


plotshape(buySignalk and showsignalsk ? PMax*0.995 : na, title="AL", text="AL", location=location.absolute, style=shape.labelup, size=size.tiny, color=color.green, textcolor=color.white, transp=0)
sellSignallk = crossunder(MAvg, PMax)
plotshape(sellSignallk and showsignalsk ? PMax*1.005 : na, title="Sat", text="SAT", location=location.absolute, style=shape.labeldown, size=size.tiny, color=color.red, textcolor=color.white, transp=0)
buySignalc = crossover(src, PMax)
plotshape(buySignalc and showsignalsc ? PMax*0.995 : na, title="AL-Fiyat", text="AL", location=location.absolute, style=shape.labelup, size=size.tiny, color=#0F18BF, textcolor=color.white, transp=0)
sellSignallc = crossunder(src, PMax)
plotshape(sellSignallc and showsignalsc ? PMax*1.005 : na, title="Sat-Fiyat", text="SAT", location=location.absolute, style=shape.labeldown, size=size.tiny, color=#0F18BF, textcolor=color.white, transp=0)
mPlot = plot(ohlc4, title="", style=plot.style_circles, linewidth=0,display=display.none)
longFillColor = highlighting ? (MAvg>PMax ? color.green : na) : na
shortFillColor = highlighting ? (MAvg<PMax ? color.red : na) : na
fill(mPlot, pALL, title="Yükseliş Trend Bulutu", color=longFillColor)
fill(mPlot, pALL, title="Düşüş Trend Bulutu", color=shortFillColor)


tplevel = 0
//tplevel := tp1 ? nz(tplevel[1])==0 ? 1 : nz(tplevel[1])==1 ? 2 : 0 : nz(tplevel[1])==0 ? 0 : nz(tplevel[1])==1 ? 1 : nz(tplevel[1])==2 ? 2 : sellSignallk ? 0 : 0
//tplevel := sellSignallk or MAvg < PMax ? 0 : tp1 and nz(tplevel[1])==8 ? 9 : tp1 and nz(tplevel[1])==7 ? 8 : tp1 and nz(tplevel[1])==6 ? 7 : tp1 and nz(tplevel[1])==5 ? 6 : tp1 and nz(tplevel[1])==4 ? 5 : tp1 and nz(tplevel[1])==3 ? 4 : tp1 and nz(tplevel[1])==2 ? 3 : tp1 and nz(tplevel[1])==1 ? 2 : nz(tplevel[1])==1 ? 1 : nz(tplevel[1])==2 ? 2 : nz(tplevel[1])==3 ? 3 : nz(tplevel[1])==4 ? 4 : nz(tplevel[1])==5 ? 5 : nz(tplevel[1])==6 ? 6 : nz(tplevel[1])==7 ? 7 : nz(tplevel[1])==8 ? 8 : nz(tplevel[1])==9 ? 9 : 1
tplevel := sellSignallk or MAvg < PMax ? 0 : Trail1 < Trail2 ? 0 : tp1 and nz(tplevel[1])==1 ? 2 : nz(tplevel[1])==1 ? 1 : nz(tplevel[1])==2 ? 2 : 1

exitlevel = 0

exitlevel := sellSignallk or MAvg < PMax ? 0 : Sell and  nz(tplevel[1])==2 and nz(exitlevel[1])==1 ? 2 : Sell and  nz(tplevel[1])==2 and nz(exitlevel[1])==2 ? 3 : Sell and  nz(tplevel[1])==2 and nz(exitlevel[1])==3 ? 4 :  Sell and  nz(tplevel[1])==2 and nz(exitlevel[1])==4 ? 5: nz(exitlevel[1])==1 ? 1  : nz(exitlevel[1])==2 ? 2 : nz(exitlevel[1])==3 ? 3 : nz(exitlevel[1])==4 ? 4 : nz(exitlevel[1])==5 ? 5:  1

plotchar(tplevel==0 and tplevelshow, char='0', color=color.green)
plotchar(tplevel==1 and tplevelshow , char='1', color=color.green)
plotchar(tplevel==2 and tplevelshow, char='2', color=color.green)


plotshape(exitlevel==0 and tplevelshow , text='0', location=location.belowbar, style=shape.triangledown, color=color.red)
plotshape(exitlevel==1 and tplevelshow , text='1', location=location.belowbar, style=shape.triangledown, color=color.red)
plotshape(exitlevel==2 and tplevelshow , text='2', location=location.belowbar, style=shape.triangledown, color=color.red)
plotshape(exitlevel==3 and tplevelshow , text='3', location=location.belowbar, style=shape.triangledown, color=color.red)
plotshape(exitlevel==4 and tplevelshow , text='4', location=location.belowbar, style=shape.triangledown, color=color.red)
plotshape(exitlevel==5 and tplevelshow , text='5', location=location.belowbar, style=shape.triangledown, color=color.red)

plotshape(nz(tplevel[1])==2 and Sell and exitlevel>=2, title="TP", text="TP", location=location.abovebar, style=shape.labeldown, size=size.tiny, color=color.lime, textcolor=color.white,transp=0)

if (buySignalk)
    strategy.entry("Buy", strategy.long)

if nz(tplevel[1])==2 and Sell and exitlevel==2
    strategy.exit ("Exit1", from_entry="Buy", limit=close, qty_percent = 33.3)

//if nz(tplevel[1])==2 and Sell and exitlevel==3
  //  strategy.exit ("Exit2", from_entry="Buy", limit=close, qty_percent = 33.3)

if nz(tplevel[1])==2 and Sell and exitlevel==3
    strategy.exit ("Exit2", from_entry="Buy", limit=close, qty_percent = 50)

if nz(tplevel[1])==2 and Sell and exitlevel==4
    strategy.exit ("Exit3", from_entry="Buy", limit=close)


if (sellSignallk)
    strategy.close_all()