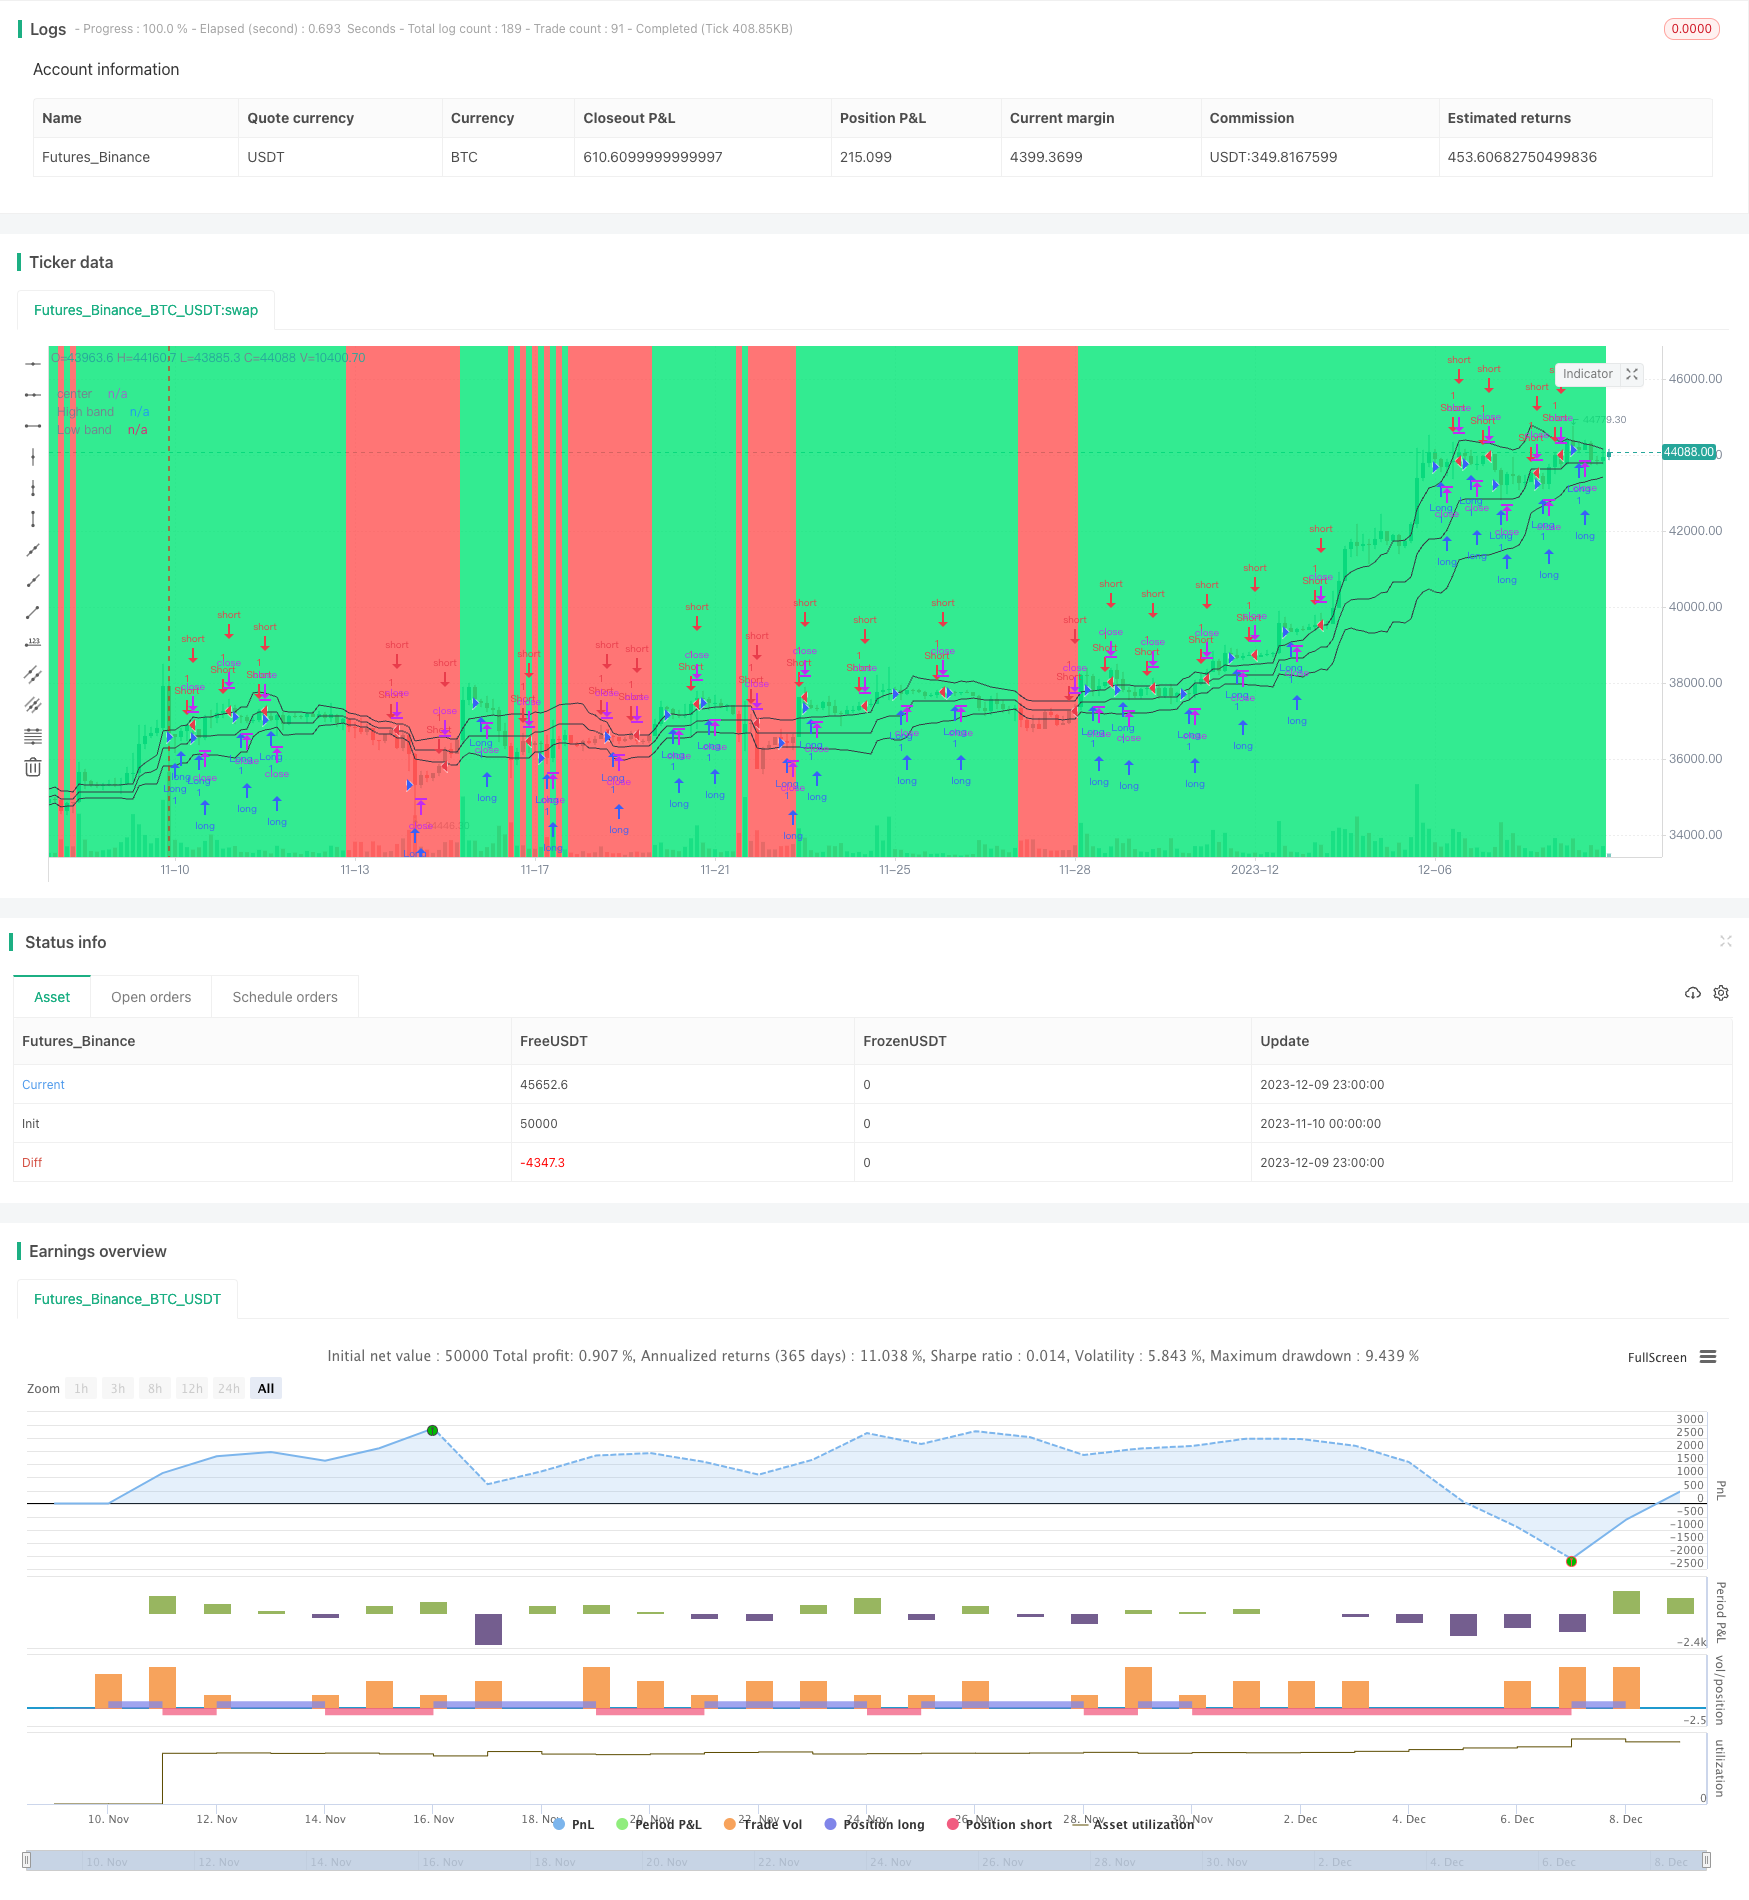
Estrategia de scalping del canal de volatilidad de Noro

Descripción general
La estrategia de Noro’s Price Channel Scalping es una estrategia de negociación de scalping basada en canales de precios y bandas de fluctuación de precios. La estrategia utiliza los canales de precios y las fluctuaciones de precios para identificar las tendencias del mercado y entrar en el mercado cuando se produce un cambio en la dirección de la tendencia.
Principio de estrategia
La estrategia primero calcula los canales de precios más altos (lasthigh) y más bajos (lastlow), y luego calcula la línea media de la línea media (center). Luego calcula la distancia entre el precio y la línea media (dist) y el promedio móvil simple de la distancia (distsma). De acuerdo con esto, se pueden calcular bandas de fluctuación de precios 1x (hd y ld) y 2x (hd2 y ld2) de la línea media.
Cuando el precio cruza una banda de fluctuación superior a 1 vez la distancia de la línea media, se juzga como un bullish, y cuando el precio cruza una banda de fluctuación inferior a 1 vez la distancia de la línea media, se juzga como un bearish. La estrategia se ejecuta al abrir posiciones en reversa cuando aparecen signos de decaimiento. Por ejemplo, en una tendencia de bullish, si aparecen dos líneas de sol, se hace una posición en blanco cuando se cierra la segunda línea de sol; en una tendencia de bearish, si aparecen dos líneas de sol, se hace más en la segunda línea de sol.
Ventajas estratégicas
- Utilice el canal de precios para determinar la dirección de las tendencias del mercado y evitar transacciones erróneas
- En el caso de los precios, se puede evaluar si la tendencia se está desvaneciendo o no, y se puede capturar con precisión el punto de inflexión
- El método de negociación de scalping para ganar dinero rápido
Riesgo estratégico
- Los canales de precios y las bandas de fluctuación pueden fallar cuando los precios fluctúan mucho
- Las operaciones de scalping requieren una mayor frecuencia de operaciones, lo que aumenta los costos de las operaciones y el riesgo de deslizamiento.
- Las estrategias de detención de pérdidas deben considerarse para controlar el riesgo de pérdidas
Optimización de la estrategia
- Optimización de los parámetros de los canales y bandas de fluctuación de precios para adaptarse a más situaciones de mercado
- Indicadores de tendencias y puntos de inflexión combinados con otros
- Aumentar las estrategias de alto riesgo
- Tener en cuenta los costos de transacción y el impacto de los puntos de deslizamiento
Resumir
La estrategia de Noro Wave Channel Scalping es, en general, una estrategia muy adecuada para el comercio de scalping. Utiliza los canales de precios y las bandas de fluctuación para evaluar el movimiento del mercado y abrir posiciones al revés cuando aparecen signos de pico o de fondo. La estrategia tiene una alta frecuencia de operaciones y beneficios rápidos, pero también se enfrenta a un cierto riesgo.
/*backtest
start: 2023-11-10 00:00:00
end: 2023-12-10 00:00:00
period: 3h
basePeriod: 15m
exchanges: [{"eid":"Futures_Binance","currency":"BTC_USDT"}]
*/


//@version=2
strategy("Noro's Bands Scalper Strategy v1.0", shorttitle = "Scalper str 1.0", overlay=true, default_qty_type = strategy.percent_of_equity, default_qty_value=100.0, pyramiding=0)

//Settings
needlong = input(true, defval = true, title = "Long")
needshort = input(true, defval = true, title = "Short")
len = input(20, defval = 20, minval = 2, maxval = 200, title = "Period")
needbb = input(true, defval = true, title = "Show Bands")
needbg = input(true, defval = true, title = "Show Background")
src = close

//PriceChannel
lasthigh = highest(src, len)
lastlow = lowest(src, len)
center = (lasthigh + lastlow) / 2

//Distance
dist = abs(src - center)
distsma = sma(dist, len)
hd = center + distsma
ld = center - distsma
hd2 = center + distsma * 2
ld2 = center - distsma * 2

//Trend
trend = close < ld and high < hd ? -1 : close > hd and low > ld ? 1 : trend[1]

//Lines
colo = needbb == false ? na : black
plot(hd, color = colo, linewidth = 1, transp = 0, title = "High band")
plot(center, color = colo, linewidth = 1, transp = 0, title = "center")
plot(ld, color = colo, linewidth = 1, transp = 0, title = "Low band")

//Background
col = needbg == false ? na : trend == 1 ? lime : red
bgcolor(col, transp = 80)

//Signals
bar = close > open ? 1 : close < open ? -1 : 0
up7 = trend == 1 and bar == -1 and bar[1] == -1 ? 1 : 0
dn7 = trend == 1 and bar == 1 and bar[1] == 1 and close > strategy.position_avg_price ? 1 : 0
up8 = trend == -1 and bar == -1 and bar[1] == -1 and close < strategy.position_avg_price ? 1 : 0
dn8 = trend == -1 and bar == 1 and bar[1] == 1 ? 1 : 0

if up7 == 1 or up8 == 1
    strategy.entry("Long", strategy.long, needlong == false ? 0 : trend == -1 ? 0 : na)

if dn7 == 1 or dn8 == 1
    strategy.entry("Short", strategy.short, needshort == false ? 0 : trend == 1 ? 0 : na)