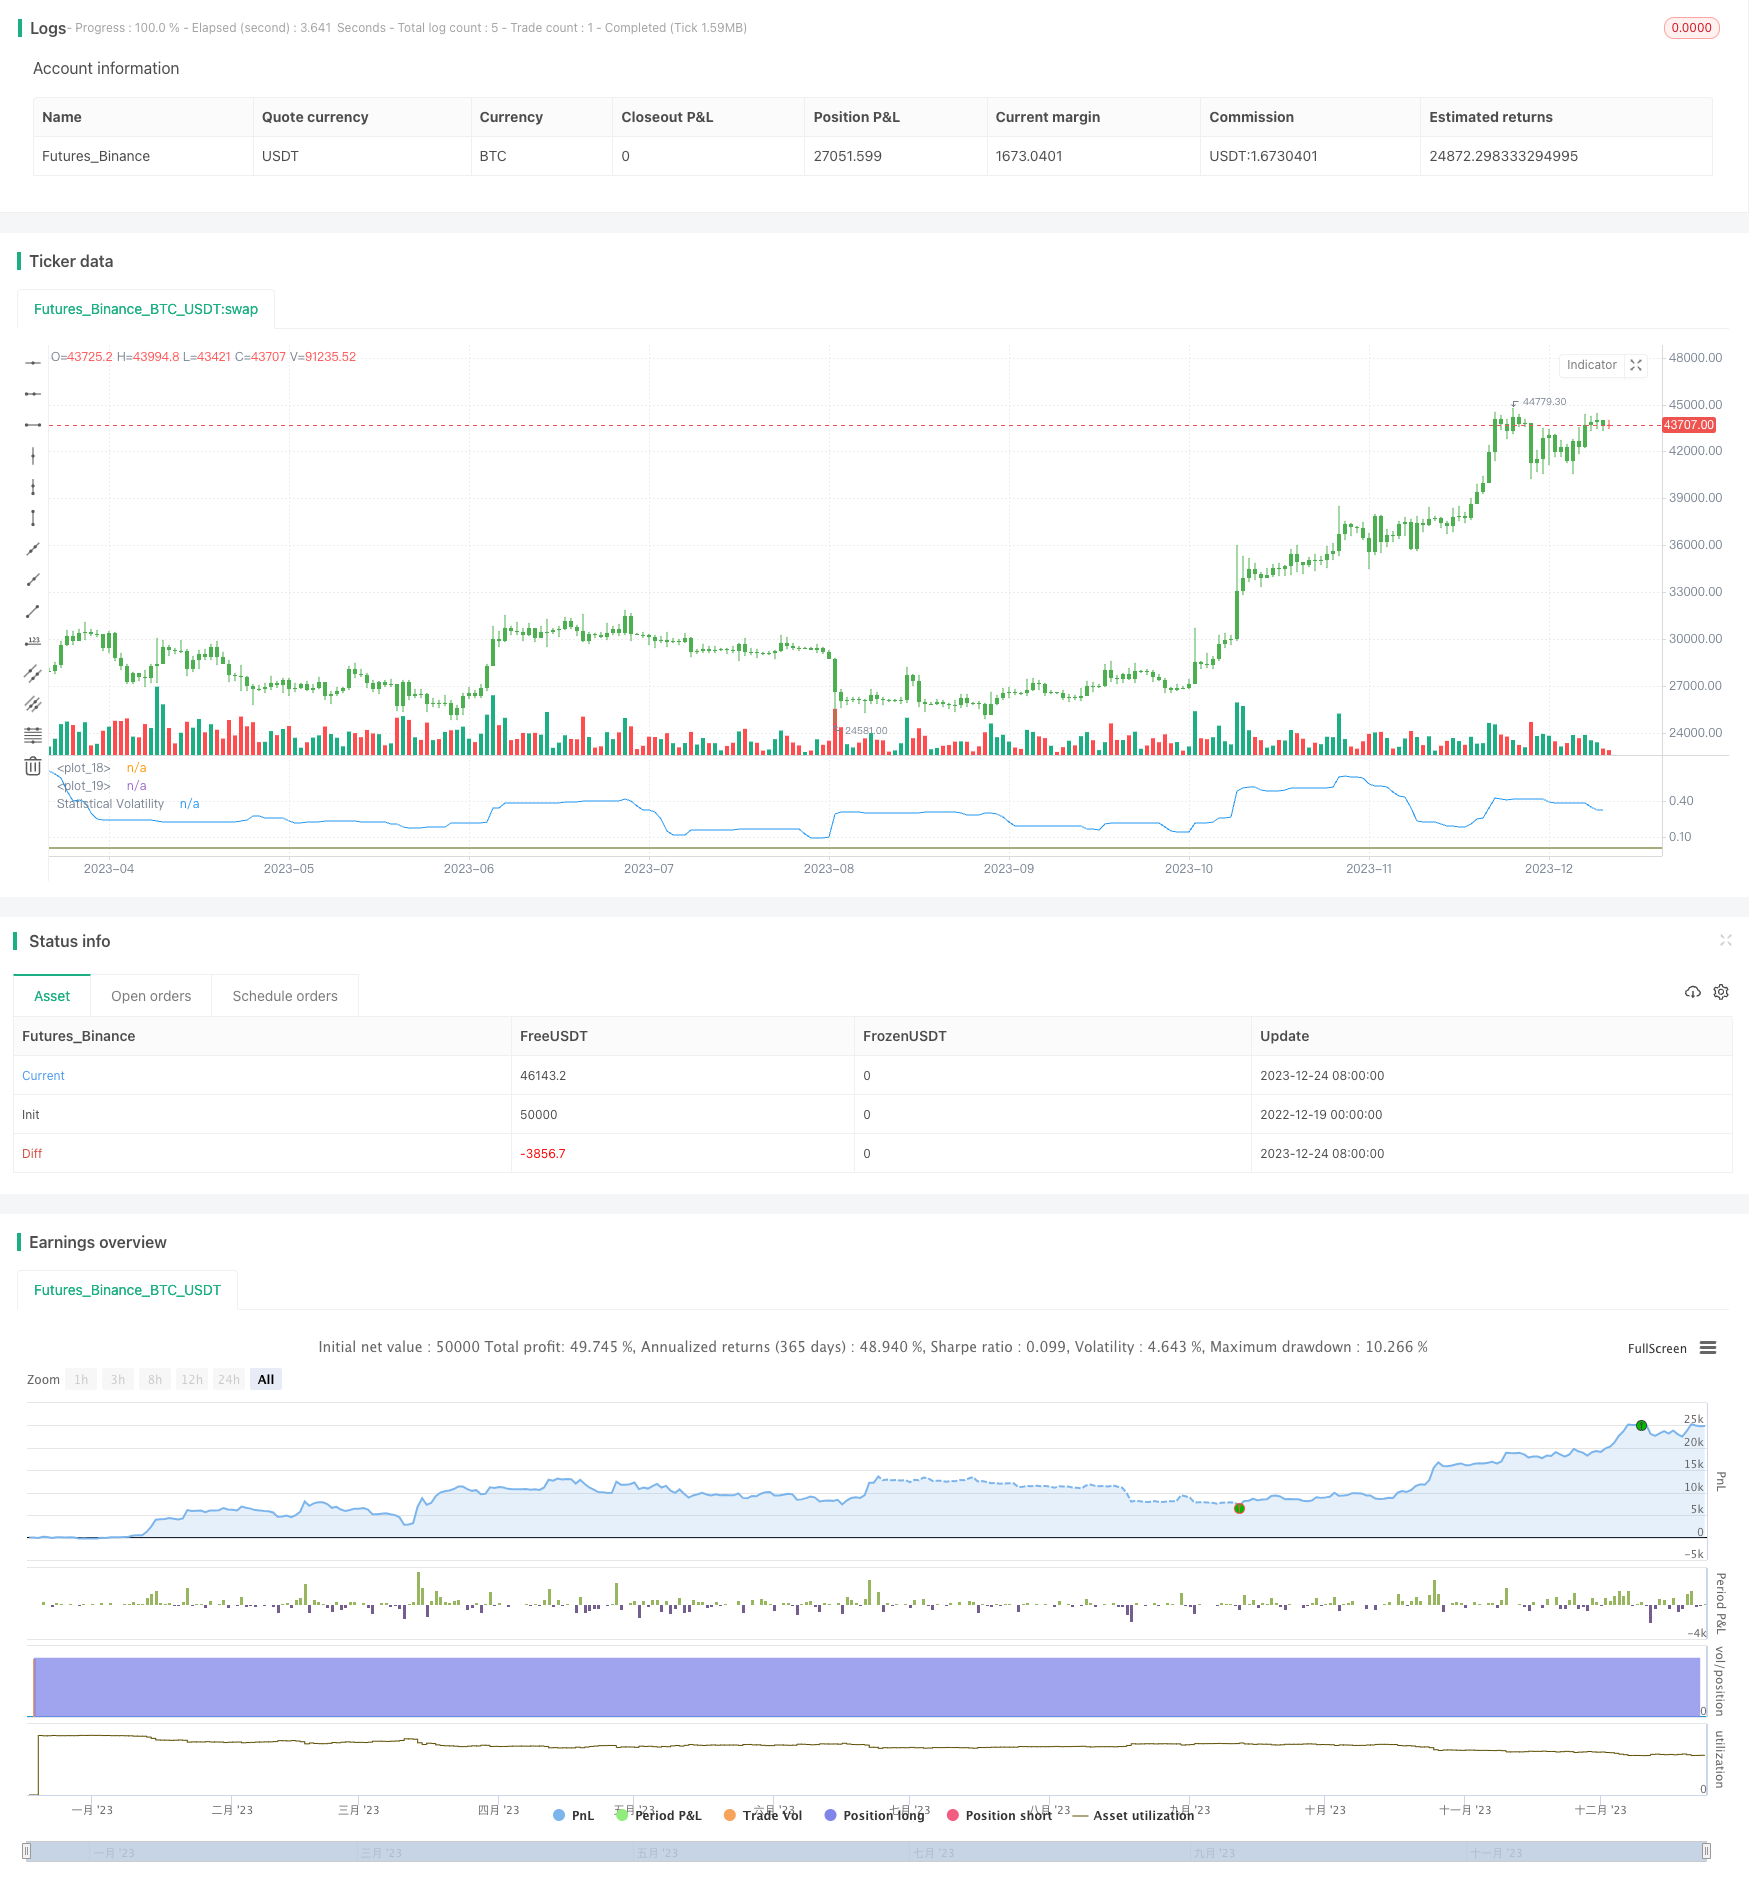
Estrategia de backtesting de volatilidad estadística basada en el método de valor extremo

Descripción general
Esta estrategia utiliza el método de extrema volatilidad para calcular la tasa de fluctuación estadística, también conocida como tasa de fluctuación histórica. Se basa en los extremos de los precios máximos, mínimos y de cierre, combinados con factores de tiempo, para calcular la tasa de fluctuación estadística.
Principio de estrategia
Calcula los máximos de los precios máximos, mínimos y cierre en un período de tiempo determinado
Aplicación de la fórmula de extrema valoración para calcular la volatilidad estadística
SqrTime = sqrt(253 / Length)
Vol = ((0.6 * log(xMaxC / xMinC) * SqrTime) + (0.6 * log(xMaxH / xMinL) * SqrTime)) * 0.5
Compara la volatilidad con el umbral establecido para generar una señal de negociación
pos = iff(nRes > TopBand, 1,
         iff(nRes < LowBand, -1, nz(pos[1], 0)))
Hacer más o menos dependiendo de las señales de negociación
Análisis de las ventajas
Las principales ventajas de esta estrategia son:
- El uso de indicadores de volatilidad estadística permite capturar con eficacia los puntos calientes y las oportunidades de reversión del mercado.
- Calculación de la volatilidad por el método de valores extremos, menos sensible a los precios extremos, con resultados más estables y confiables
- Se puede negociar en diferentes entornos de volatilidad ajustando los parámetros
Análisis de riesgos
Los principales riesgos de esta estrategia son los siguientes:
- La fluctuación estadística en sí misma es algo retrasada y no puede capturar con precisión el punto de inflexión del mercado
- Los indicadores de volatilidad son lentos para reaccionar a eventos inesperados y pueden perder oportunidades de comercio a corto plazo
- Existen ciertos riesgos de transacciones erróneas y riesgos de pérdidas
La respuesta y la solución:
- Reducir adecuadamente el ciclo estadístico y aumentar la sensibilidad a los cambios en el mercado
- En combinación con otros indicadores como auxiliares para mejorar la precisión de la señal
- Establecer un punto de parada para controlar las pérdidas individuales
Dirección de optimización
Las direcciones de optimización de esta estrategia son:
- Prueba diferentes parámetros de ciclo estadístico para encontrar el parámetro óptimo
- Agrega un módulo de administración de posiciones para ajustar las posiciones según la volatilidad
- Indicadores como las medias móviles, para establecer condiciones de filtración y reducir las transacciones erróneas
Resumir
Esta estrategia utiliza el método de extremo valor para calcular la volatilidad estadística y generar señales de negociación mediante la captura de la inestabilidad de la volatilidad. En comparación con indicadores como la media móvil simple, es más capaz de reflejar la volatilidad del mercado y capturar la inversión. Al mismo tiempo, el algoritmo de extremo valor también hace que los resultados sean más estables y confiables.
/*backtest
start: 2022-12-19 00:00:00
end: 2023-12-25 00:00:00
period: 1d
basePeriod: 1h
exchanges: [{"eid":"Futures_Binance","currency":"BTC_USDT"}]
*/

//@version=2
////////////////////////////////////////////////////////////
//  Copyright by HPotter v1.0 22/11/2014
// This indicator used to calculate the statistical volatility, sometime
// called historical volatility, based on the Extreme Value Method.
// Please use this link to get more information about Volatility.
//
// You can change long to short in the Input Settings
// WARNING:
// - For purpose educate only
// - This script to change bars colors.
////////////////////////////////////////////////////////////
strategy(title="Statistical Volatility - Extreme Value Method ", shorttitle="Statistical Volatility Backtest")
Length = input(30, minval=1)
TopBand = input(0.005, step=0.001)
LowBand = input(0.0016, step=0.001)
reverse = input(false, title="Trade reverse")
hline(TopBand, color=red, linestyle=line)
hline(LowBand, color=green, linestyle=line)
xMaxC = highest(close, Length)
xMaxH = highest(high, Length)
xMinC = lowest(close, Length)
xMinL = lowest(low, Length)
SqrTime = sqrt(253 / Length)
Vol = ((0.6 * log(xMaxC / xMinC) * SqrTime) + (0.6 * log(xMaxH / xMinL) * SqrTime)) * 0.5
nRes = iff(Vol < 0,  0, iff(Vol > 2.99, 2.99, Vol))
pos = iff(nRes > TopBand, 1,
	   iff(nRes < LowBand, -1, nz(pos[1], 0)))
possig = iff(reverse and pos == 1, -1,
          iff(reverse and pos == -1, 1, pos))
if (possig == 1)
    strategy.entry("Long", strategy.long)
if (possig == -1)
    strategy.entry("Short", strategy.short)
barcolor(possig == -1 ? red: possig == 1 ? green : blue )
plot(nRes, color=blue, title="Statistical Volatility")