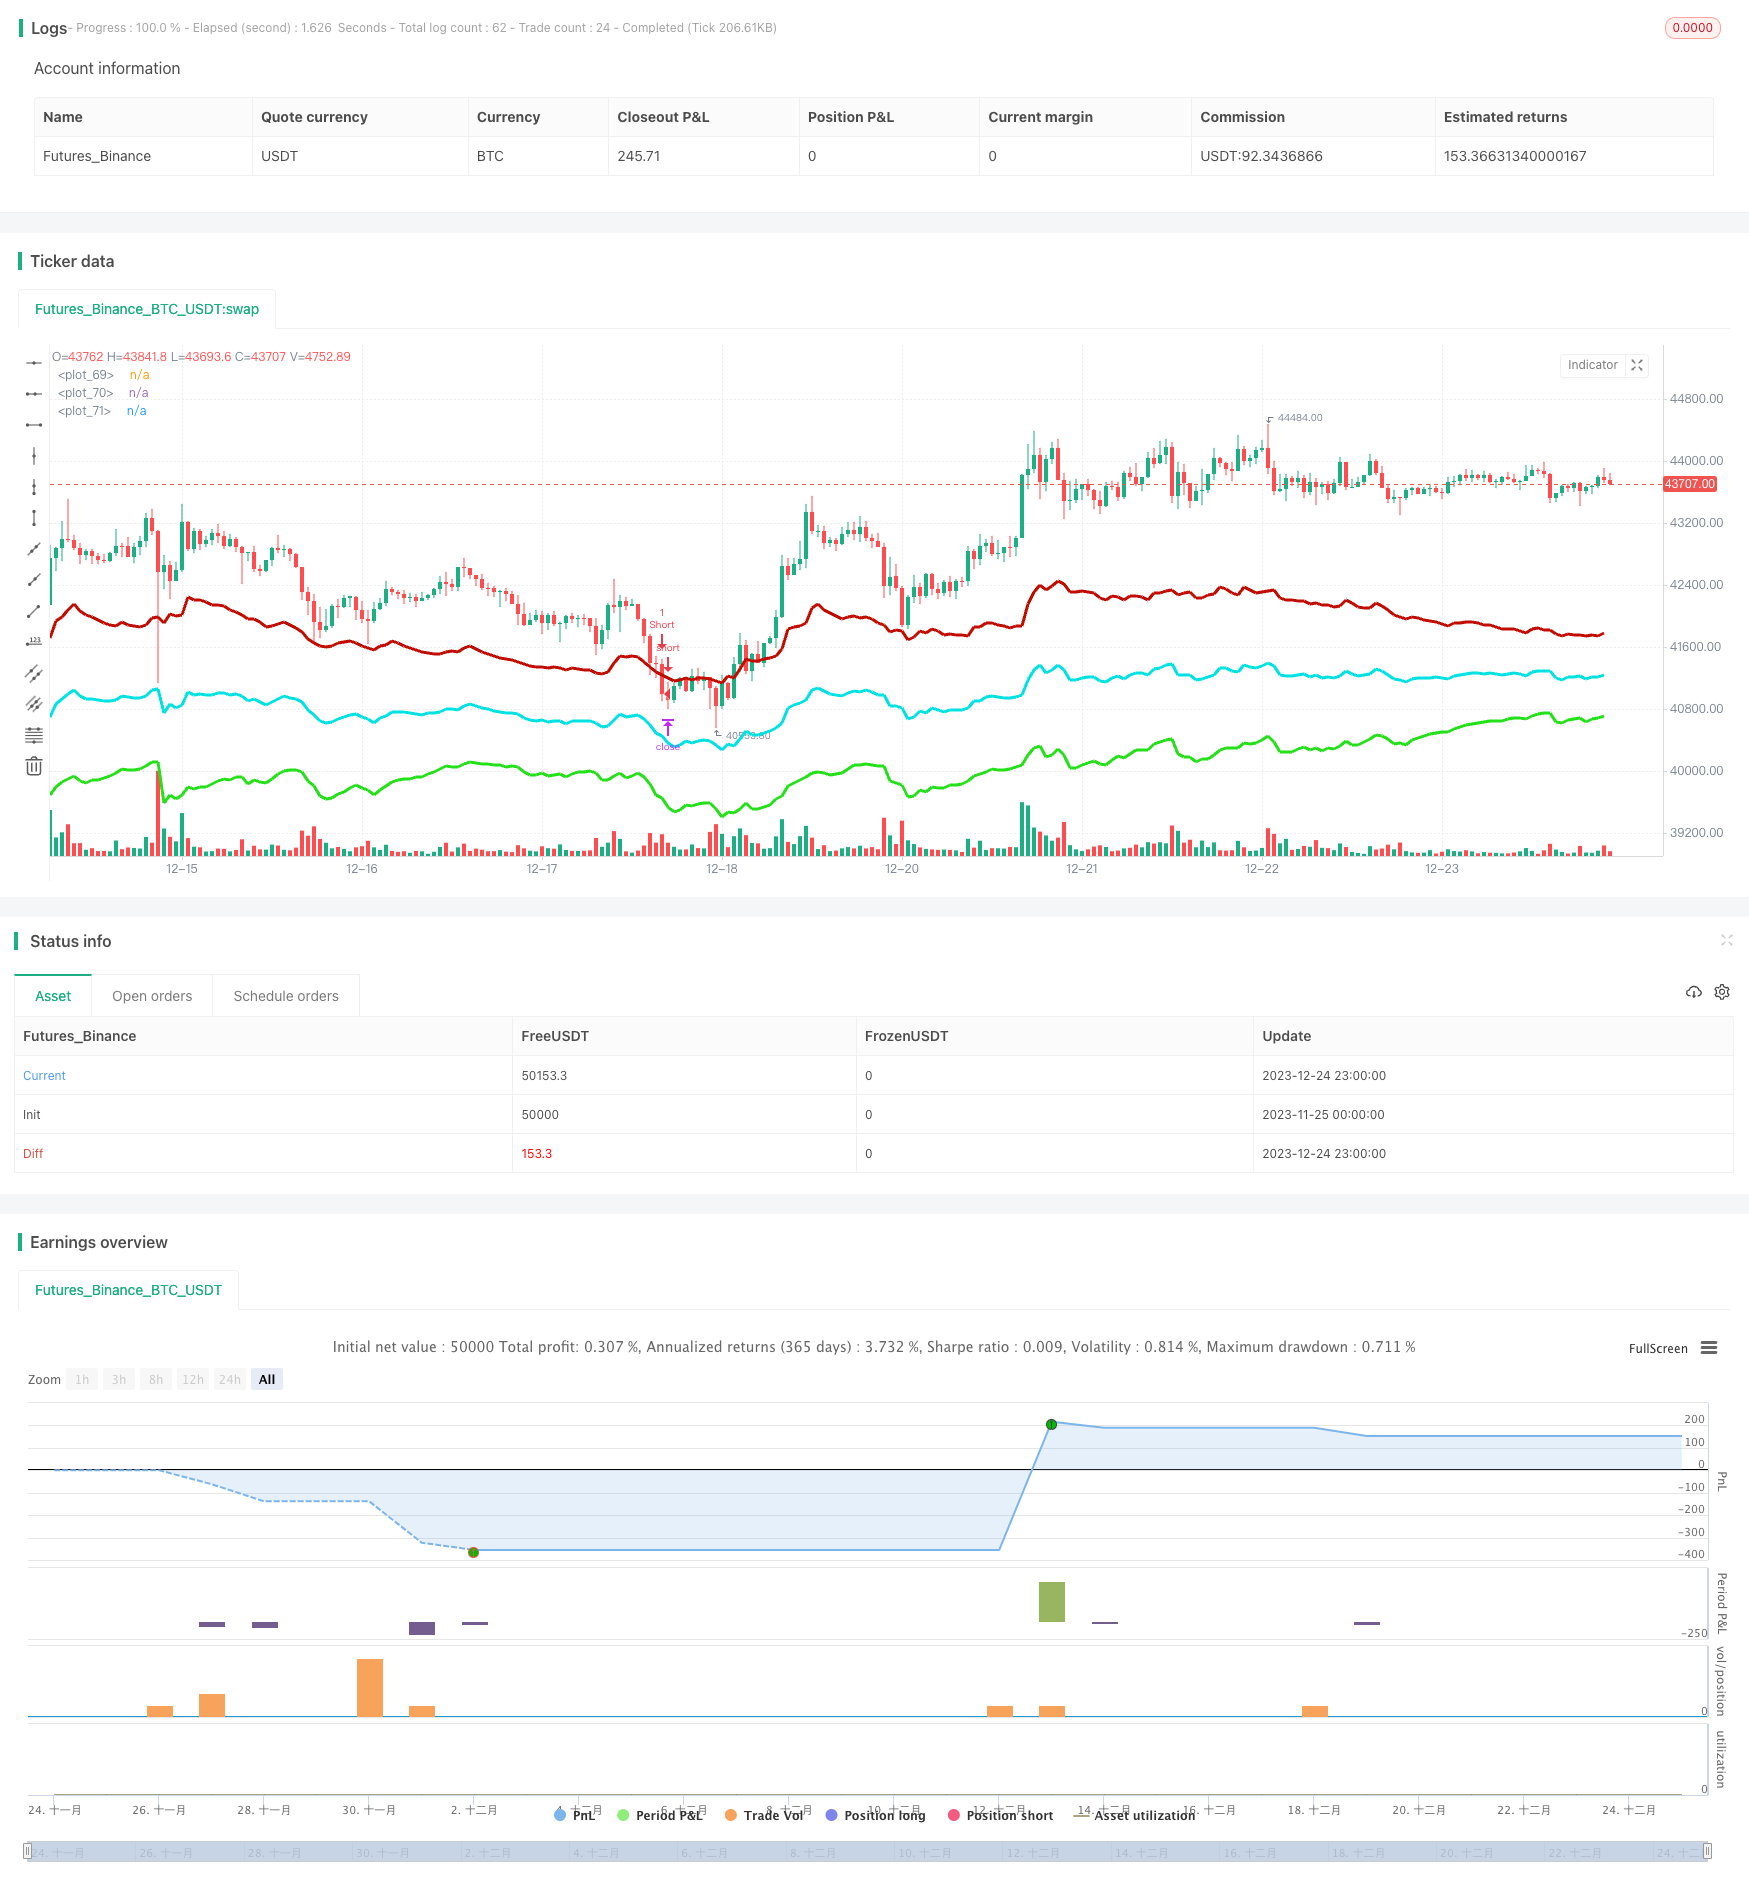
Estrategia de seguimiento de tendencias basada en bandas dinámicas de soporte y resistencia

Descripción general
La estrategia forma un eje central dinámico mediante el cálculo de los máximos y mínimos de los precios más recientes en un período determinado de tiempo, combinados con los precios actuales. Luego, se generan canales bajistas en rojo y canales ascendentes en verde en función de la fluctuación más reciente.
Principio de estrategia
- Calcula los máximos y mínimos de los últimos N períodos, combinados con los precios de cierre actuales para formar un eje central dinámico
- Bandas de canalización dinámicas generadas por ATR y multiplicadas, con variaciones de la banda en función de la volatilidad del mercado
- Hacer más cuando el precio rebota desde la línea de canal inferior, hacer menos cuando rebota desde la línea de canal superior
- Logic de parada y deterioro, objetivo de regresar a la parada del eje central
- Al mismo tiempo, se calcula un índice de tendencia para filtrar las transacciones que no están en marcha
Análisis de las ventajas
- Cambios dinámicos en la posición de la línea de canal para capturar la volatilidad del mercado en tiempo real
- La probabilidad de que el comercio sea en curso es mayor, lo que ayuda a captar la tendencia
- Control de pérdidas individuales con control de pérdidas lógico
Análisis de riesgos
- La optimización incorrecta de los parámetros puede conducir a una sobrecambio
- La tendencia general no puede eliminar completamente el comercio en contra
- La línea de acceso unilateral podría continuar
Dirección de optimización
- Ajustar los parámetros de la línea de paso para que se ajusten mejor a las características de las diferentes variedades
- Ajuste de los parámetros del índice de tendencia para mejorar la probabilidad de avance
- Agrega elementos de aprendizaje automático para optimizar la dinámica de los parámetros
Resumir
La estrategia depende principalmente de las características de la oscilación del mercado para obtener ganancias. Capturar los puntos de inflexión de precios a través de canales dinámicos y combinarlos con filtros de tendencia, puede aprovechar eficazmente los intercambios de inversión para obtener ganancias, al tiempo que controla el riesgo. La clave está en la regulación de los parámetros, que requiere que la línea de canal pueda seguir los precios en tiempo real y no sea demasiado sensible.
/*backtest
start: 2023-11-25 00:00:00
end: 2023-12-25 00:00:00
period: 1h
basePeriod: 15m
exchanges: [{"eid":"Futures_Binance","currency":"BTC_USDT"}]
*/

//@version=4
strategy(title="Strategy - Bobo PAPATR", overlay=true, default_qty_type = strategy.fixed, default_qty_value = 1, initial_capital = 10000)

// === STRATEGY RELATED INPUTS AND LOGIC ===
len = input(24, minval=1, title="Pivot Length, defines lookback for highs and lows to make pivots")
length = input(title="ATR lookback (Lower = bands more responsive to recent price action)", type=input.integer, defval=22)
myatr = atr(length)
dailyatr = myatr[1]
atrmult = input(title="ATR multiplier (Lower = wider bands)", type=input.float, defval=3)
pivot0 = (high[1] + low[1]  + close[1]) / 3

// PIVOT CALC
h = highest(len)
h1 = dev(h, len) ? na : h
hpivot = fixnan(h1)
l = lowest(len)
l1 = dev(l, len) ? na : l
lpivot = fixnan(l1)
pivot = (lpivot + hpivot + pivot0) / 3
upperband1 = (dailyatr * atrmult) + pivot
lowerband1 = pivot - (dailyatr * atrmult)
middleband = pivot

// == TREND CALC ===
i1=input(2, "Momentum Period", minval=1) //Keep at 2 usually
i2=input(20, "Slow Period", minval=1)
i3=input(5, "Fast Period", minval=1)
i4=input(3, "Smoothing Period", minval=1)
i5=input(4, "Signal Period", minval=1)
i6=input(50, "Extreme Value", minval=1)
hiDif = high - high[1]
loDif = low[1] - low
uDM = hiDif > loDif and hiDif > 0 ? hiDif : 0
dDM =  loDif > hiDif and loDif > 0 ? loDif : 0
ATR = rma(tr(true), i1)
DIu = 100 * rma(uDM, i1) / ATR
DId = 100 * rma(dDM, i1) / ATR
HLM2 =  DIu - DId
DTI = (100 * ema(ema(ema(HLM2, i2), i3), i4)) /  ema(ema(ema(abs(HLM2), i2), i3), i4)
signal = ema(DTI, i5)


// === RISK MANAGEMENT INPUTS ===
inpTakeProfit   = input(defval = 0, title = "Take Profit (In Market MinTick Value)", minval = 0)
inpStopLoss     = input(defval = 100, title = "Stop Loss (In Market MinTick Value)", minval = 0)

// === RISK MANAGEMENT VALUE PREP ===
// if an input is less than 1, assuming not wanted so we assign 'na' value to disable it.
useTakeProfit   = inpTakeProfit  >= 1 ? inpTakeProfit  : na
useStopLoss     = inpStopLoss    >= 1 ? inpStopLoss    : na

// === STRATEGY - LONG POSITION EXECUTION ===
enterLong = (((low<=lowerband1) and (close >lowerband1)) or ((open <= lowerband1) and (close > lowerband1))) and (strategy.opentrades <1) and (atr(3) > atr(50)) and (signal>signal[3])
exitLong = (high > middleband)
strategy.entry(id = "Long", long = true, when = enterLong)
strategy.close(id = "Long", when = exitLong)

// === STRATEGY - SHORT POSITION EXECUTION ===
enterShort = (((high>=upperband1) and (close < upperband1)) or ((open >= upperband1) and (close < upperband1))) and (strategy.opentrades <1) and (atr(3) > atr(50)) and (signal<signal[3])
exitShort = (low < middleband)
strategy.entry(id = "Short", long = false, when = enterShort)
strategy.close(id = "Short", when = exitShort)

// === STRATEGY RISK MANAGEMENT EXECUTION ===
strategy.exit("Exit Long", from_entry = "Long", profit = useTakeProfit, loss = useStopLoss)
strategy.exit("Exit Short", from_entry = "Short", profit = useTakeProfit, loss = useStopLoss)

// === CHART OVERLAY ===
plot(upperband1, color=#C10C00, linewidth=3)
plot(lowerband1, color=#23E019, linewidth=3)
plot(middleband, color=#00E2E2, linewidth=3)
//plot(strategy.equity, title="equity", color=red, linewidth=2, style=areabr)