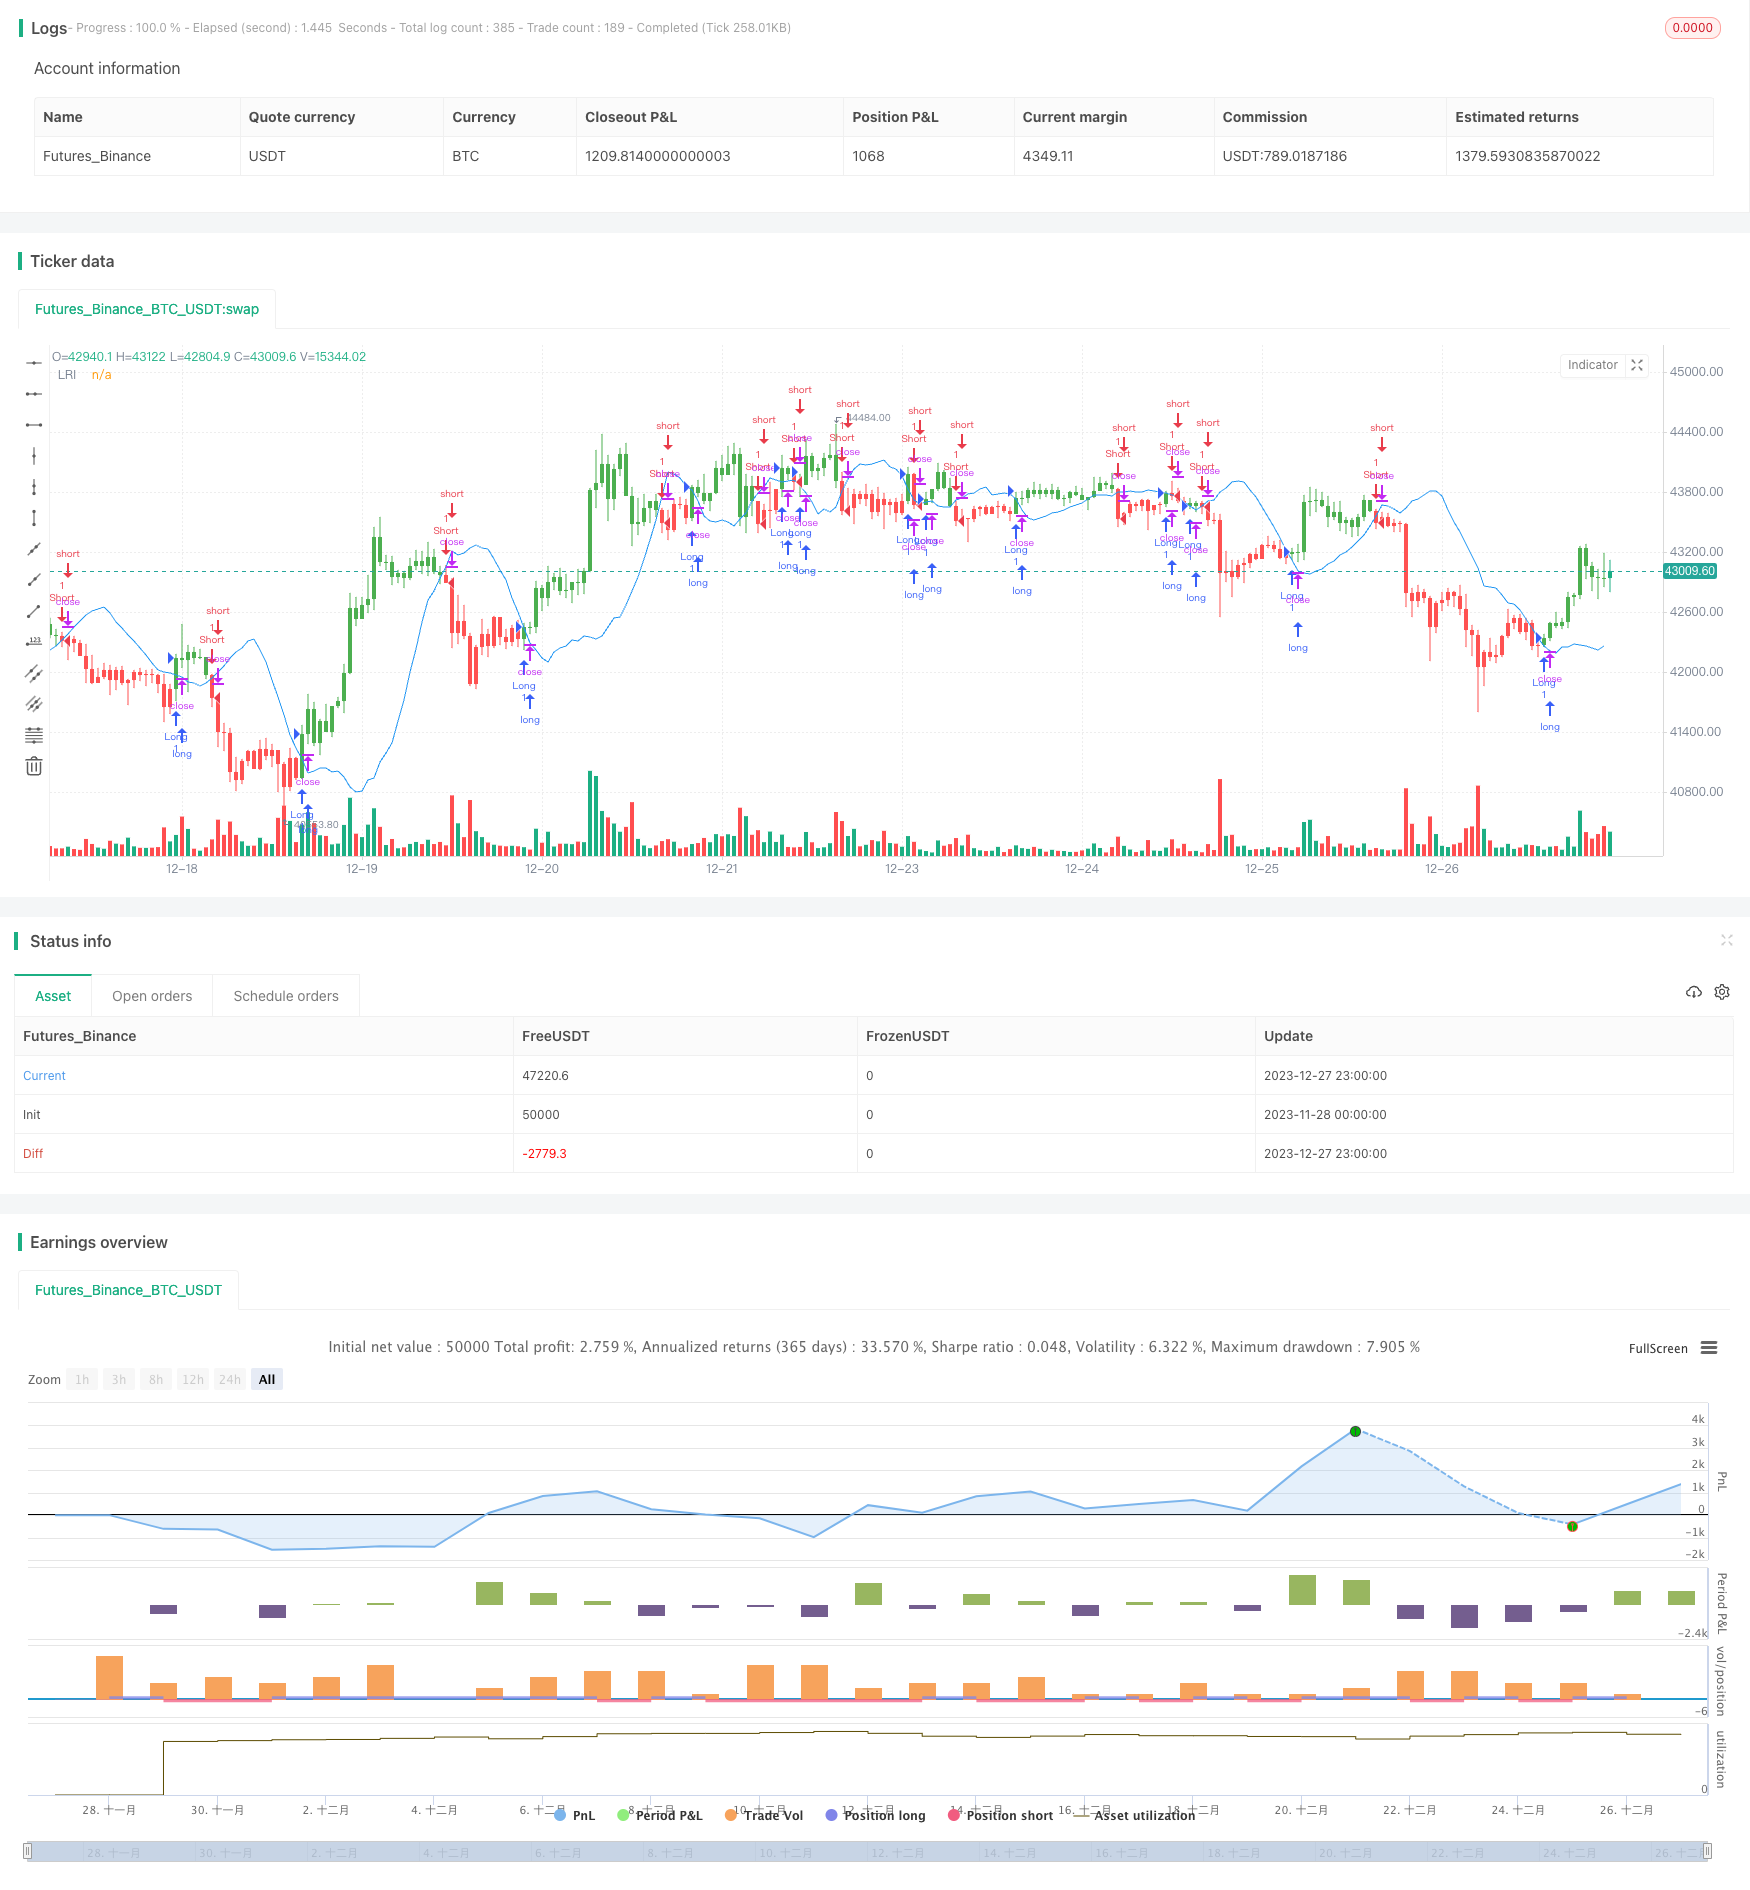
Estrategia cuántica basada en la interceptación de regresión lineal
El autor:¿ Qué pasa?, Fecha: 2023-12-29 11:45:20Las etiquetas:

Resumen general
Esta estrategia utiliza técnicas de regresión lineal para calcular la intercepción de regresión lineal y la utiliza como señal de negociación para construir una estrategia de negociación cuantitativa. Al analizar las series de tiempo de precios de las acciones, esta estrategia se ajusta a una línea de tendencia de regresión lineal y utiliza la intercepción de regresión lineal para juzgar si los precios están sobreestimados o subestimados, generando así señales de negociación.
Principio de la estrategia
La intersección de regresión lineal indica el valor predicho de Y (generalmente el precio) cuando el valor de la serie de tiempo X es 0. Esta estrategia prefiere el parámetro Length, toma el precio de cierre como la secuencia de origen y calcula la intersección de regresión lineal (xLRI) de los días de longitud más recientes.
La fórmula específica de cálculo es la siguiente:
xX = Length *(Length - 1)* 0.5
xDivisor = xX *xX - Length* Length *(Length - 1) *(2 * Length - 1) / 6
xXY = Σ(i *Closing Price[i]), i from 0 to Length-1
xSlope = (Length *xXY - xX* Σ(Closing Price, Length))/ xDivisor
xLRI = (Σ(Closing Price, Length) - xSlope * xX) / Length
A través de dichos cálculos, se puede obtener la interceptación de regresión lineal xLRI para los días de longitud más recientes.
Ventajas
Esta estrategia tiene las siguientes ventajas:
- Utilizando técnicas de regresión lineal, tiene ciertas capacidades predictivas y de juicio de tendencias para los precios.
- Menos parámetros, modelo más simple, fácil de entender e implementar.
- Parámetro personalizable longitud para ajustar la flexibilidad de la estrategia.
Riesgos y soluciones
Esta estrategia también tiene algunos riesgos:
- El ajuste de regresión lineal es simplemente un ajuste estadístico basado en datos históricos, con una capacidad limitada para predecir las tendencias futuras de los precios.
- Si los fundamentos de la empresa sufren cambios importantes, los resultados del ajuste de regresión lineal pueden volverse inválidos.
- El ajuste incorrecto del parámetro Length puede dar lugar a un sobreajuste.
Contramedidas:
- Reducir adecuadamente el parámetro longitud para evitar el sobreajuste.
- Preste atención a los cambios en los fundamentos de la empresa e intervenga manualmente para cerrar posiciones cuando sea necesario.
- Adoptar el parámetro adaptativo longitud para ajustar dinámicamente de acuerdo con las condiciones del mercado.
Direcciones de optimización
Esta estrategia también puede optimizarse en los siguientes aspectos:
- Añadir un mecanismo de stop loss para controlar pérdidas individuales.
- Combinar con otros indicadores para formar una estrategia combinada para mejorar la estabilidad.
- Añadir el módulo de optimización autoadaptable de parámetros para hacer que el parámetro de longitud cambie dinámicamente.
- Añadir un módulo de control de posición para evitar el exceso de negociación.
Resumen de las actividades
Esta estrategia construye una estrategia comercial cuantitativa simple basada en la intercepción de regresión lineal. En general, la estrategia tiene cierto valor económico, pero también hay algunos riesgos a tener en cuenta.
/*backtest
start: 2023-11-28 00:00:00
end: 2023-12-28 00:00:00
period: 1h
basePeriod: 15m
exchanges: [{"eid":"Futures_Binance","currency":"BTC_USDT"}]
*/

//@version=2
////////////////////////////////////////////////////////////
//  Copyright by HPotter v1.0 21/03/2018
// Linear Regression Intercept is one of the indicators calculated by using the
// Linear Regression technique. Linear regression indicates the value of the Y
// (generally the price) when the value of X (the time series) is 0. Linear
// Regression Intercept is used along with the Linear Regression Slope to create
// the Linear Regression Line. The Linear Regression Intercept along with the Slope
// creates the Regression line.
//
// You can change long to short in the Input Settings
// WARNING:
//  - For purpose educate only
//  - This script to change bars colors.
////////////////////////////////////////////////////////////
strategy(title="Line Regression Intercept Backtest", overlay = true)
Length = input(14, minval=1)
xSeria = input(title="Source", defval=close)
reverse = input(false, title="Trade reverse")
xX = Length * (Length - 1) * 0.5
xDivisor = xX * xX - Length * Length * (Length - 1) * (2 * Length - 1) / 6
xXY = 0
for i = 0 to Length-1
	xXY := xXY + (i * xSeria[i])
xSlope = (Length * xXY - xX * sum(xSeria, Length)) / xDivisor
xLRI = (sum(xSeria, Length) - xSlope * xX) / Length
pos = iff(close > xLRI, 1,
       iff(close < xLRI, -1, nz(pos[1], 0)))
possig = iff(reverse and pos == 1, -1,
          iff(reverse and pos == -1, 1, pos))
if (possig == 1)
    strategy.entry("Long", strategy.long)
if (possig == -1)
    strategy.entry("Short", strategy.short)
barcolor(possig == -1 ? red: possig == 1 ? green : blue )
plot(xLRI, color=blue, title="LRI")
- Dinámica toma de ganancias siguiendo la estrategia de tendencia
- 10EMA Estrategia de seguimiento de tendencias doble cruzada
- Estrategia de prueba posterior de puntos dinámicos de giro
- Estrategia de tendencia cruzada de la EMA doble
- Estrategia de señal de CVDVWAP rodante anclada
- RSI Estrategia de retroceso de Fibonacci
- Las bandas de Bollinger + el RSI + la doble estrategia de negociación de la EMA
- Estrategia de optimización de parada de seguimiento dinámica basada en la nube Ichimoku
- Estrategia de criptomonedas alta/baja basada en múltiples indicadores
- VWAP-RSI Estrategia corta sobrevendida en el marco de la estrategia cruzada de BTC
- Estrategia de la línea de reversión media
- Fibonacci HMA AI Comprar y vender la estrategia de la señal
- Tres estrategias de reversión hacia abajo
- Estrategia de negociación cuantitativa de medias móviles dobles
- Estrategia de RSI apalancada en Pine Script
- Estrategia de reversión de tendencia cuantitativa de las operaciones combinada T3-CCI
- Estrategia dinámica de suspensión de pérdidas
- Estrategia OB/OS RSI lenta
- Estrategia de negociación de tendencias adaptativas de múltiples indicadores
- Estrategia de precios por volumen relativo