Descripción general
Esta estrategia es un sistema de comercio cuantitativo de múltiples niveles basado en la divergencia de tendencias de las bandas de Bollinger y en cambios dinámicos de ancho de banda. Esta estrategia construye un marco completo de toma de decisiones comerciales mediante el monitoreo de los cambios dinámicos en el ancho de la Banda de Bollinger, las rupturas de precios y la coordinación del promedio móvil EMA200. La estrategia adopta un mecanismo de seguimiento de volatilidad adaptativo, que puede capturar eficazmente puntos de inflexión en las tendencias del mercado.
Principio de estrategia
El núcleo de la estrategia se basa en los siguientes elementos clave:
- Las bandas de Bollinger se calculan utilizando un promedio móvil de 20 períodos y 2 veces la desviación estándar.
- Determinar la fuerza de la tendencia cambiando el ancho de banda en tres puntos temporales consecutivos
- Combinando la relación entre la entidad de la línea K y la relación del ancho de banda para determinar la efectividad del avance
- Utilizando la EMA200 como filtro de tendencia de mediano a largo plazo
- Ingrese al mercado y opere en largo cuando el precio supere la pista superior y cumpla con las condiciones de expansión del ancho de banda.
- Cuando el precio cae por debajo de la banda inferior y cumple las condiciones de contracción del ancho de banda, cierre la posición.
Ventajas estratégicas
- El sistema de señales es prospectivo y puede detectar con antelación posibles puntos de inflexión de tendencias.
- Validación cruzada de múltiples indicadores técnicos, lo que reduce significativamente las señales falsas
- El indicador de tasa de cambio de ancho de banda tiene buena adaptabilidad a las fluctuaciones del mercado.
- La lógica de entrada y salida es clara y fácil de implementar programáticamente.
- El mecanismo de control de riesgos es perfecto y puede controlar eficazmente la reducción.
Riesgo estratégico
- Pueden producirse transacciones frecuentes en mercados volátiles
- Puede producirse un retraso cuando las tendencias cambian repentinamente
- La optimización de parámetros tiene el riesgo de sobreajuste
- Puede haber riesgo de deslizamiento durante períodos de alta volatilidad del mercado.
- Es necesario monitorear oportunamente la efectividad de los indicadores de ancho de banda
Dirección de optimización de la estrategia
- Introducción de un mecanismo de optimización de parámetros adaptativos
- Agregue indicadores auxiliares como el volumen de operaciones para verificar
- Optimizar la configuración de las condiciones de stop loss y take profit
- Mejorar los criterios de juicio cuantitativo de la fuerza de la tendencia
- Añadir más filtros de entorno de mercado
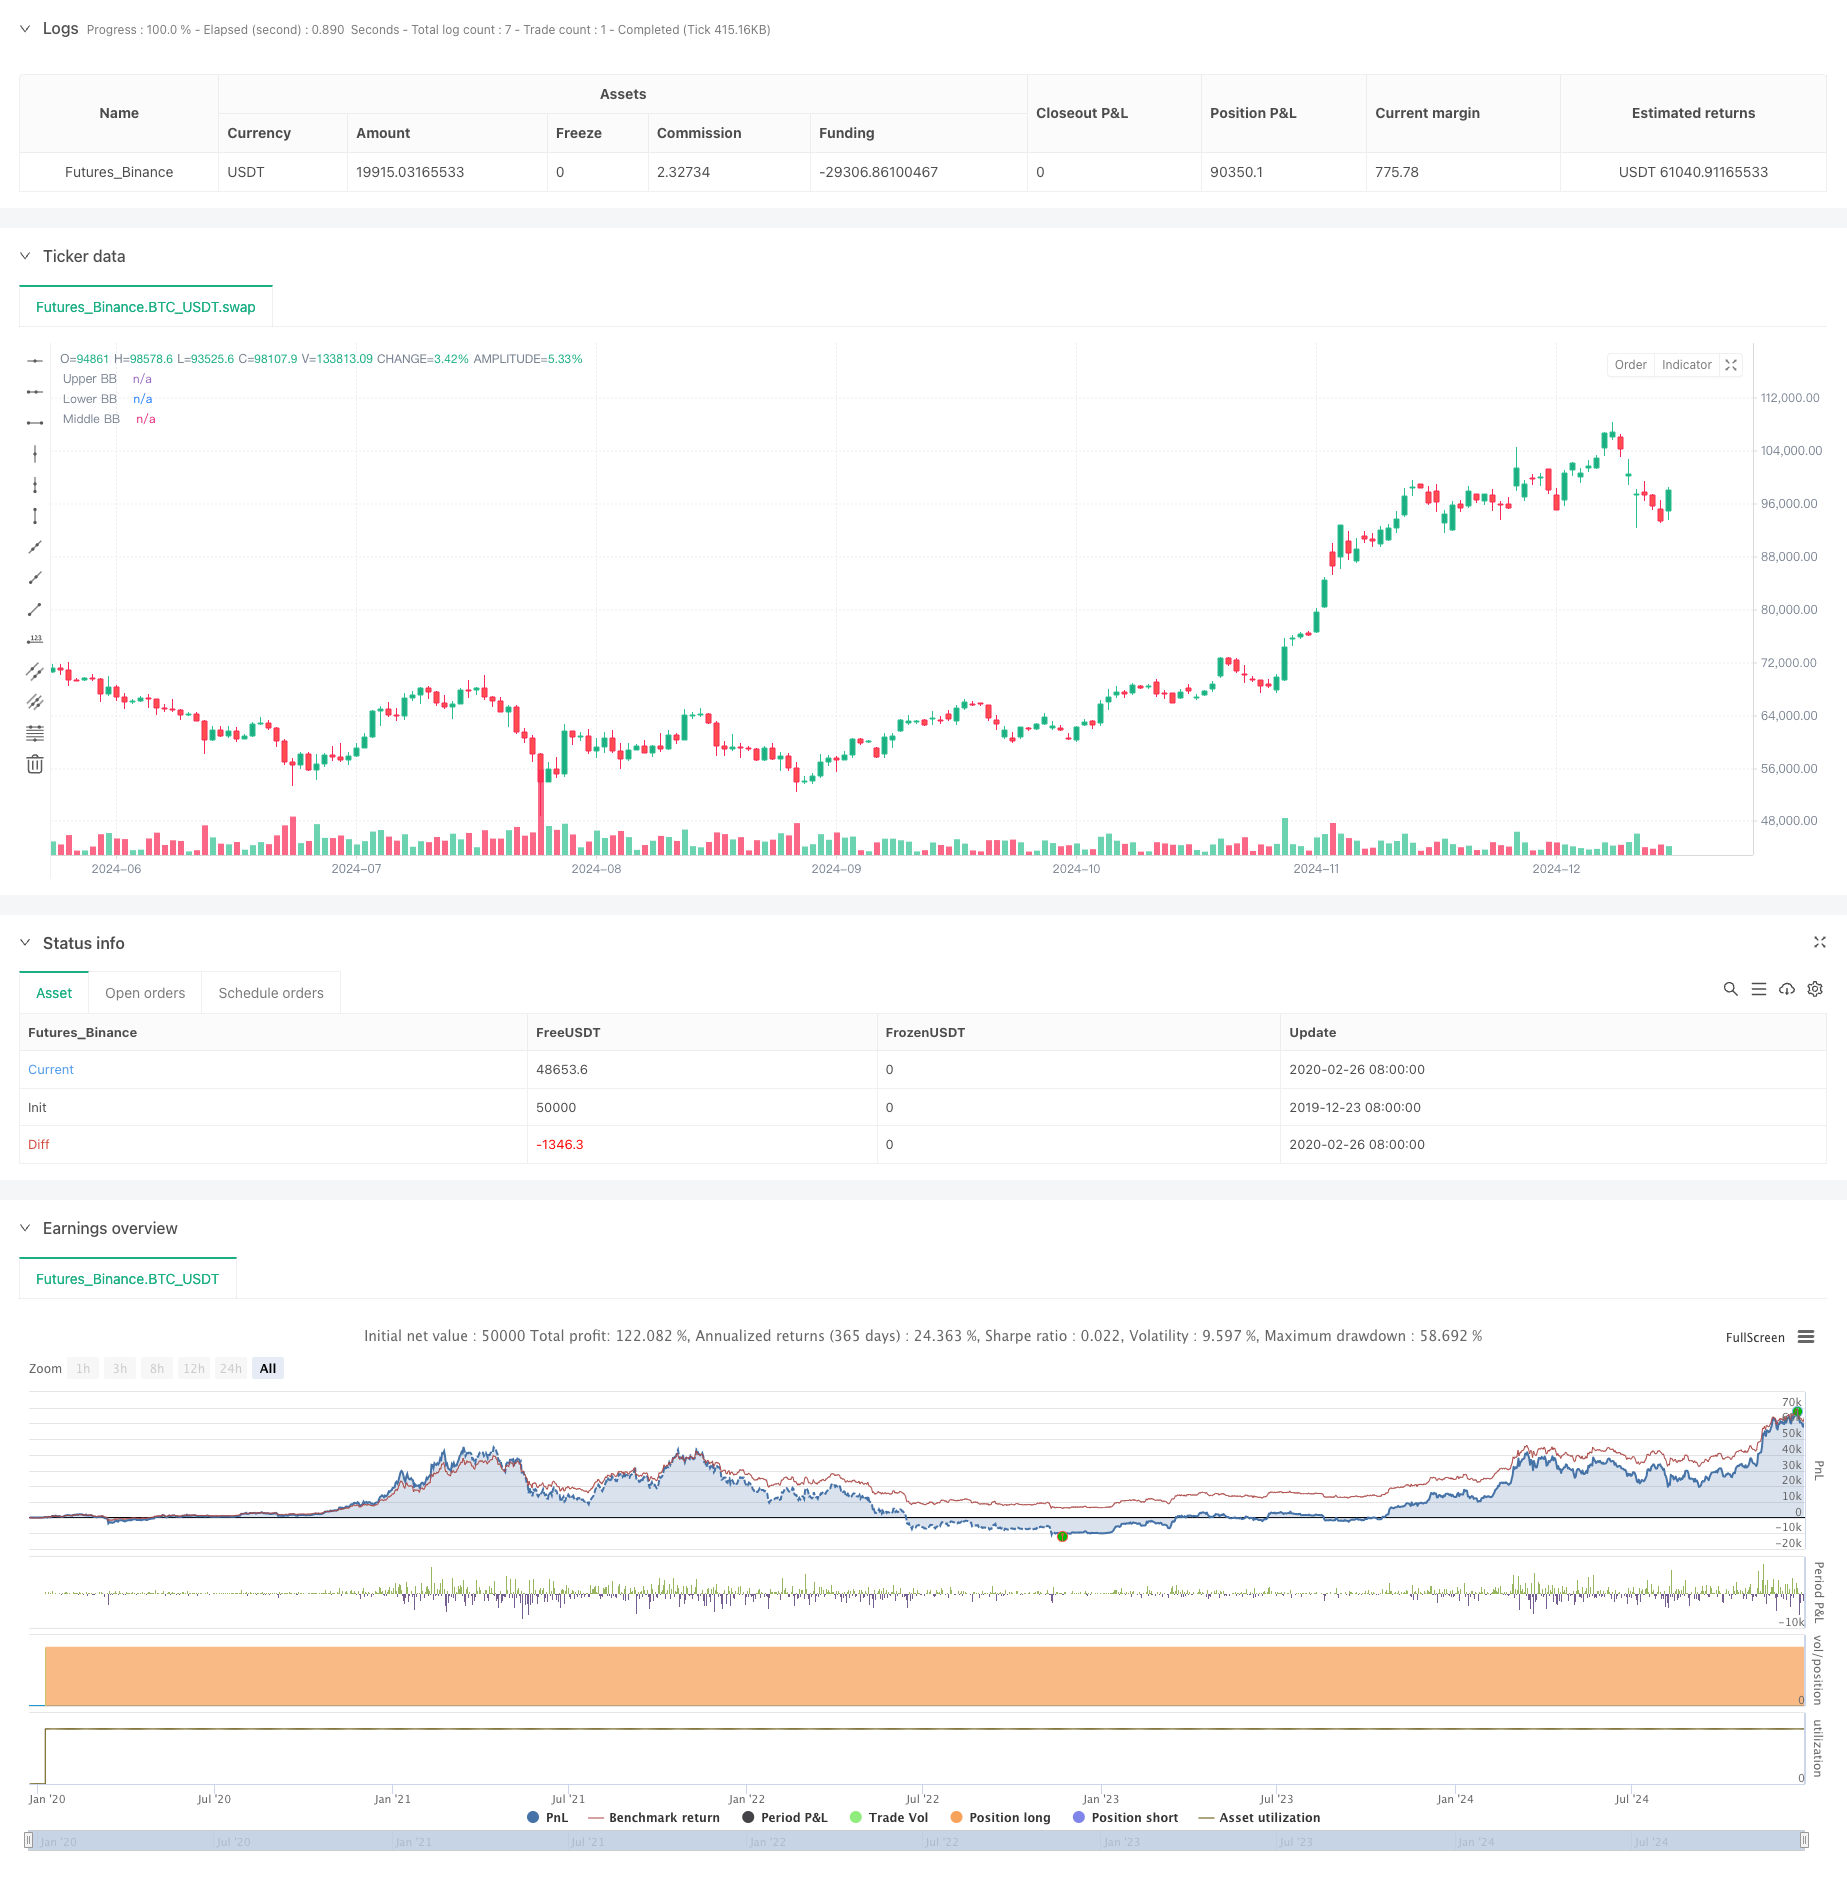
Resumir
La estrategia construye un sistema comercial sólido a través de la divergencia de tendencias de las bandas de Bollinger y cambios dinámicos de ancho de banda. La estrategia funciona bien en mercados con tendencia, pero aún necesita mejorarse en mercados volátiles y optimizar los parámetros. En general, esta estrategia tiene un buen valor práctico y margen de expansión.
/*backtest
start: 2019-12-23 08:00:00
end: 2024-12-25 08:00:00
period: 1d
basePeriod: 1d
exchanges: [{"eid":"Futures_Binance","currency":"BTC_USDT"}]
*/

//@version=6
strategy("BBDIV_Strategy", overlay=true)

// Inputs for Bollinger Bands
length = input.int(20, title="BB Length")
mult = input.float(2.0, title="BB Multiplier")

// Calculate Bollinger Bands
basis = ta.sma(close, length)
deviation = mult * ta.stdev(close, length)
upperBB = basis + deviation
lowerBB = basis - deviation

// Calculate Bollinger Band width
bb_width = upperBB - lowerBB
prev_width = ta.valuewhen(not na(bb_width[1]), bb_width[1], 0)
prev_prev_width = ta.valuewhen(not na(bb_width[2]), bb_width[2], 0)

// Determine BB state
bb_state = bb_width > prev_width and prev_width > prev_prev_width ? 1 : bb_width < prev_width and prev_width < prev_prev_width ? -1 : 0

// Assign colors based on BB state
bb_color = bb_state == 1 ? color.green : bb_state == -1 ? color.red : color.gray

// Highlight candles closed outside BB
candle_size = high - low
highlight_color = (candle_size > bb_width / 2 and close > upperBB) ? color.new(color.green, 50) : (candle_size > bb_width / 2 and close < lowerBB) ? color.new(color.red, 50) : na

bgcolor(highlight_color, title="Highlight Candles")

// Plot Bollinger Bands
plot(upperBB, title="Upper BB", color=bb_color, linewidth=2, style=plot.style_line)
plot(lowerBB, title="Lower BB", color=bb_color, linewidth=2, style=plot.style_line)
plot(basis, title="Middle BB", color=color.blue, linewidth=1, style=plot.style_line)

// Calculate EMA 200
ema200 = ta.ema(close, 200)

// Plot EMA 200
plot(ema200, title="EMA 200", color=color.orange, linewidth=2, style=plot.style_line)

// Strategy logic
enter_long = highlight_color == color.new(color.green, 50)
exit_long = highlight_color == color.new(color.red, 50)

if (enter_long)
    strategy.entry("Buy", strategy.long)

if (exit_long)
    strategy.close("Buy")

// Display profit at close
if (exit_long)
    var float entry_price = na
    var float close_price = na
    var float profit = na

    if (strategy.opentrades > 0)
        entry_price := strategy.opentrades.entry_price(strategy.opentrades - 1)
        close_price := close
        profit := (close_price - entry_price) * 100 / entry_price * 2 * 10 // Assuming 1 pip = 0.01 for XAUUSD
        label.new(bar_index, high + (candle_size * 2), str.tostring(profit, format.mintick) + " USD", style=label.style_label_up, color=color.green)