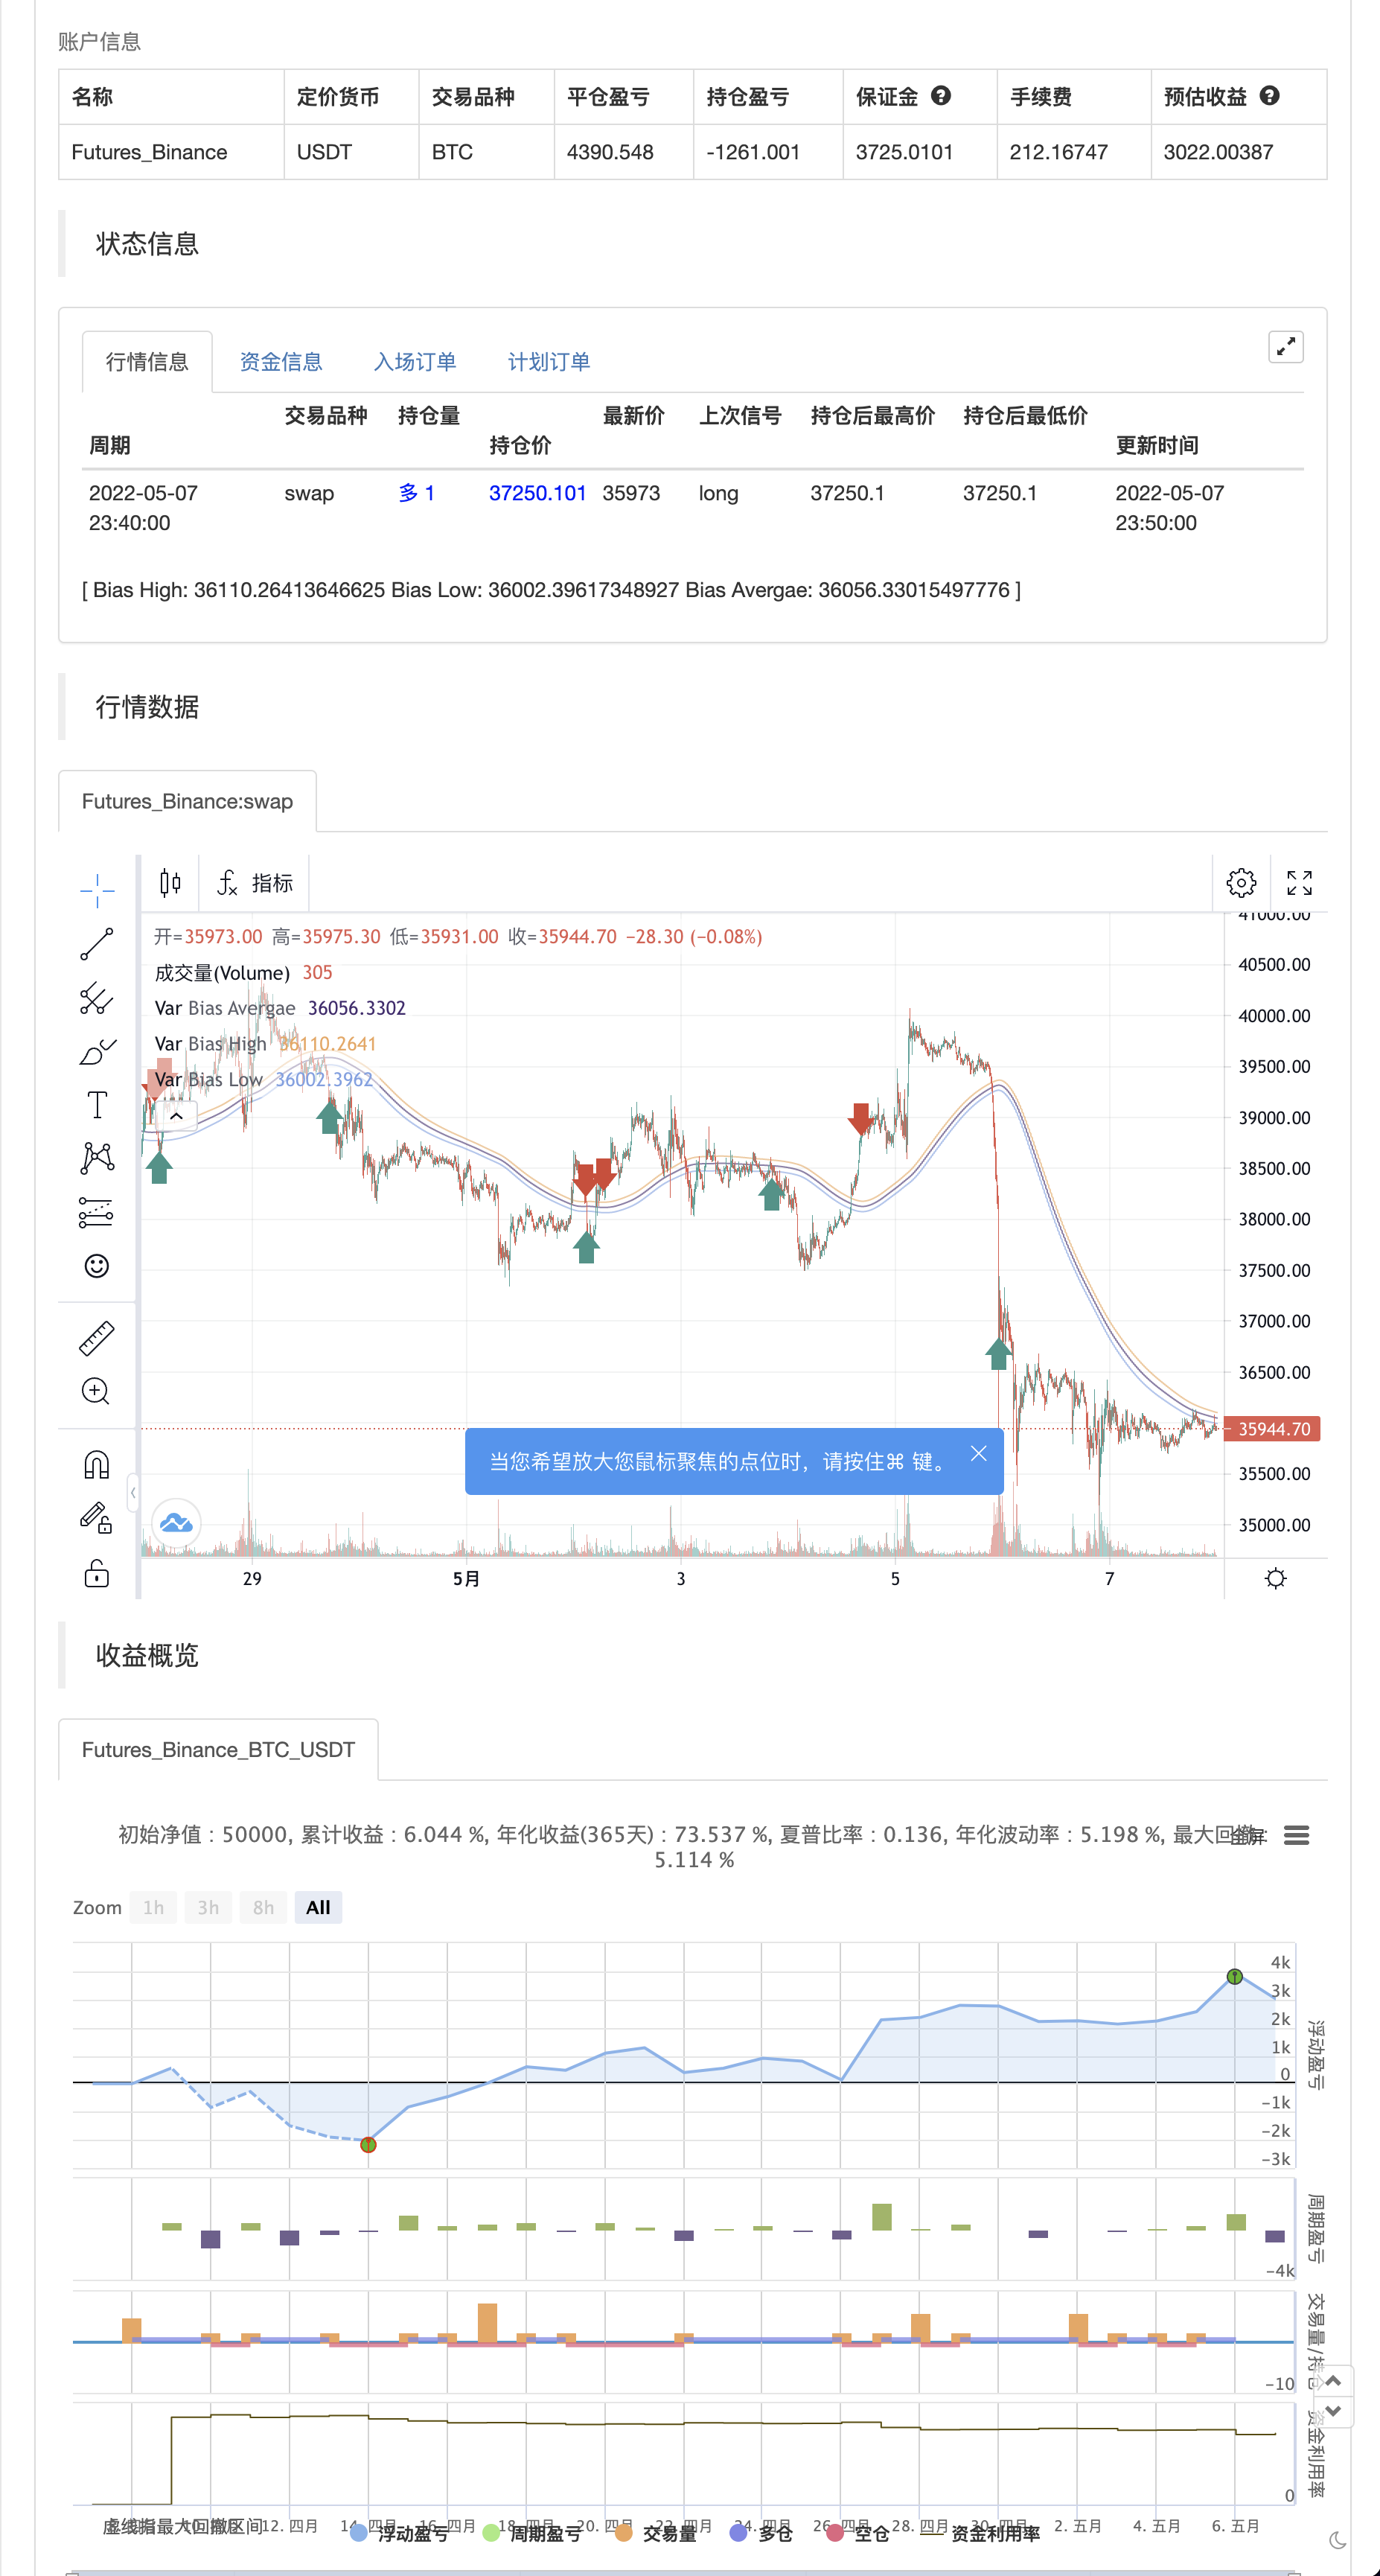
HA Préjugés de marché
Auteur:ChaoZhang est là., Date: 2022-05-09 14:07:28 Je vous en prie.Les étiquettes:Le taux d'intérêt
Bonjour à tous. J'espère que vous allez bien. Ça fait longtemps que je n'ai pas posté mon premier scénario ici, et j'ai eu beaucoup de réactions.
Donc, j'ai pensé que je devrais partager ce script aussi à tout le monde, et à toute personne qui pourrait le trouver utile.
Voici comment je travaille: le script tente de déterminer la direction globale du marché, en utilisant des bougies Heiken Ashi lisses. Le système de coloration (en utilisant des couleurs vives et sombres) est une tentative de détecter les conditions de marché fortes et faibles. Il y a aussi un oscillateur dans le script, mais pour l'instant il n'est pas tracé. Crédits à @jackvmk, j'ai utilisé une partie de son code de script ouvert dans cet indicateur.
J'ai envisagé d'utiliser la pente du graphique de l'indicateur comme un filtre pour les conditions de marché variables. Le graphique est relativement plat dans les marchés
Si vous trouvez un moyen de l'utiliser, veuillez le partager avec la communauté dans la section commentaires.
REMARQUE: ce n'est pas un conseil financier, vous devrez faire vos études et trouver un moyen d'appliquer cet indicateur à votre style et à votre stratégie de trading.
Au fait, je vais utiliser le nom
test de retour

/*backtest
start: 2022-04-08 00:00:00
end: 2022-05-07 23:59:00
period: 10m
basePeriod: 1m
exchanges: [{"eid":"Futures_Binance","currency":"BTC_USDT"}]
*/

// This source code is subject to the terms of the Mozilla Public License 2.0 at https://mozilla.org/MPL/2.0/
// © Professeur_X

//@version=5

indicator(title='HA Market Bias', shorttitle='HA Market Bias', overlay=true)

tf(_res, _exp, gaps_on) =>
    gaps_on == 0 ? request.security(syminfo.tickerid, _res, _exp) : gaps_on == true ? request.security(syminfo.tickerid, _res, _exp, barmerge.gaps_on, barmerge.lookahead_off) : request.security(syminfo.tickerid, _res, _exp, barmerge.gaps_off, barmerge.lookahead_off)

ha_htf = ''
show_ha = input.bool(true, "Show HA Plot/ Market Bias", group="HA Market Bias")
ha_len = input(100, 'Period', group="HA Market Bias")
ha_len2 = input(100, 'Smoothing', group="HA Market Bias")

// Calculations {
o = ta.ema(open, ha_len)
c = ta.ema(close, ha_len)
h = ta.ema(high, ha_len)
l = ta.ema(low, ha_len)

haclose = tf(ha_htf, (o + h + l + c) / 4, 0)
xhaopen = tf(ha_htf, (o + c) / 2, 0)
haopen = na(xhaopen[1]) ? (o + c) / 2 : (xhaopen[1] + haclose[1]) / 2
hahigh = math.max(h, math.max(haopen, haclose))
halow = math.min(l, math.min(haopen, haclose))


o2 = tf(ha_htf, ta.ema(haopen, ha_len2), 0)
c2 = tf(ha_htf, ta.ema(haclose, ha_len2), 0)
h2 = tf(ha_htf, ta.ema(hahigh, ha_len2), 0)
l2 = tf(ha_htf, ta.ema(halow, ha_len2), 0)

ha_avg = (h2 + l2) / 2
// }

// Oscillator {
osc_len = input.int(7, "Oscillator Period", group="HA Market Bias")

osc_bias = 100 *(c2 - o2)
osc_smooth = ta.ema(osc_bias, osc_len)

sigcolor =
  (osc_bias > 0) and (osc_bias >= osc_smooth) ? color.new(color.lime, 35) :
  (osc_bias > 0) and (osc_bias < osc_smooth) ? color.new(color.lime, 75) :
  (osc_bias < 0) and (osc_bias <= osc_smooth) ? color.new(color.red, 35) :
  (osc_bias < 0) and (osc_bias > osc_smooth) ? color.new(color.red, 75) :
  na
// }

// Plots {
p_h = plot(h2, "Bias High", display=display.none, editable=false)
p_l = plot(l2, "Bias Low", display=display.none, editable=false)
p_avg = plot(ha_avg, "Bias Avergae", display=display.none, editable=false)


col = o2 > c2 ? color.red : color.lime

if o2 > c2
    strategy.entry("Enter Long", strategy.long)
else if o2 < c2
    strategy.entry("Enter Short", strategy.short)
- Stratégie de négociation d'évolution de tendance multi-EMA avec gestion des risques basée sur ATR
- Stratégie de suivi de la tendance adaptative avec système de contrôle dynamique de la consommation
- Stratégie multi-EMA "croix d'or" avec prise de bénéfices à plusieurs niveaux
- Stratégie dynamique d'entrée d'achat combinant le franchissement EMA et la pénétration du corps de la bougie
- Stratégie de négociation cyclique de moyenne de coût en dollars
- Stratégie de négociation de rupture de position dynamique adaptative de l'EMA
- Stratégie dynamique de suivi de la tendance des vagues
- Stratégie de négociation de tendance dynamique multi-indicateur
- Stratégie de négociation des moyennes mobiles intelligentes
- Stratégie dynamique de rupture et de renversement de l'EMA
- Tendance multi-indicateur à la suite de la stratégie croisée de négociation d'options de l' EMA
- La stratégie de TV haut et bas
- Meilleure stratégie de tradingView
- Résultats de l'évaluation de la volatilité
- Chande Kroll Arrêtez
- CCI + EMA avec stratégie croisée RSI
- Stratégie de capture de tendance des bandes EMA + leledc + bandes Bollinger
- RSI MTF Ob+Os
- Stratégie MACD Willy
- RSI - Signaux d'achat et de vente
- La tendance de Heikin-Ashi
- L'oscillateur lisse du nuage Ichimoku
- Williams %R - Lissé
- QQE MOD + SSL hybride + Waddah Attar explosion
- Acheter ou vendre Strat
- Triple Supertrend avec EMA et ADX
- Tom DeMark Carte de chaleur séquentielle
- jma + dwma par grains multicolores
- Le MACD magique
- Z Score avec des signaux
- La stratégie de fluctuation facile de Shinto en version en pin