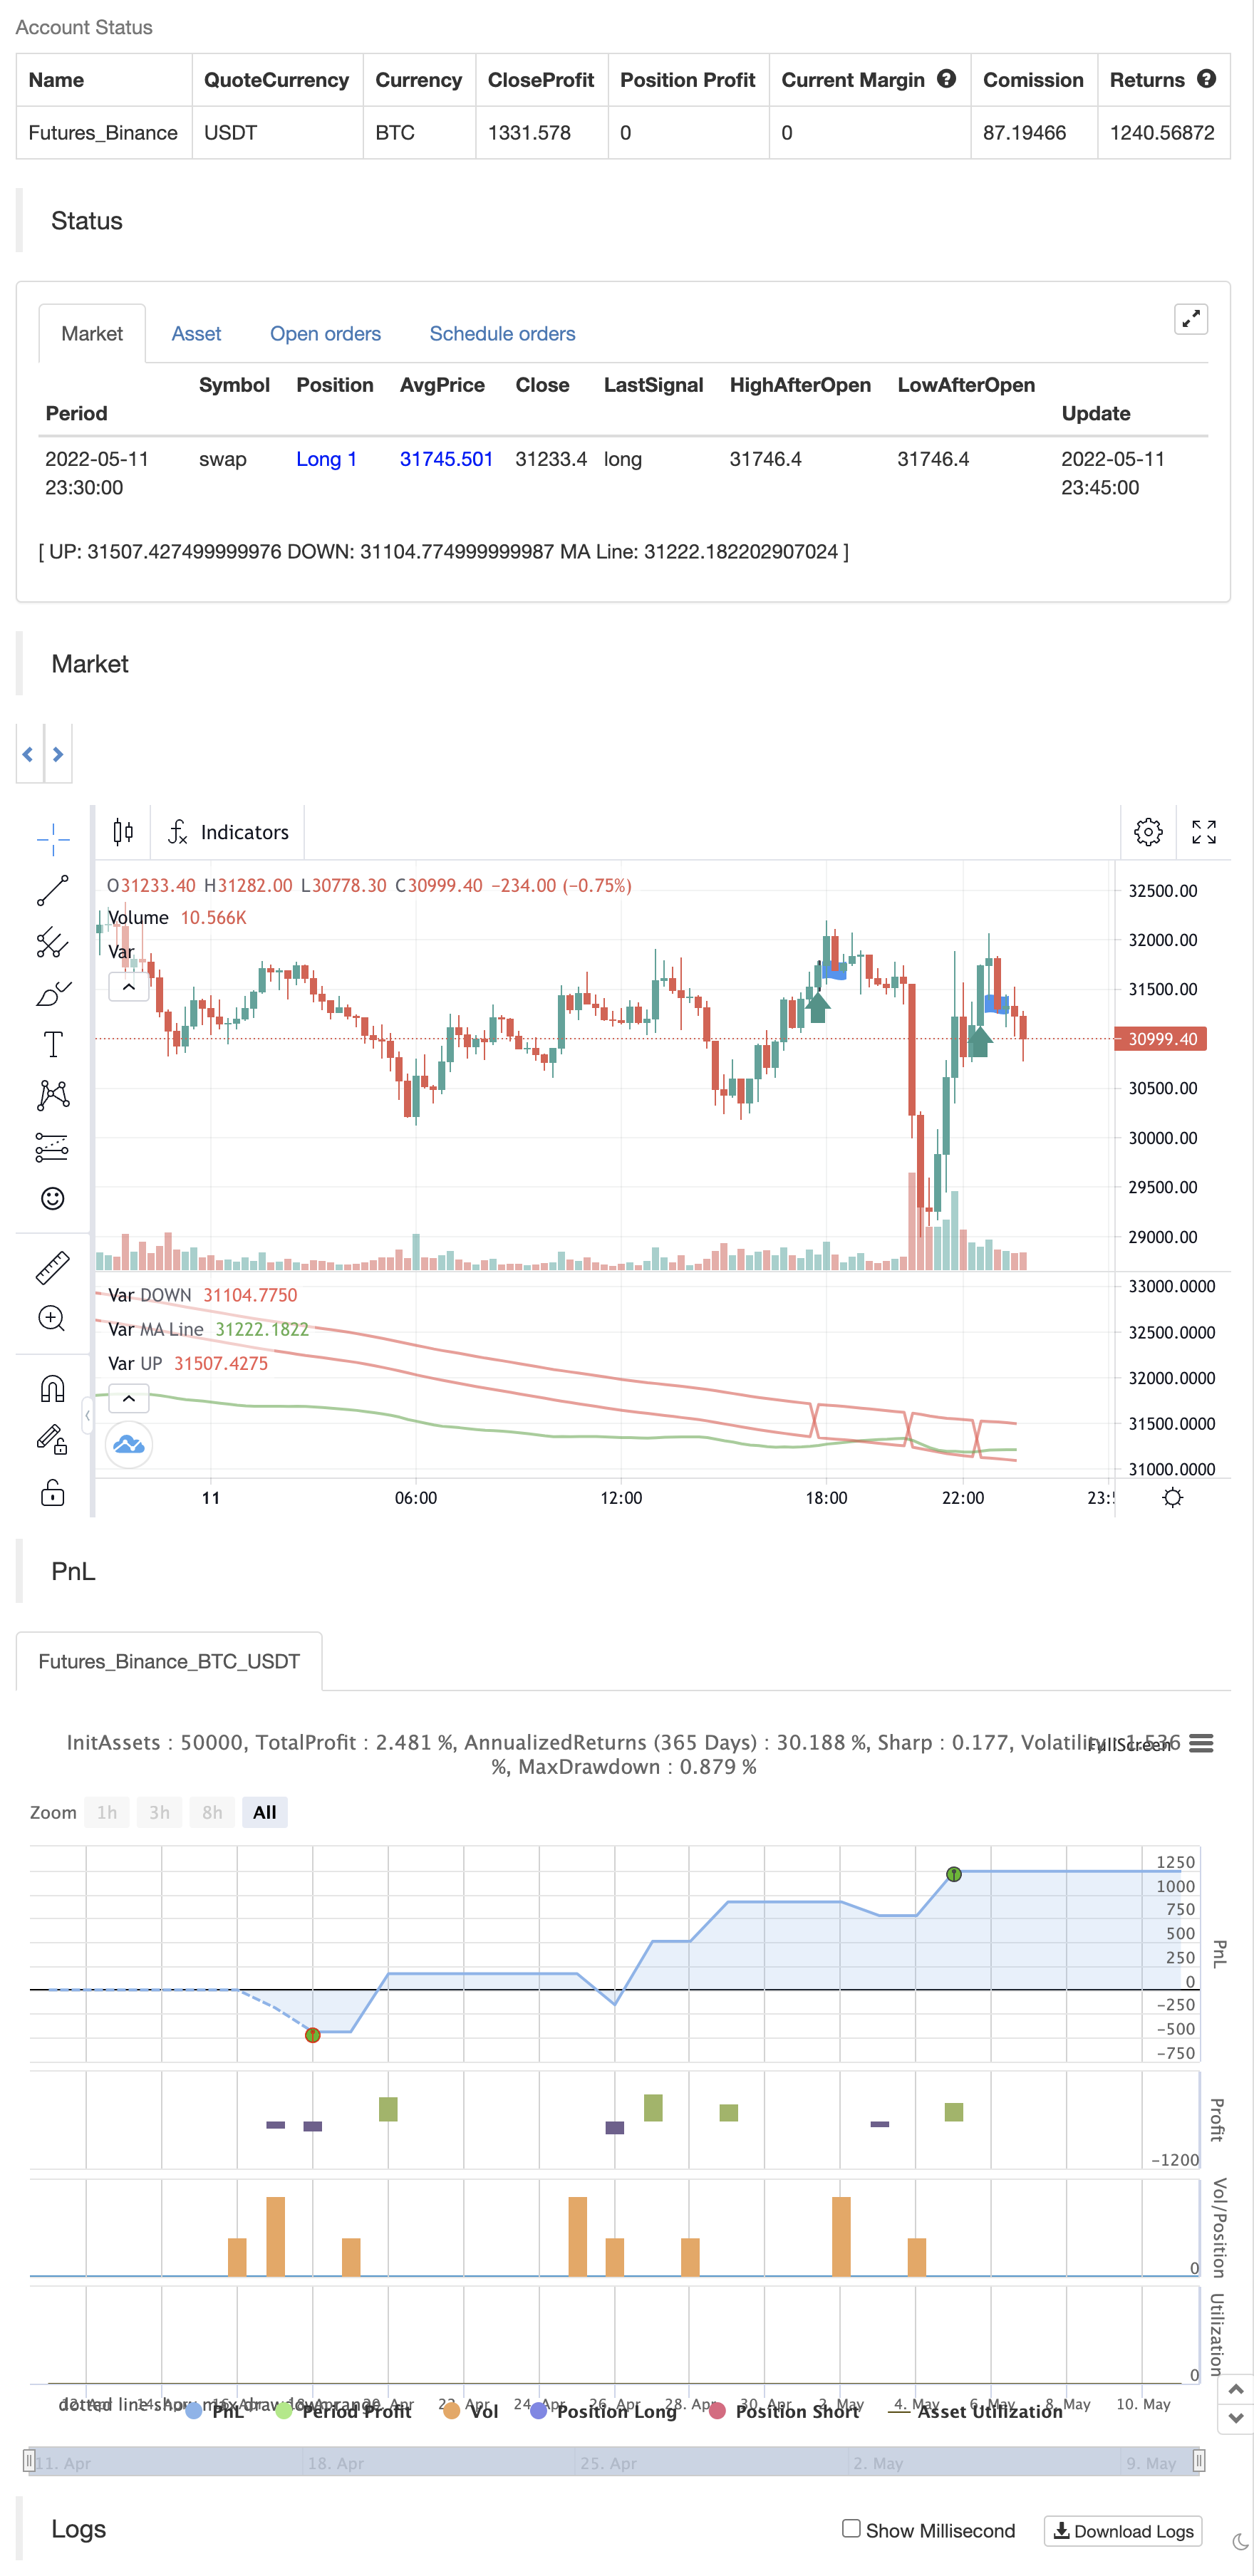
Résultats
Auteur:ChaoZhang est là., Date: 2022-05-13 12h23:08 Je vous en prie.Les étiquettes:SMALe taux d'intérêtLe secteur privéLa WMAVWMA
Cette stratégie utilise des indicateurs combinés pour créer des points d'entrée LONG, la stratégie a été trouvée pour la première fois par saudALThaidy.
Comment l'utiliser: ouvrez votre actif et choisissez un laps de temps compris entre 5min et 2hours (recommandé: 30min, 45min), la stratégie donnera des points d'entrée elle-même, vous pouvez surveiller et tirer profit manuellement (recommandé), ou vous pouvez utiliser la configuration de sortie.
Réglage de sortie: Profitez: clôturer la transaction et profiter après avoir atteint le pourcentage spécifié du point d'entrée. Utilisez Stop Percentage : si c'est faux, la transaction sera fermée si elle tombe en dessous de la ligne MA, si c'est vrai, elle utilisera la configuration suivante. StopLose Percentage: spécifier un pourcentage pour clôturer la transaction si le prix de l'actif tombe en dessous.
Notes importantes: Comme l'a déclaré saudALThaidy, la stratégie doit être utilisée avec des bougies pour obtenir le meilleur résultat. Pour une meilleure utilisation de la stratégie, utilisez (Take Profit = 1,Use Stop Percentage = false) pour obtenir chaque transaction, et profitez manuellement lorsque vous voyez le meilleur.
Pour toute note sur la stratégie à éditer, ou pour d'autres idées de stratégies, veuillez commenter.
test de retour

/*backtest
start: 2022-04-12 00:00:00
end: 2022-05-11 23:59:00
period: 15m
basePeriod: 5m
exchanges: [{"eid":"Futures_Binance","currency":"BTC_USDT"}]
*/

// This source code is subject to the terms of the Mozilla Public License 2.0 at https://mozilla.org/MPL/2.0/
// © Sultan_shaya

//@version=5
//strategy("SSS", overlay=true, initial_capital=1000,currency=currency.USD,default_qty_type=strategy.percent_of_equity,default_qty_value=100,pyramiding=0)
//SSS = Sultan+Saud Strategy

//The original idea of the code belonges to saudALThaidy
//The strategy code is basically made out of two other indicators, edited and combined by me.
// 1- NSDT HAMA Candles => https://www.tradingview.com/script/k7nrF2oI-NSDT-HAMA-Candles/
// 2- SSL Channel => https://www.tradingview.com/script/6y9SkpnV-SSL-Channel/


//MA INFO
WickColor = input(color.rgb(80, 80, 80, 100), title='Wick Color', tooltip='Suggest Full Transparency.')
LengthMA = input.int(100, minval=1, title='MA Line Length', inline='MA Info')
TakeProfit = input.float(1, minval=0, title='Take Profit Percentage', step=1)
UseStopLose = input.bool(false, title='Use Stop Percentage')
StopLose = input.float(1, minval=0, title='StopLose Percentage', step=1)

MASource = close

ma(source, length, type) =>
    type == "SMA" ? ta.sma(source, length) :
     type == "EMA" ? ta.ema(source, length) :
     type == "SMMA (RMA)" ? ta.rma(source, length) :
     type == "WMA" ? ta.wma(source, length) :
     type == "VWMA" ? ta.vwma(source, length) :
     na

ma1_color  = color.green
ma1 = ma(high, 200, "SMA")

ma2_color  = color.red
ma2 = ma(low, 200, "SMA")

Hlv1 = float(na)
Hlv1 := close > ma1 ? 1 : close < ma2 ? -1 : Hlv1[1]
sslUp1   = Hlv1 < 0 ? ma2 : ma1
sslDown1 = Hlv1 < 0 ? ma1 : ma2

Color1 = Hlv1 == 1 ? ma1_color : ma2_color
fillColor1 = color.new(Color1, 90)

highLine1 = plot(sslUp1, title="UP", linewidth=2, color = Color1)
lowLine1 = plot(sslDown1, title="DOWN", linewidth=2, color = Color1)

OpenLength = 25
HighLength = 20
LowLength = 20
CloseLength = 20


SourceOpen = (open[1] + close[1]) / 2
SourceHigh = math.max(high, close)
SourceLow = math.min(low, close)
SourceClose = (open + high + low + close) / 4

funcCalcMA1(src1, len1) => ta.ema(src1, len1)
funcCalcOpen(SourceOpen, OpenLength) => ta.ema(SourceOpen, OpenLength)
funcCalcHigh(SourceHigh, HighLength) => ta.ema(SourceHigh, HighLength)
funcCalcLow(SourceLow, LowLength) => ta.ema(SourceLow, LowLength)
funcCalcClose(SourceClose, CloseLength) => ta.ema(SourceClose, CloseLength)

MA_1 = funcCalcMA1(MASource, LengthMA)

CandleOpen = funcCalcOpen(SourceOpen, OpenLength)
CandleHigh = funcCalcHigh(SourceHigh, HighLength)
CandleLow = funcCalcLow(SourceLow, LowLength)
CandleClose = funcCalcClose(SourceClose, CloseLength)

//PLOT CANDLES
//-------------------------------NSDT HAMA Candels
BodyColor = CandleOpen > CandleOpen[1] ? color.green : color.red
//barcolor(BodyColor)
//plotcandle(CandleOpen, CandleHigh, CandleLow, CandleClose, color=BodyColor, title='HAMA Candles', wickcolor=WickColor, bordercolor=na)
plot(MA_1, title='MA Line', color=BodyColor, style=plot.style_line, linewidth=2)

//------------------------------SSL Channel


plot_buy = false
avg = ((high-low)/2)+low
LongCondition = (Hlv1 == 1 and Hlv1[1] == -1) and (BodyColor == color.green) and (MA_1 < avg) and (CandleHigh < avg) and (strategy.opentrades == 0)
if LongCondition
    strategy.entry("BUY HERE", strategy.long)
    plot_buy := true

base = strategy.opentrades.entry_price(0)
baseProfit = (base+((base/100)*TakeProfit))
baseLose = (base-((base/100)*StopLose))

strategy.exit("SELL HERE","BUY HERE",limit = baseProfit)
if UseStopLose and (close < MA_1)
    strategy.exit("SELL HERE","BUY HERE",stop = baseLose)
if not UseStopLose and (close < MA_1)
    strategy.exit("SELL HERE","BUY HERE", stop = close)

plotshape(plot_buy, title="Buy Label", text="Buy", location=location.belowbar, style=shape.labelup, size=size.tiny, color=Color1, textcolor=color.white)

fill(highLine1, lowLine1, color = fillColor1)
- La super tendance de Crodl
- Le groupe Brin a dépassé la stratégie de suivi des transactions.
- Stratégie de négociation à plusieurs niveaux
- RSI Divergence avec le pivot, BB, SMA, EMA, SMMA, WMA, VWMA
- Stratégie de mesure de la traçabilité à travers les deux lignes homogènes
- Stratégie de filtrage des tendances et des fluctuations
- Stratégie de suivi des tendances croisées sur plusieurs cycles
- Stratégie de croisement des moyennes mobiles
- Stratégie R5.1 du CCO
- 2 Détection de la direction des couleurs moyennes mobiles
- Oscillateur arc-en-ciel
- Exemple de dimensionnement des positions de négociation de la courbe des actions
- Une démonstration de KLineChart
- Stratégie de super-tendance à pivot dynamique
- La super tendance de Crodl
- RSI par zdmre
- FTL - Filtre de portée X2 + EMA + UO
- Le BRAHMASTRA
- Bandes de Mobo
- SAR + 3SMMA avec SL et TP
- Modèle d'alerte de lancement lunaire [indicateur]
- HALFTREND + HEMA + SMA (stratégie du faux signal)
- RSI Divergence avec le pivot, BB, SMA, EMA, SMMA, WMA, VWMA
- RSI et BB et survendus simultanément
- Des bougies Heikin Ashi en roulement
- Combo 2/20 EMA et filtre à bande passante
- Les États membres
- 3EMA
- Blocs d'ordre pivot
- Les États membres doivent respecter les dispositions suivantes: