概述
自适应移动平均线交叉策略是一种灵活的趋势跟踪交易系统,利用价格与选定类型移动平均线的交叉来识别交易机会。该策略允许交易者从简单移动平均线(SMA)、指数移动平均线(EMA)、平滑移动平均线(SMMA/RMA)、加权移动平均线(WMA)和成交量加权移动平均线(VWMA)中选择合适的移动平均线类型。通过调整移动平均线的类型和周期,交易者可以根据不同的市场条件和交易风格来优化策略表现。
该策略的核心在于检测价格与选定移动平均线之间的交叉。当价格从下方突破移动平均线时,策略会产生买入信号;当价格从上方跌破移动平均线时,策略会产生卖出信号。这种简单而有效的方法使得策略能够捕捉市场趋势,同时也提供了清晰的入场和出场点。
策略还包含了回测日期范围的设置功能,使用户能够在特定的历史时期内评估策略的表现。这一功能对于策略的优化和验证非常有价值,能够帮助交易者了解策略在不同市场环境下的表现。
策略原理
移动平均线计算: 策略首先根据用户选择的移动平均线类型和周期计算移动平均线。支持的类型包括SMA、EMA、SMMA(RMA)、WMA和VWMA。每种类型都有其特定的计算方法,例如EMA会给予近期数据更高的权重。
交叉检测: 策略使用ta.crossover()和ta.crossunder()函数来检测收盘价与移动平均线之间的交叉。当收盘价从下方突破移动平均线时,ta.crossover()返回真值,表示买入信号;当收盘价从上方跌破移动平均线时,ta.crossunder()返回真值,表示卖出信号。
位置管理: 策略使用一个名为position的变量来跟踪当前的交易状态。当检测到买入信号时,position被设置为1;当检测到卖出信号时,position被设置为-1。
交易执行: 基于position变量的值,策略使用strategy.entry()函数执行买入操作,使用strategy.close()函数执行卖出操作。这确保了策略只在适当的时机进行交易。
日期范围过滤: 策略通过date()函数实现了回测日期范围的过滤。只有在指定的日期范围内,策略才会生成交易信号和执行交易。
可视化: 策略在图表上绘制了选定的移动平均线,使用plot()函数实现。这为交易者提供了直观的视觉参考,有助于理解策略的运作原理。
策略优势
灵活性: 策略支持多种移动平均线类型,包括SMA、EMA、SMMA(RMA)、WMA和VWMA。这种灵活性使得交易者可以根据不同的市场条件和个人偏好选择最适合的移动平均线类型。
可定制性: 用户可以自由调整移动平均线的周期,这使得策略能够适应不同的交易风格和市场周期。短期交易者可以选择较短的周期,而长期投资者则可以选择较长的周期。
趋势跟踪: 通过使用移动平均线交叉作为信号,策略能够有效地捕捉市场趋势。这使得交易者能够在趋势初期入场,并在趋势结束时退出。
明确的信号: 策略提供了清晰的买入和卖出信号,减少了主观判断的需要。这对于新手交易者尤其有帮助,因为它提供了一个客观的交易框架。
回测功能: 内置的日期范围过滤功能允许用户在特定的历史时期内回测策略。这对于策略优化和验证非常有价值,能够帮助交易者了解策略在不同市场环境下的表现。
可视化支持: 策略在图表上绘制了移动平均线,为交易者提供了直观的视觉参考。这有助于理解策略的运作原理,并可以辅助进行手动分析。
风险管理: 通过使用strategy.percent_of_equity来设置交易规模,策略实现了一定程度的风险管理。这确保了每次交易都使用账户价值的固定百分比,有助于控制风险。
策略风险
- 滞后性: 作为滞后指标,移动平均线可能无法及时捕捉到市场的快速变化。这可能导致在剧烈波动的市场中出现延迟的进场和出场信号,影响策略的性能。
解决方法:考虑结合其他技术指标,如动量指标或波动率指标,以提供更及时的市场洞察。
- 震荡市场中的假信号: 在横盘或震荡市场中,价格可能频繁地穿越移动平均线,导致大量的假信号和不必要的交易。这可能增加交易成本并降低策略的整体收益。
解决方法:引入过滤器,如交易量确认或价格波动阈值,以减少假信号的影响。
- 单一指标依赖: 策略主要依赖于移动平均线交叉,忽视了其他可能影响市场的因素。这种单一依赖可能导致在某些市场条件下表现不佳。
解决方法:考虑整合其他技术指标或基本面分析,以提供更全面的市场视角。
- 参数敏感性: 策略的性能高度依赖于所选择的移动平均线类型和周期。不同的参数设置可能导致显著不同的结果,增加了过度拟合的风险。
解决方法:进行广泛的参数优化和稳健性测试,以找到在各种市场条件下都表现良好的参数设置。
- 缺乏止损机制: 当前策略没有明确的止损机制,这可能导致在市场逆转时承受较大损失。
解决方法:实施止损策略,如固定止损、跟踪止损或基于波动率的止损,以限制潜在损失。
- 交易频率: 根据所选的移动平均线周期,策略可能产生过多或过少的交易信号。过多的交易可能增加成本,而过少的交易可能错过机会。
解决方法:仔细选择适合目标市场和交易风格的移动平均线周期,并考虑引入交易频率限制。
- 市场条件变化: 策略可能在某些市场条件下表现良好,但在其他条件下表现不佳。市场环境的变化可能影响策略的整体有效性。
解决方法:定期评估和调整策略,考虑使用自适应参数或机器学习技术来适应不同的市场环境。
策略优化方向
- 多重时间框架分析: 引入多重时间框架分析可以提供更全面的市场视角。例如,可以在较长时间框架上使用移动平均线来确定整体趋势方向,然后在较短时间框架上寻找具体的进场点。这样可以减少假信号,提高交易的准确性。
实现方法:使用security()函数获取不同时间框架的数据,并在策略逻辑中结合这些信息。
- 动态参数调整: 实现动态调整移动平均线周期的机制,使策略能够适应不同的市场条件。例如,可以根据市场波动率来调整移动平均线的周期,在高波动期使用较短的周期,在低波动期使用较长的周期。
实现方法:使用波动率指标(如ATR)来动态计算移动平均线的周期。
- 交易量确认: 引入交易量分析可以提高信号的可靠性。例如,可以要求价格突破移动平均线时伴随着高于平均的交易量,以确认突破的有效性。
实现方法:计算交易量的移动平均线,并将其作为额外的信号确认条件。
- 止损和获利目标: 实现动态的止损和获利目标机制可以改善策略的风险回报比。例如,可以使用ATR(Average True Range)来设置止损点,并根据市场波动调整获利目标。
实现方法:使用strategy.exit()函数设置止损和获利目标,并根据ATR动态调整这些值。
- 趋势强度过滤: 引入趋势强度指标,如ADX(Average Directional Index),可以帮助策略在强趋势市场中表现更好。只有在趋势足够强时才执行交易,可以减少震荡市场中的假信号。
实现方法:计算ADX指标,并将其作为额外的交易条件。
- 多指标融合: 结合其他技术指标,如RSI(相对强弱指标)或MACD(移动平均收敛散度),可以提供更全面的市场分析。这可以帮助确认移动平均线交叉信号,提高交易的准确性。
实现方法:计算额外的技术指标,并将它们整合到交易逻辑中。
- 市场regime检测: 实现市场regime(如趋势市场、震荡市场、高波动市场等)的检测机制,并根据不同的市场regime调整策略参数或交易逻辑。这可以使策略更好地适应不同的市场环境。
实现方法:使用统计方法或机器学习算法来检测市场regime,并据此调整策略参数。
- 风险管理优化: 改进风险管理机制,例如实现动态的头寸规模调整。可以根据账户净值、当前市场波动率或最近的交易表现来调整每次交易的资金比例。
实现方法:使用自定义函数计算每次交易的资金比例,并将其传递给strategy.entry()函数。
总结
自适应移动平均线交叉策略是一个灵活且可定制的趋势跟踪系统,适用于各种市场和交易风格。它的核心优势在于其简单性和适应性,允许交易者通过选择不同的移动平均线类型和周期来优化策略表现。策略提供了清晰的入场和出场信号,减少了主观判断的需要,这对于新手和有经验的交易者都具有吸引力。
然而,像所有交易策略一样,它也面临着一些风险和局限性。主要的挑战包括移动平均线固有的滞后性,在震荡市场中可能产生的假信号,以及对单一指标的依赖。为了应对这些挑战,我们提出了several优化方向,包括多重时间框架分析、动态参数调整、交易量确认、改进的风险管理机制等。
通过实施这些优化,交易者可以显著提高策略的鲁棒性和适应性。例如,引入多重时间框架分析可以提供更全面的市场视角,减少假信号;动态参数调整可以使策略更好地适应不同的市场条件;而改进的风险管理机制则可以优化策略的风险回报特征。
总的来说,自适应移动平均线交叉策略为交易者提供了一个坚实的基础,可以根据个人需求和市场环境进行进一步的定制和优化。通过持续的监控、评估和改进,交易者可以开发出一个既稳健又灵活的交易系统,在各种市场条件下都能保持竞争力。
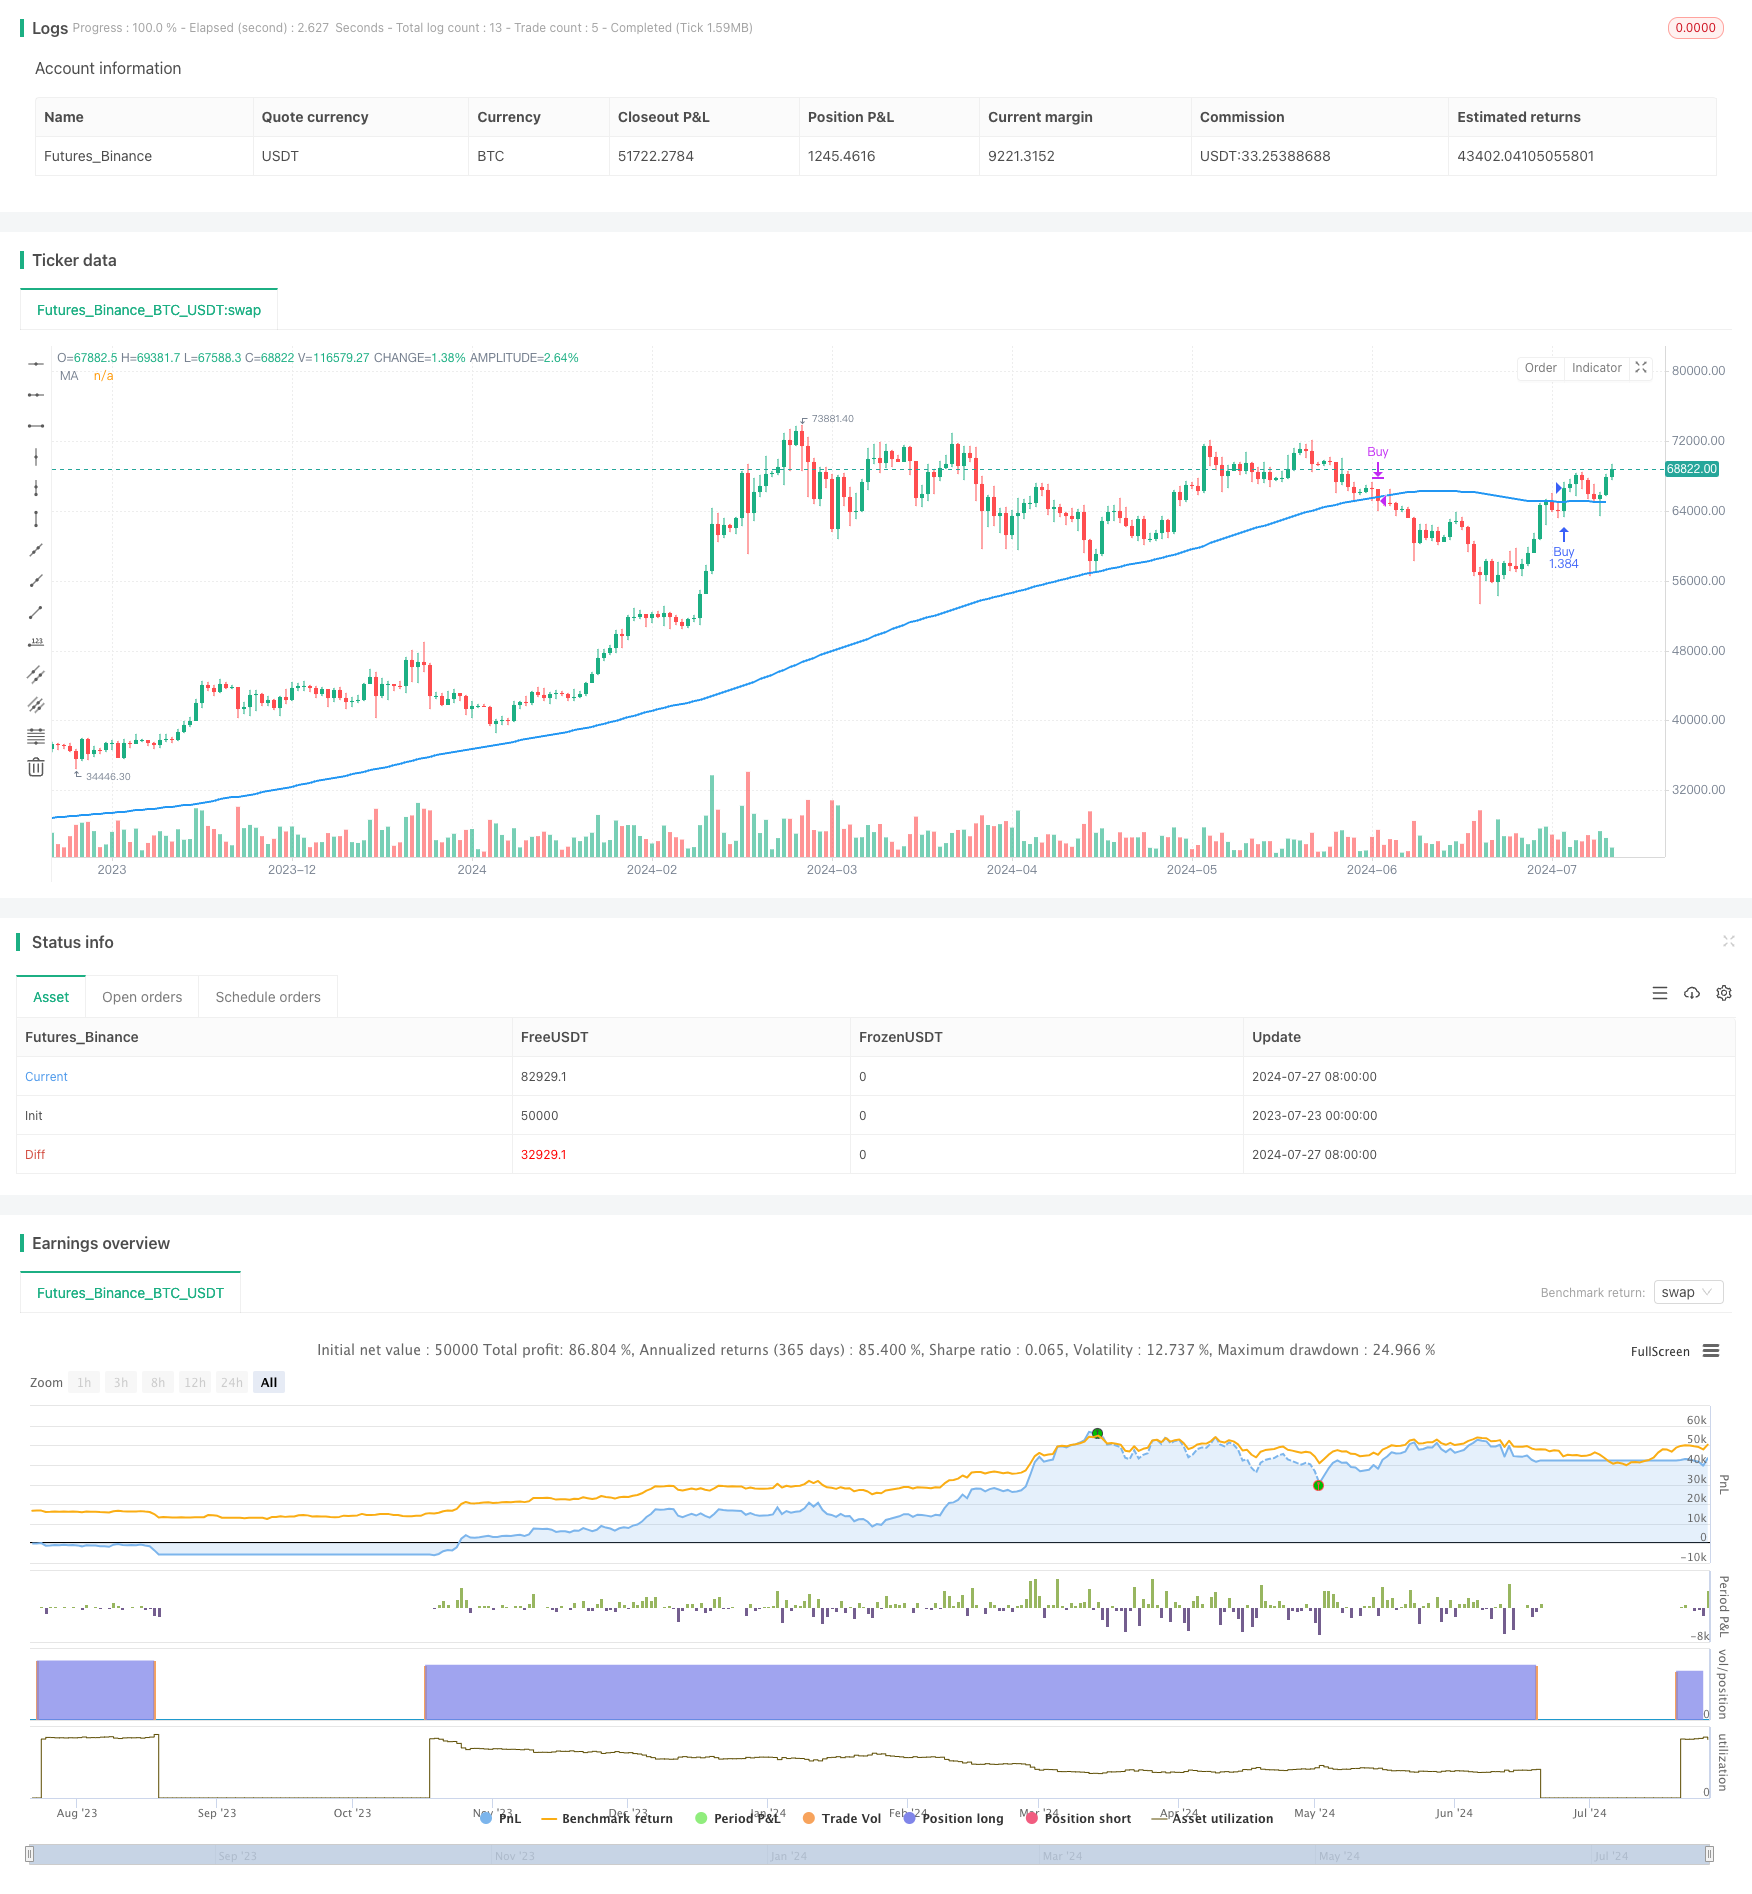
/*backtest
start: 2023-07-23 00:00:00
end: 2024-07-28 00:00:00
period: 1d
basePeriod: 1h
exchanges: [{"eid":"Futures_Binance","currency":"BTC_USDT"}]
*/

//@version=5
strategy("MA Cross Over Strategy", overlay=true, initial_capital=10000, process_orders_on_close=true, default_qty_type=strategy.percent_of_equity, default_qty_value=100)

// 参数:EMA的周期
ema_length = input.int(120, title="MA Length")
typeMA = input(title = "Method", defval = "SMA", options=["SMA", "EMA", "SMMA (RMA)", "WMA", "VWMA"], group="Smoothing")

ma(source, length, type) =>
    switch type
        "SMA" => ta.sma(source, length)
        "EMA" => ta.ema(source, length)
        "SMMA (RMA)" => ta.rma(source, length)
        "WMA" => ta.wma(source, length)
        "VWMA" => ta.vwma(source, length)
// 计算EMA
ma_value = ma(close, ema_length, typeMA)

// === INPUT BACKTEST RANGE ===
// i_from = input.time(defval = timestamp("01 Jan 2020 00:00 +0000"), title = "From")
// i_thru = input.time(defval = timestamp("01 Aug 2024 00:00 +0000"), title = "Thru")

// === INPUT SHOW PLOT ===
i_show = input     (defval = true, title = "Show Date Range")

// === FUNCTION EXAMPLE ===
date() => true

// 生成交易信号
var int position = na
cv = ta.crossover(close, ma_value)
cu = ta.crossunder(close, ma_value)
if date() and cv
    position := 1
else if date() and cu
    position := -1

// 显示MA
plot(ma_value, title='MA', color=color.blue, linewidth=2)


// 策略实现
if (position == 1)
    strategy.entry("Buy", strategy.long)
if (position == -1)
    strategy.close("Buy")