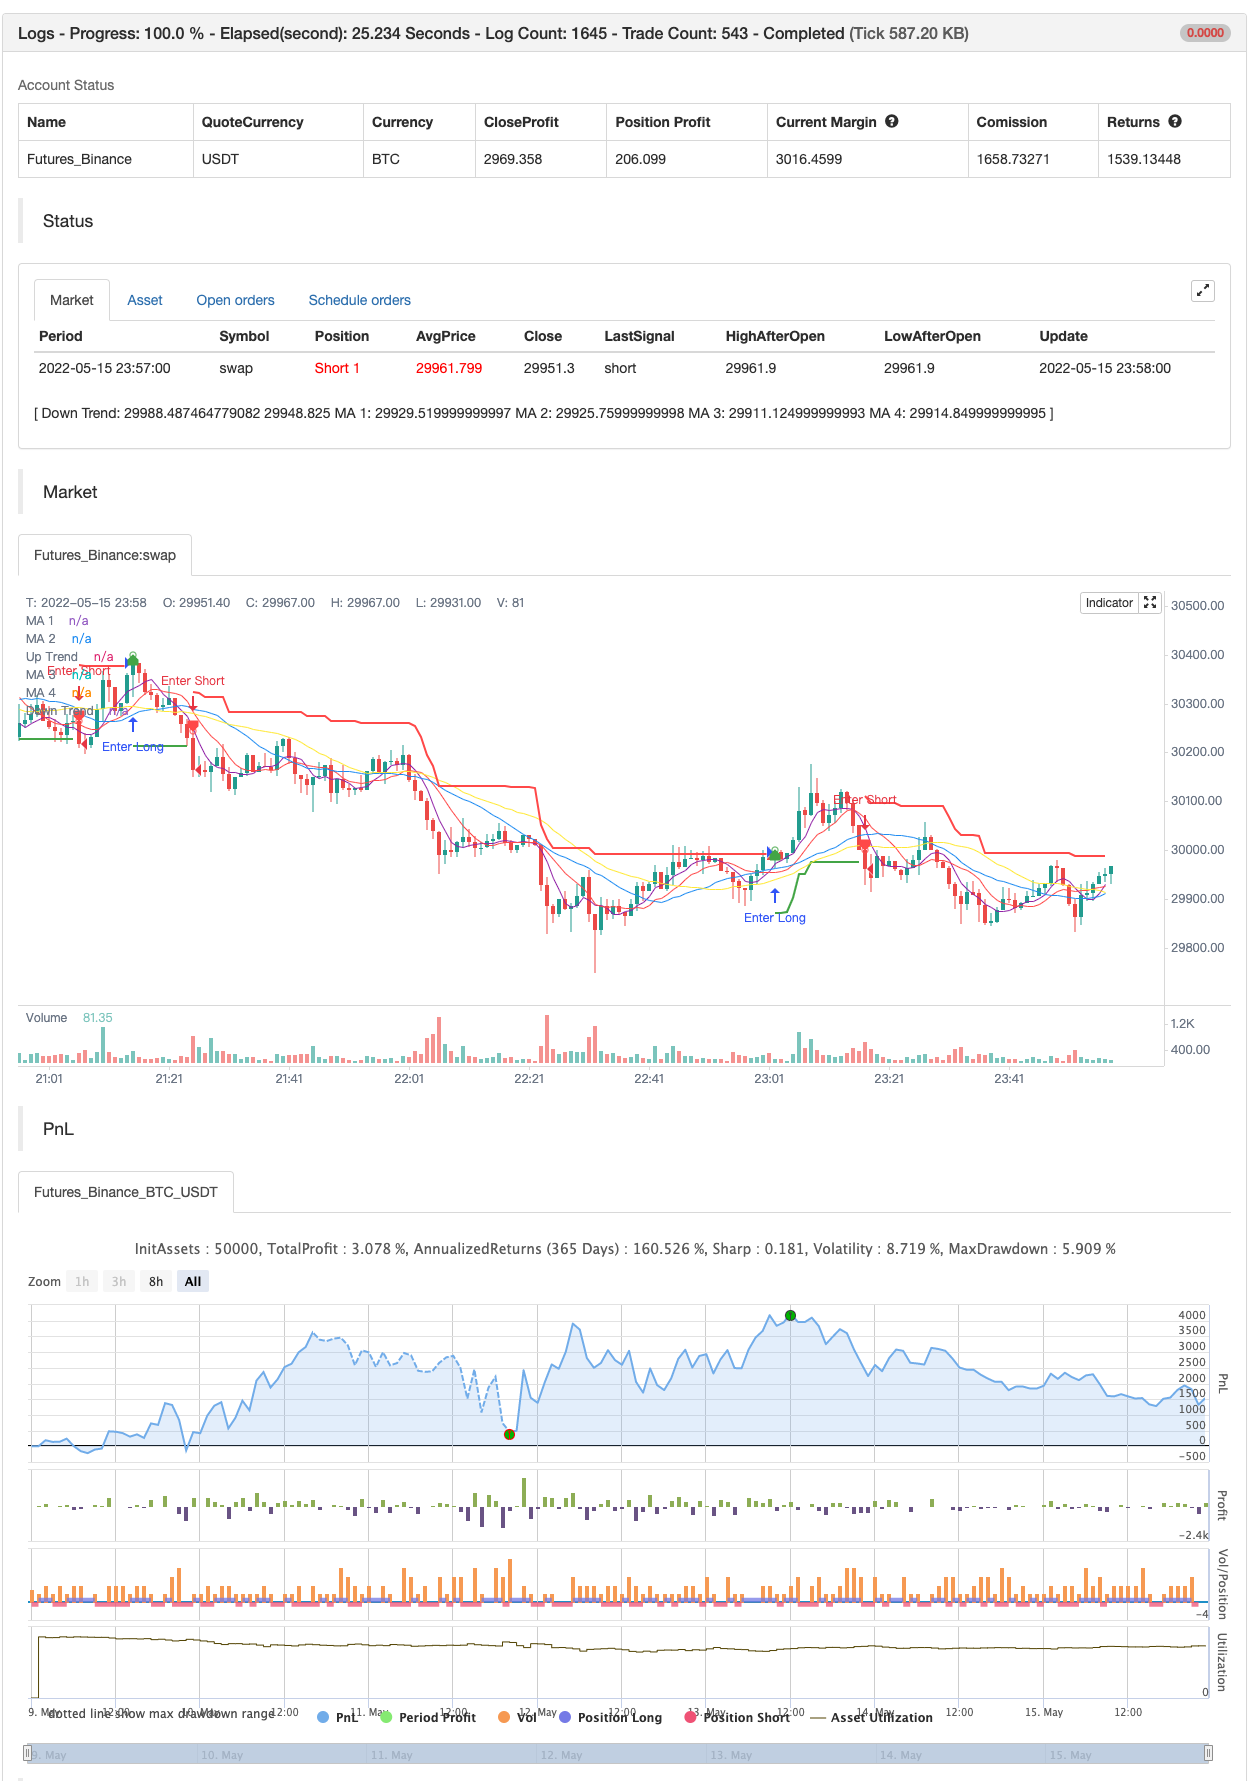
Supertrend+4 en mouvement
Auteur:ChaoZhang est là., Date: 2022-05-17 15h31minLes étiquettes:ATRSMA
Les valeurs d'épargne-perte et les moyennes mobiles peuvent être utilisées ensemble pour obtenir la meilleure position d'entrée et de sortie. Supertrend+4 déménagé par pejmantak123
test de retour

/*backtest
start: 2022-05-09 00:00:00
end: 2022-05-15 23:59:00
period: 1m
basePeriod: 1m
exchanges: [{"eid":"Futures_Binance","currency":"BTC_USDT"}]
*/

//@version=5
indicator("Supertrend+4moving", overlay=true, timeframe="", timeframe_gaps=true)

Periods = input(title='ATR Period', defval=20)
src = input(close, title='Source')
Multiplier = input.float(title='ATR Multiplier', step=0.1, defval=3.0)
changeATR = input(title='Change ATR Calculation Method ?', defval=true)
showsignals = input(title='Show Buy/Sell Signals ?', defval=true)
highlighting = input(title='Highlighter On/Off ?', defval=true)
atr2 = ta.sma(ta.tr, Periods)
atr = changeATR ? ta.atr(Periods) : atr2
up = src - Multiplier * atr
up1 = nz(up[1], up)
up := close[1] > up1 ? math.max(up, up1) : up
dn = src + Multiplier * atr
dn1 = nz(dn[1], dn)
dn := close[1] < dn1 ? math.min(dn, dn1) : dn
trend = 1
trend := nz(trend[1], trend)
trend := trend == -1 and close > dn1 ? 1 : trend == 1 and close < up1 ? -1 : trend
upPlot = plot(trend == 1 ? up : na, title='Up Trend', style=plot.style_linebr, linewidth=2, color=color.new(color.green, 0))
buySignal = trend == 1 and trend[1] == -1
plotshape(buySignal ? up : na, title='UpTrend Begins', location=location.absolute, style=shape.circle, size=size.tiny, color=color.new(color.green, 0))
plotshape(buySignal and showsignals ? up : na, title='Buy', text='Buy', location=location.absolute, style=shape.labelup, size=size.tiny, color=color.new(color.green, 0), textcolor=color.new(color.white, 0))
dnPlot = plot(trend == 1 ? na : dn, title='Down Trend', style=plot.style_linebr, linewidth=2, color=color.new(color.red, 0))
sellSignal = trend == -1 and trend[1] == 1
plotshape(sellSignal ? dn : na, title='DownTrend Begins', location=location.absolute, style=shape.circle, size=size.tiny, color=color.new(color.red, 0))
plotshape(sellSignal and showsignals ? dn : na, title='Sell', text='Sell', location=location.absolute, style=shape.labeldown, size=size.tiny, color=color.new(color.red, 0), textcolor=color.new(color.white, 0))
mPlot = plot(ohlc4, title='', style=plot.style_circles, linewidth=0)
longFillColor = highlighting ? trend == 1 ? color.green : color.white : color.white
shortFillColor = highlighting ? trend == -1 ? color.red : color.white : color.white
fill(mPlot, upPlot, title='UpTrend Highligter', color=longFillColor, transp=90)
fill(mPlot, dnPlot, title='DownTrend Highligter', color=shortFillColor, transp=90)
alertcondition(buySignal, title='SuperTrend Buy', message='SuperTrend Buy!')
alertcondition(sellSignal, title='SuperTrend Sell', message='SuperTrend Sell!')
changeCond = trend != trend[1]
alertcondition(changeCond, title='SuperTrend Direction Change', message='SuperTrend has changed direction!')

len1 = input.int(5, minval=1, title='Length 1')
src1 = input(close, title='Source')
offset1 = 0//input.int(title='Offset', defval=0, minval=-500, maxval=500)
out1 = ta.sma(src1, len1)
plot(out1, color=color.new(color.purple, 0), title='MA 1', offset=offset1)

len2 = input.int(10, minval=1, title='Length 2')
src2 = input(close, title='Source')
offset2 = 0//input.int(title='Offset', defval=0, minval=-500, maxval=500)
out2 = ta.sma(src2, len2)
plot(out2, color=color.new(color.red, 0), title='MA 2', offset=offset2)

len3 = input.int(20, minval=1, title='Length 3')
src3 = input(close, title='Source')
offset3 = 0//input.int(title='Offset', defval=0, minval=-500, maxval=500)
out3 = ta.sma(src3, len3)
plot(out3, color=color.new(color.blue, 0), title='MA 3', offset=offset3)

len4 = input.int(30, minval=1, title='Length 4')
src4 = input(close, title='Source')
offset4 = 0//input.int(title='Offset', defval=0, minval=-500, maxval=500)
out4 = ta.sma(src4, len4)
plot(out4, color=color.new(color.yellow, 0), title='MA 4', offset=offset4)

if buySignal
    strategy.entry("Enter Long", strategy.long)
else if sellSignal
    strategy.entry("Enter Short", strategy.short)
Contenu lié
- Le cloud et la stratégie ATR
- Stratégie de rupture de fausse position de support homogène multiple combinée avec le système d'arrêt de perte ATR
- AlphaTrend
- Concept du double SuperTrend
- La stratégie de rupture de l'ATR
- Indicateur de ligne
- Une stratégie de trading de volatilité peut être étendue
- Stratégie de suivi des tendances des lignes de signaux dynamiques associées à l'ATR et au volume des transactions
- Des lignes de tendance multiples dépassent les stratégies de quantification croisée
- Stratégie de régression à deux moyennes linéaires combinée à la maîtrise des risques
En savoir plus
- Pas de peinture.
- Les barres de dynamique REDK
- Superjump retourner en arrière Bollinger Band
- La tendance de Fukuiz
- Le BOT de Johnny
- SSL hybride
- Sortie du lustre
- Le rizotto
- Stratégie intraday de l'EMA dans le cloud
- Supertendance du point pivot
- ZigZag basé sur l'élan
- VuManChu chiffrement B + stratégie de divergence
- Concept du double SuperTrend
- Super scalper
- Tests de retour - indicateur
- Des tendances
- Le tueur de Sma BTC
- Modèle d'alerte ML
- La progression de Fibonacci avec des pauses
- RSI MTF Ob+Os