策略概述
本策略是一个基于多重趋势线突破的智能交易系统。它通过动态识别关键支撑阻力位,结合多种技术指标计算趋势线斜率,在价格突破趋势线时进行交易。该策略不仅能够捕捉市场趋势的转折点,还可以通过参数优化来适应不同市场环境。
策略原理
策略的核心逻辑包括三个主要部分:首先通过回溯期(Lookback Period)来识别关键的高点和低点,形成初始支撑阻力位;其次,根据选择的计算方法(ATR、标准差或线性回归)动态计算趋势线斜率,使趋势线能够更好地适应市场波动;最后,通过监测价格与趋势线的关系,在突破发生时触发交易信号。系统还包含防止回测过度拟合的机制,通过backpainting参数来模拟真实交易环境。
策略优势
- 适应性强:通过多种斜率计算方法和可调参数,策略可以适应不同市场环境
- 风险控制完善:趋势线的动态调整能力有助于及时识别趋势改变,减少假突破带来的损失
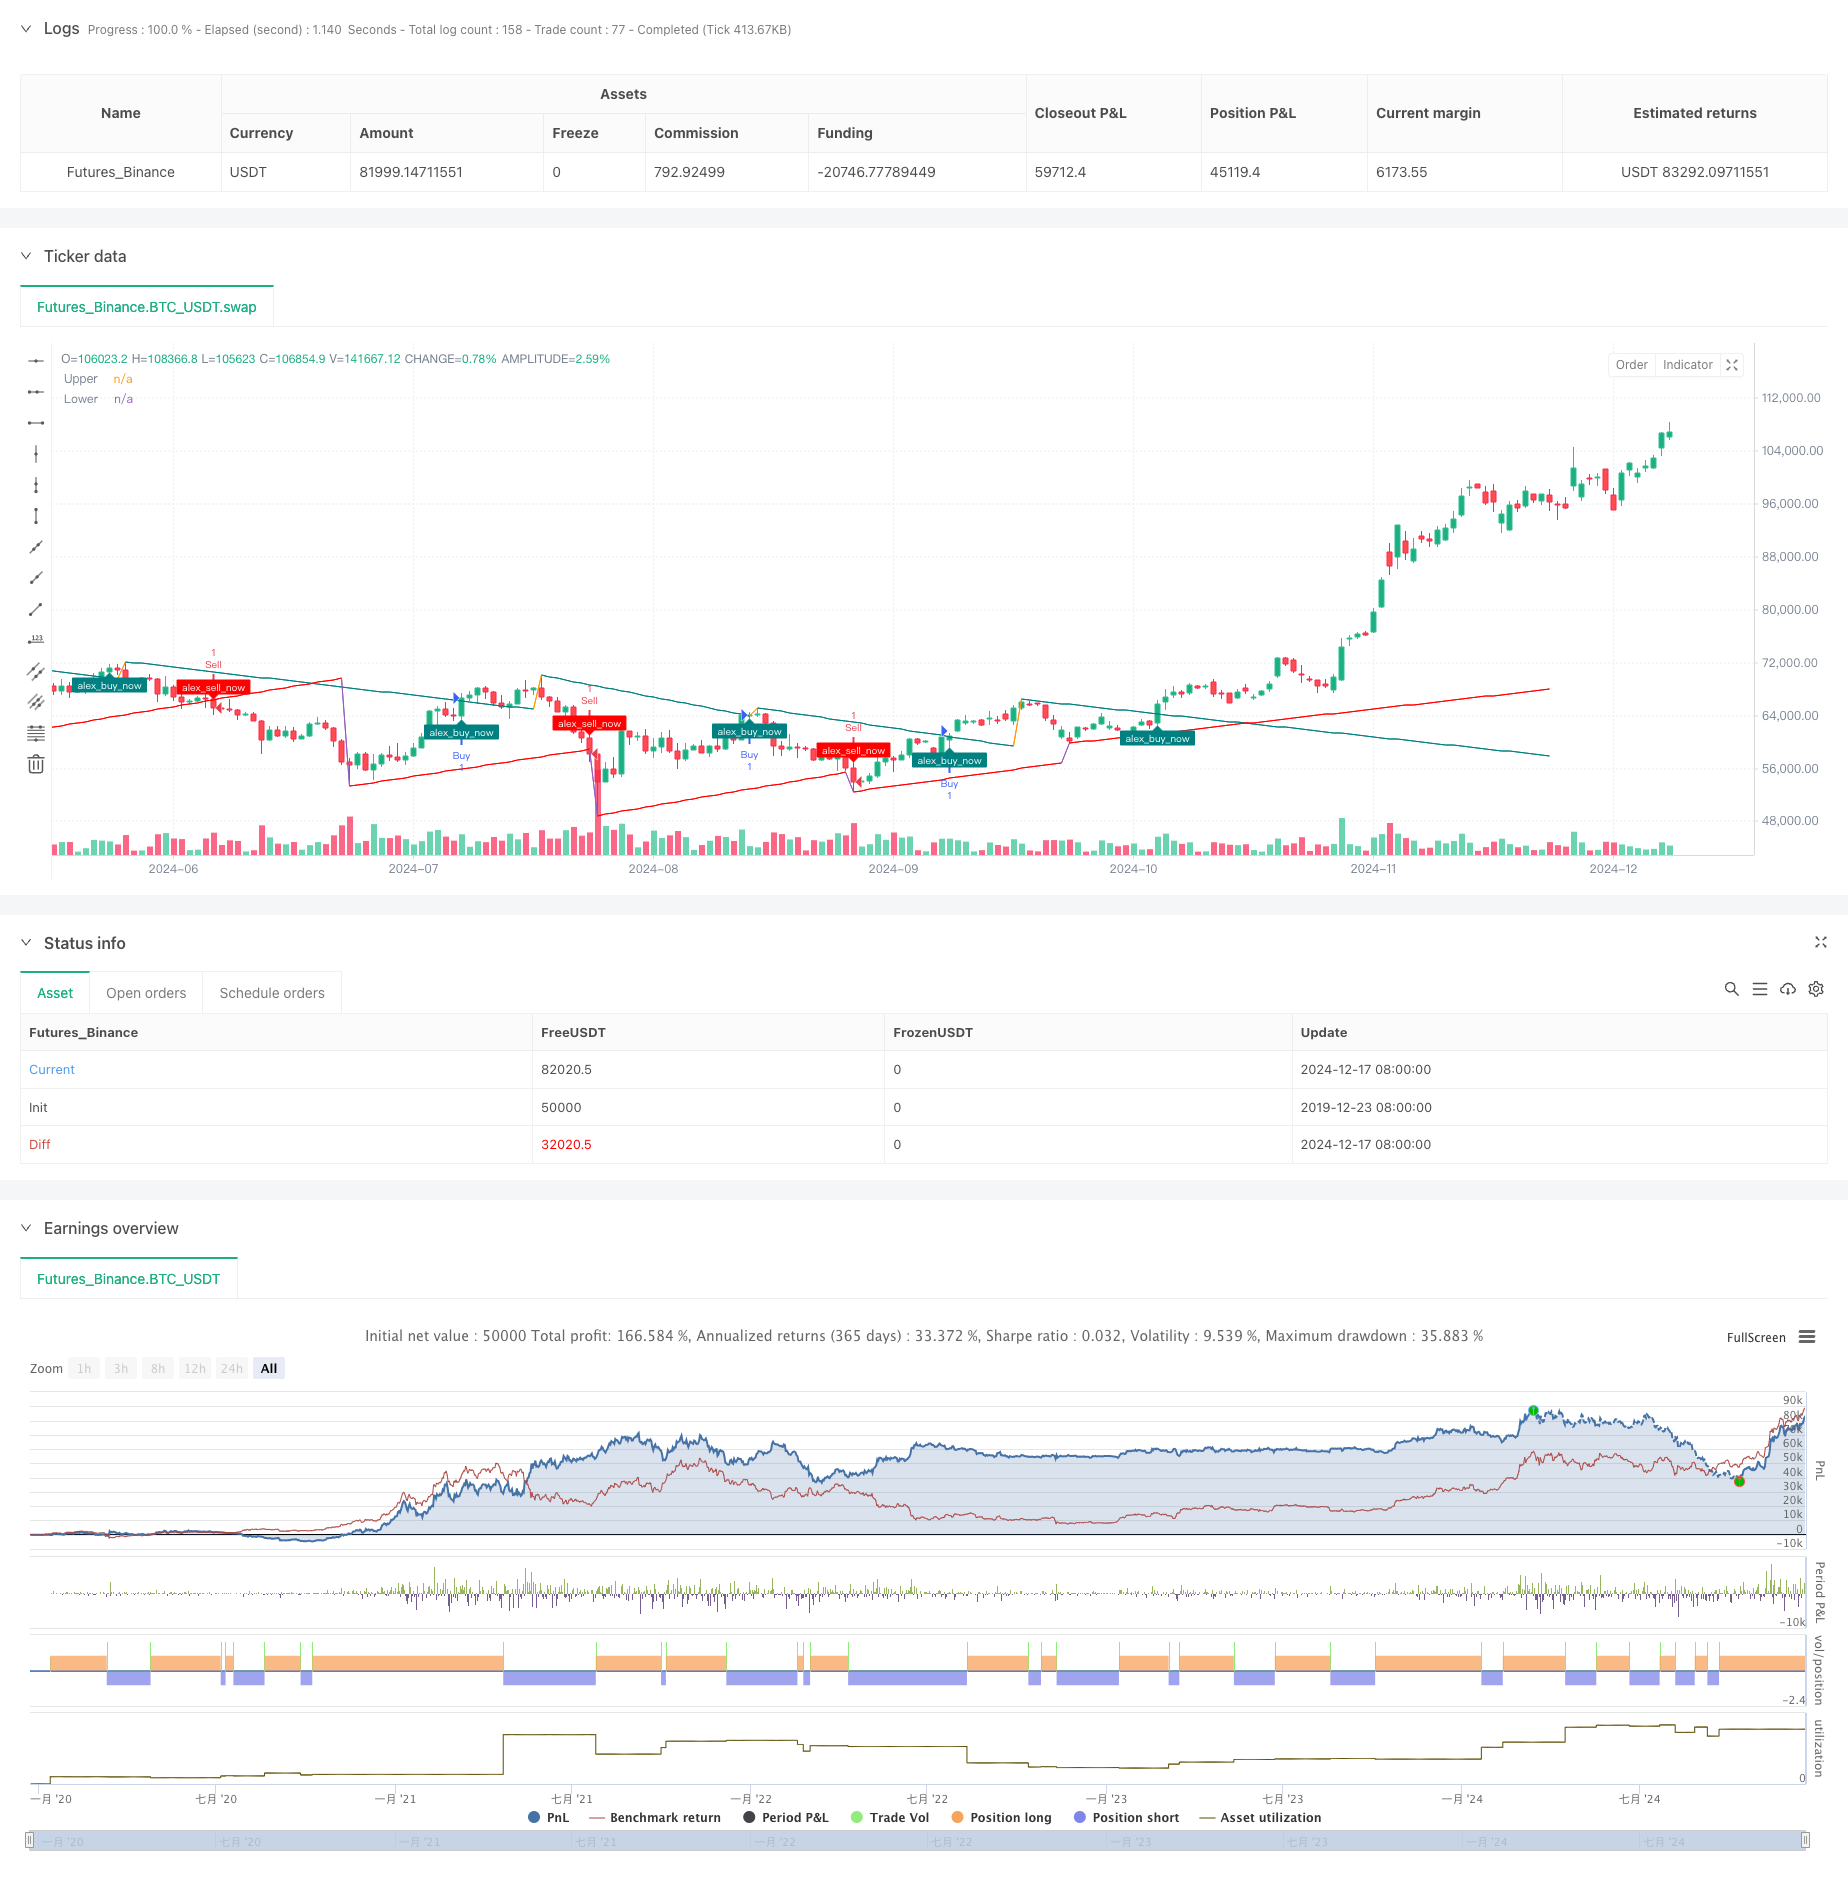
- 可视化效果好:策略提供清晰的视觉反馈,包括趋势线延伸和突破标记
- 信号确认机制:通过多重条件验证来确保交易信号的可靠性
策略风险
- 市场剧烈波动时可能产生虚假信号
- 趋势线计算的延迟性可能导致入场时机略有滞后
- 参数选择不当可能导致过度交易或错过重要机会
- 在横盘整理市场中可能产生频繁的假突破信号
策略优化方向
- 引入成交量指标来验证突破的有效性
- 添加市场波动率过滤器,在高波动期间调整参数
- 整合其他技术指标来提高信号的准确性
- 开发自适应的参数调整机制
- 增加止损和获利了结的智能计算方法
总结
该策略通过综合运用多种技术分析方法,构建了一个可靠的趋势线突破交易系统。它的优势在于能够动态适应市场变化,同时提供清晰的交易信号。虽然存在一些固有风险,但通过合理的参数设置和持续优化,可以显著提高策略的稳定性和盈利能力。
策略源码
/*backtest
start: 2019-12-23 08:00:00
end: 2024-12-18 08:00:00
period: 1d
basePeriod: 1d
exchanges: [{"eid":"Futures_Binance","currency":"BTC_USDT"}]
*/

// This Pine Script™ code is subject to the terms of the Mozilla Public License 2.0 at https://mozilla.org/MPL/2.0/
// © Alexgoldhunter

//@version=5
strategy("Trendlines with Breaks Strategy [AlexGoldHunter]", overlay=true)

// Input parameters
length = input.int(14, title="Swing Detection Lookback")
mult = input.float(1.0, title="Slope", minval=0, step=0.1)
calcMethod = input.string('Atr', title="Slope Calculation Method", options=['Atr','Stdev','Linreg'])
backpaint = input(true, tooltip='Backpainting offset displayed elements in the past. Disable backpainting to see real-time information returned by the indicator.')

// Style settings
upCss = input.color(color.teal, title="Up Trendline Color", group="Style")
dnCss = input.color(color.red, title="Down Trendline Color", group="Style")
showExt = input(true, title="Show Extended Lines")

// Calculations
var upper = 0.0
var lower = 0.0
var slope_ph = 0.0
var slope_pl = 0.0

var offset = backpaint ? length : 0

n = bar_index
src = close

ph = ta.pivothigh(length, length)
pl = ta.pivotlow(length, length)

// Slope Calculation Method
slope = switch calcMethod
    'Atr'    => ta.atr(length) / length * mult
    'Stdev'  => ta.stdev(src, length) / length * mult
    'Linreg' => math.abs(ta.sma(src * n, length) - ta.sma(src, length) * ta.sma(n, length)) / ta.variance(n, length) / 2 * mult

// Get slopes and calculate trendlines
slope_ph := ph ? slope : slope_ph
slope_pl := pl ? slope : slope_pl

upper := ph ? ph : upper - slope_ph
lower := pl ? pl : lower + slope_pl

var upos = 0
var dnos = 0
upos := ph ? 0 : close > upper - slope_ph * length ? 1 : upos
dnos := pl ? 0 : close < lower + slope_pl * length ? 1 : dnos

// Extended Lines
// var uptl  = line.new(na, na, na, na, color=upCss, style=line.style_dashed, extend=extend.right)
// var dntl  = line.new(na, na, na, na, color=dnCss, style=line.style_dashed, extend=extend.right)

// if ph and showExt
//     uptl.set_xy1(n - offset, backpaint ? ph : upper - slope_ph * length)
//     uptl.set_xy2(n - offset + 1, backpaint ? ph - slope : upper - slope_ph * (length + 1))

// if pl and showExt
//     dntl.set_xy1(n - offset, backpaint ? pl : lower + slope_pl * length)
//     dntl.set_xy2(n - offset + 1, backpaint ? pl + slope : lower + slope_pl * (length + 1))

// Plots
plot(backpaint ? upper : upper - slope_ph * length, title="Upper", color=ph ? na : upCss, offset=-offset)
plot(backpaint ? lower : lower + slope_pl * length, title="Lower", color=pl ? na : dnCss, offset=-offset)

// Breakouts
plotshape(upos > upos[1] ? low : na, title="Upper Break",
  style=shape.labelup, location=location.absolute, color=upCss, text="alex_buy_now", textcolor=color.white, size=size.tiny)
plotshape(dnos > dnos[1] ? high : na, title="Lower Break",
  style=shape.labeldown, location=location.absolute, color=dnCss, text="alex_sell_now", textcolor=color.white, size=size.tiny)

// Strategy: Buy and Sell conditions
if (upos > upos[1])
    strategy.entry("Buy", strategy.long)
if (dnos > dnos[1])
    strategy.entry("Sell", strategy.short)

// Alerts
alertcondition(upos > upos[1], title="Upward Breakout", message="Price broke the down-trendline upward")
alertcondition(dnos > dnos[1], title="Downward Breakout", message="Price broke the up-trendline downward")
相关推荐
- AlphaTrend
- 多重均线支撑位假突破策略结合ATR止损系统
- 双均线均值回归策略结合风险控制
- 一目云和ATR策略
- Supertrend+4moving
- Follow Line Indicator
- ATR均线突破策略
- 多周期均线交叉与波动率过滤动态策略
- 逆势突破交易系统:基于多日价格模式与波动率过滤的量化策略
- Concept Dual SuperTrend
更多内容
- 多重滤网趋势突破智能均线交易策略
- EMA均线动态突破与反转策略
- 动态趋势动量优化策略结合G通道指标
- 多层级跌幅ATH动态追踪三段买入策略
- 自适应VWAP波段基于Garman-Klass波动率动态跟踪策略
- 多指标趋势跟踪期权交易EMA交叉策略
- 多重指标波动率交易RSI-EMA-ATR策略
- 基于G通道和指数移动平均的量化多空转换策略
- 双均线趋势跟踪与风险控制策略
- 三重超趋势与布林带融合的多指标趋势跟踪策略
- 基于RSI动量和ADX趋势强度的资金管理系统
- 多时间周期流动性枢纽热力图量化策略
- 多重时框趋势追踪与ATR止盈止损策略
- 高级趋势追踪与自适应跟踪止损策略
- 多重技术指标趋势跟踪与动量RSI过滤交易策略
- 动态风险管理的指数均线交叉策略
- 双指数移动平均线与相对强弱指数交叉策略
- 双重动量振荡器智能择时交易策略
- 高级量化趋势捕捉策略结合动态范围过滤器
- TradingView信号执行策略(内建Http服务版本)