Stratégie multi-tendances
Aperçu
Cette stratégie utilise un ensemble d’indicateurs pour identifier la direction de la tendance, et utilise un suivi de la tendance pour capturer les opportunités de tendance sur la courte ligne centrale. La stratégie est spécialement conçue pour suivre la tendance, dans le but d’augmenter le taux de victoire et de réduire le recul.
Principe de stratégie
Le WVAP est utilisé pour déterminer le ratio des prix.
L’indicateur RSI détermine la dynamique de la surchauffe;
L’indicateur QQE a identifié une rupture de prix;
L’indicateur ADX détermine la force de la tendance.
L’indicateur de tendance des coraux est utilisé pour évaluer les tendances fondamentales.
Les indicateurs LSMA aident à juger les tendances;
Les signaux d’échange sont émis par la combinaison de plusieurs indicateurs.
La stratégie s’appuie principalement sur plusieurs indicateurs tels que le RSI, le QQE et l’ADX pour déterminer la direction et la force de la tendance, et utilise la courbe du Coral Trend Indicator comme critère de base pour déterminer la tendance. Lorsque des indicateurs tels que le RSI émettent un signal d’achat, si le Coral Trend Indicator affiche également une courbe ascendante, la stratégie choisit d’acheter.
Avantages stratégiques
La combinaison d’indicateurs multiples pour une meilleure précision de jugement;
En mettant l’accent sur le suivi des tendances et l’augmentation de la probabilité de profit;
Le site Web de Trading Range a été créé pour aider les traders à trouver des opportunités de trading en utilisant des outils innovants.
Le gouvernement a décidé de mettre en place un système d’audit de l’épargne et de l’investissement.
Les horaires et les heures de négociation sont rationnels et réduisent les risques.
Les stratégies sont claires, faciles à comprendre et à optimiser.
Le plus grand avantage de cette stratégie est la combinaison de plusieurs indicateurs, ce qui réduit dans une certaine mesure la probabilité d’erreur de jugement sur un seul indicateur et améliore l’exactitude des jugements. Tout en mettant l’accent sur le suivi des tendances et les idées de rupture, il est utile pour filtrer les opportunités de courte ligne dans les bases de référence. En outre, la stratégie ajoute des indicateurs fondamentaux, ce qui évite les opérations de contre-courant.
Risque stratégique
Il y a un certain retard dans le jugement de Multimedia, qui pourrait nous faire manquer le meilleur moment pour entrer dans le jeu.
Les contrôles de retrait ne sont pas parfaits et le risque de retrait est élevé.
La stratégie risque de manquer le signal lorsque les fondamentaux se retournent.
Il existe un risque de baisse des bénéfices en cas de mise en œuvre effective sans tenir compte des coûts de transaction.
Le plus grand risque de cette stratégie réside dans le fait qu’il peut y avoir un retard dans le jugement de la combinaison de plusieurs indicateurs, ce qui peut entraîner la perte du meilleur moment d’entrée, ce qui affecte l’espace de profit. De plus, le contrôle de rétractation de la stratégie n’est pas idéal et il existe un risque de rétractation plus élevé.
Orientation de l’optimisation de la stratégie
L’ajout d’une stratégie de stop-loss pour optimiser le contrôle des retraits;
Optimiser les paramètres et réduire les délais de l’indicateur;
L’augmentation de l’utilisation et de l’exactitude des indicateurs fondamentaux;
L’optimisation des paramètres dynamiques est réalisée en combinaison avec des algorithmes d’apprentissage automatique.
L’optimisation de la stratégie doit prendre en compte le contrôle des retraits, qui peut être ajouté à la stratégie de stop-loss mobile pour bloquer les bénéfices et réduire les retraits. Il est également possible d’optimiser le paramétrage, de réduire le délai des indicateurs et d’augmenter la sensibilité de la stratégie aux changements du marché. En outre, il est possible d’augmenter davantage les indicateurs de jugement fondamentaux et d’améliorer l’exactitude.
Résumer
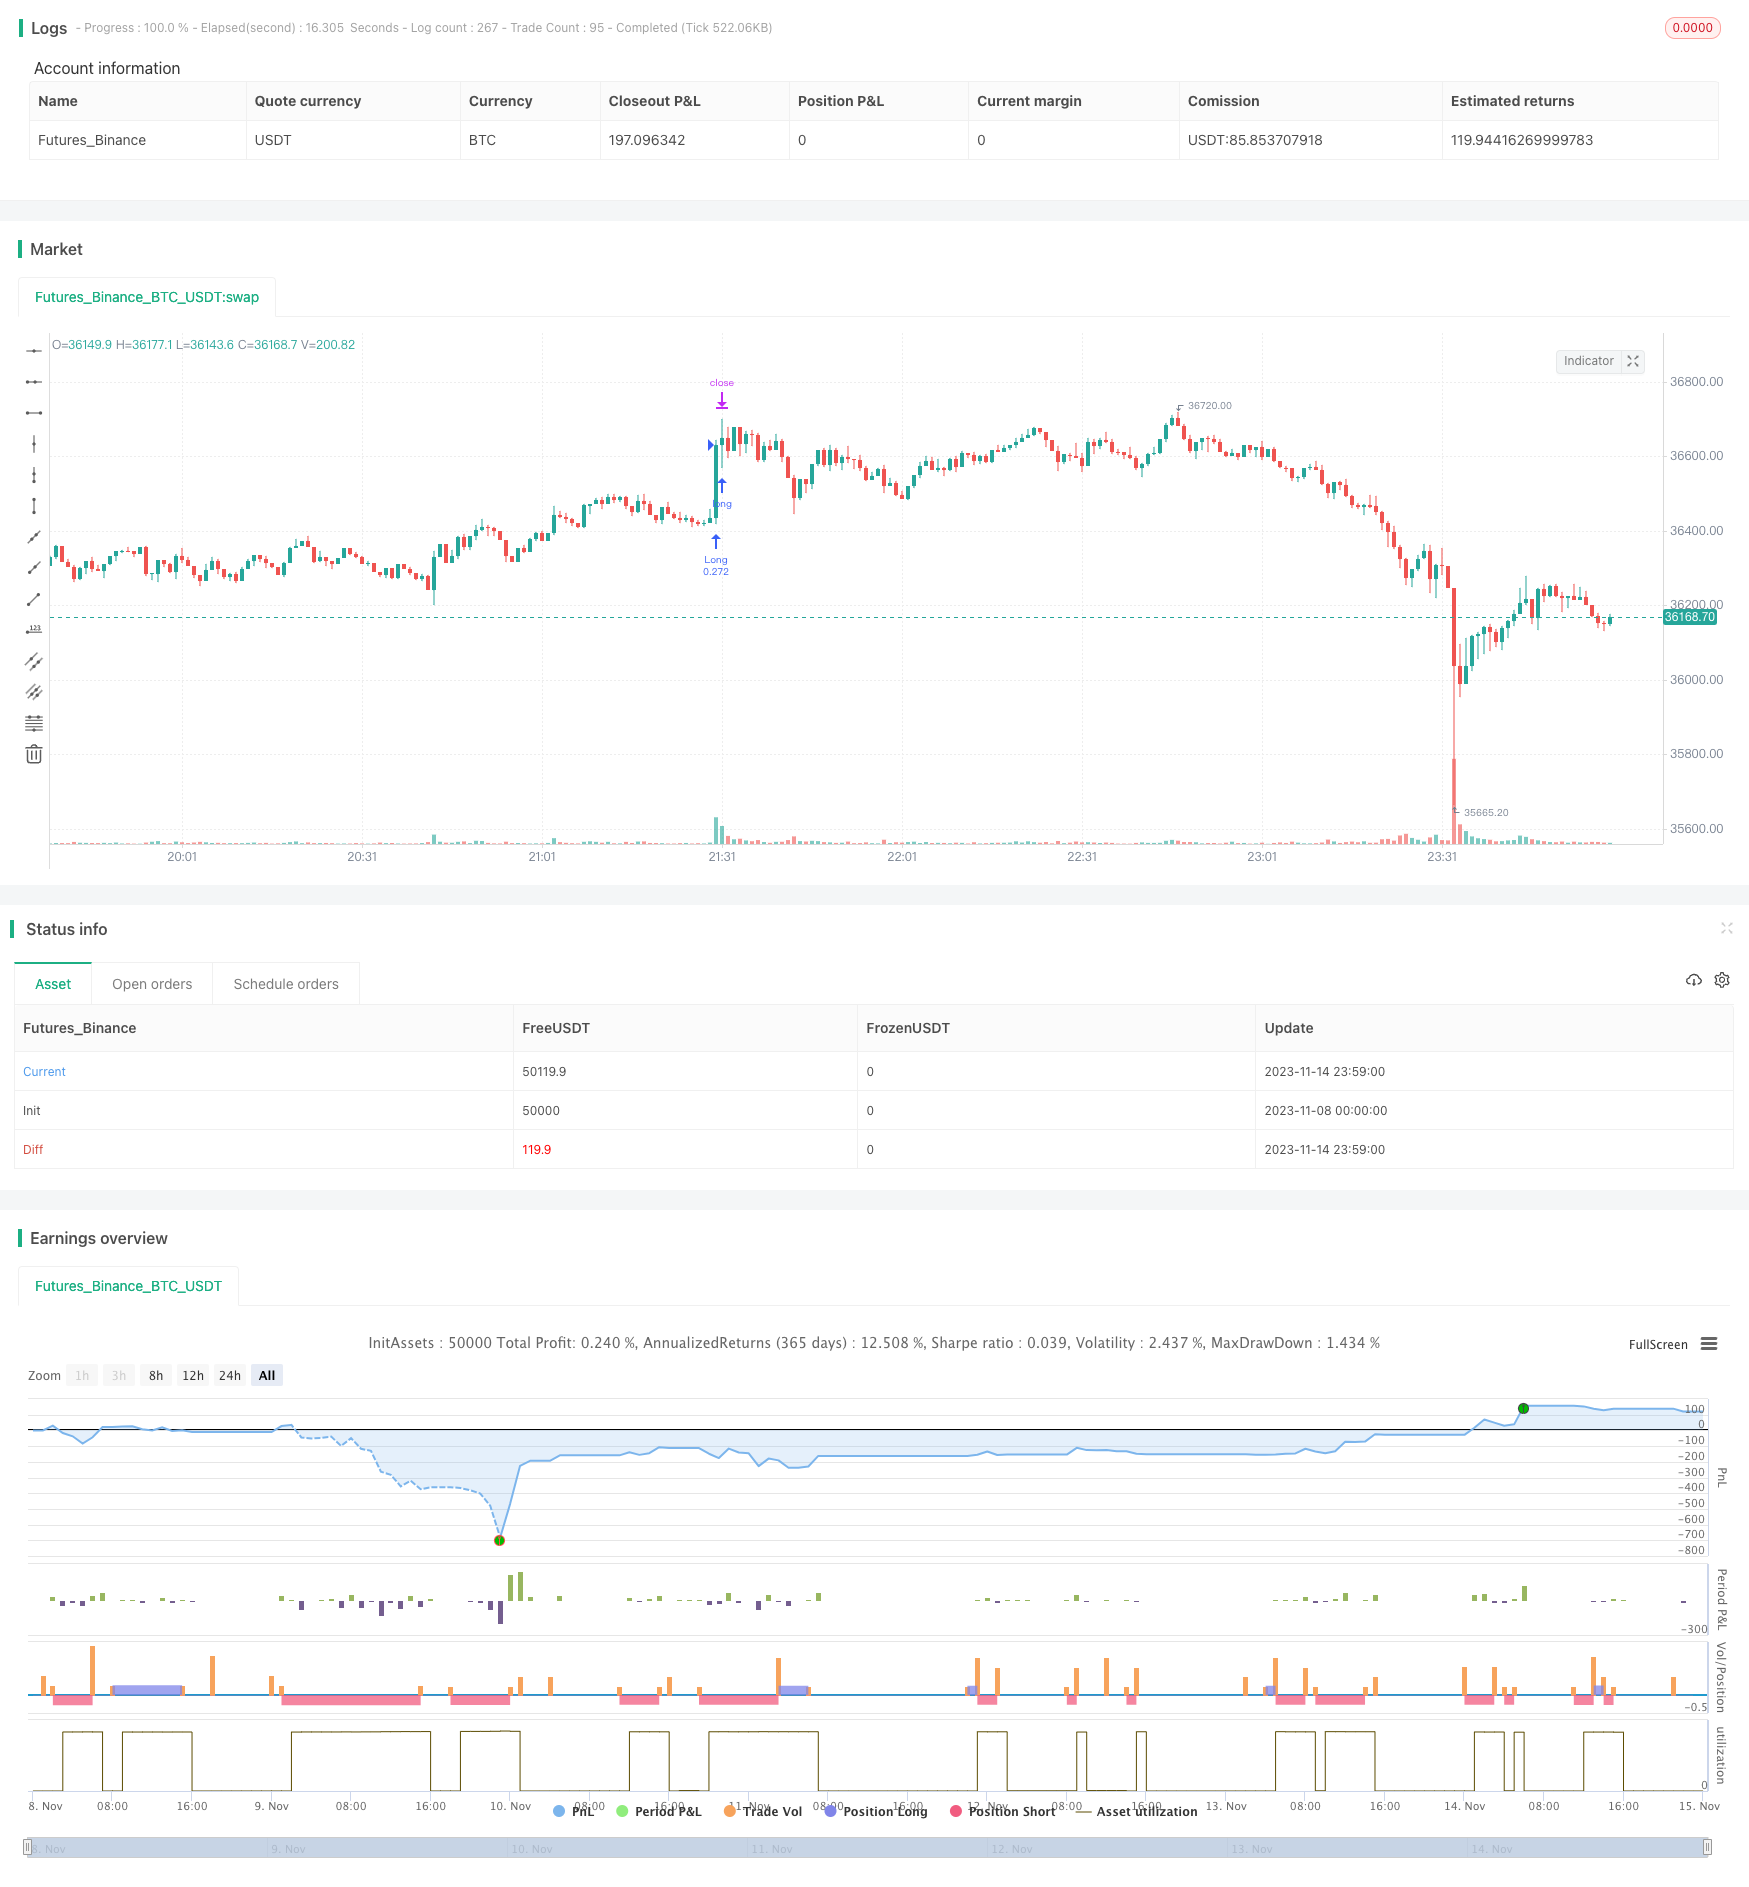
Cette stratégie intègre plusieurs indicateurs pour déterminer l’orientation de la tendance et adopte une conception de la stratégie de suivi de la tendance, visant à améliorer l’exactitude du jugement et à augmenter la probabilité de profit. La stratégie a des avantages en termes de jugement combiné, mettant l’accent sur le suivi de la tendance et la combinaison des éléments fondamentaux, mais il existe également des problèmes tels que l’erreur de jugement, le retard et le contrôle insuffisant des retraits.
/*backtest
start: 2023-11-08 00:00:00
end: 2023-11-15 00:00:00
period: 1m
basePeriod: 1m
exchanges: [{"eid":"Futures_Binance","currency":"BTC_USDT"}]
*/

// This source code is subject to the terms of the Mozilla Public License 2.0 at https://mozilla.org/MPL/2.0/
// © RolandoSantos

//@version=4
strategy(title = "VWAP Candles Strategy", overlay=true, shorttitle = "VWAP Cndl",  default_qty_type=strategy.cash, default_qty_value=10000, initial_capital=10000)

//Make inputs that set the take profit %
longProfitPerc = input(title="Take Long Profit % ", minval=0.0, step=0.1, defval=0.3) / 100
shortProfitPerc = input(title="Take Short Profit % ", minval=0.0, step=0.1, defval=0.95) / 100

tp = input(100, "Take Profit % QTY (How much profit you want to take after take profit target is triggered)")

// Figure out take profit price
longExitPrice  = strategy.position_avg_price * (1 + longProfitPerc)
shortExitPrice  = strategy.position_avg_price * (1 - shortProfitPerc)

//Use NYSE for Copp Curve entries and exits//
security = input("", title="Change this if you want to see Copp Curve calculated for current ticker. All Copp Curve calculations are base on NYSE Composite")
ticker = security(security,"", close)

///Copp Curve////

period_ = input(21, title="Length", minval=1)
isCentered = input(false, title="Centered")
barsback = period_/2 + 1
ma = sma(close, period_)
dpo = isCentered ? close[barsback] - ma : close - ma[barsback]


instructions =input(title="Standard Copp settings are (10, 14, 11) however, DOUBLE these lengths as alternate settings to (20,28,22) and you will find it may produce better results, but less trades", defval="-")
wmaLength = input(title="WMA Length (Experiment changing this to longer lengths for less trades, but higher win %)", type=input.integer, defval=20)
longRoCLength = input(title="Long RoC Length", type=input.integer, defval=28)
shortRoCLength = input(title="Short RoC Length", type=input.integer, defval=22)
source = ticker
curve = wma(roc(source, longRoCLength) + roc(source, shortRoCLength), wmaLength)

//////////// QQE////////////QQE///////////////////QQE////////////////////////

// This source code is subject to the terms of the Mozilla Public License 2.0 at https://mozilla.org/MPL/2.0/
// © KivancOzbilgic

//@version=4
src=input(close)
length = input(25,"RSI Length", minval=1)
SSF=input(9, "SF RSI SMoothing Factor", minval=1)
showsignals = input(title="Show Crossing Signals?", type=input.bool, defval=true)
highlighting = input(title="Highlighter On/Off ?", type=input.bool, defval=true)
RSII=ema(rsi(src,length),SSF)
TR=abs(RSII-RSII[1])
wwalpha = 1/ length
WWMA = 0.0
WWMA := wwalpha*TR + (1-wwalpha)*nz(WWMA[1])
ATRRSI=0.0
ATRRSI := wwalpha*WWMA + (1-wwalpha)*nz(ATRRSI[1])
QQEF=ema(rsi(src,length),SSF)
QUP=QQEF+ATRRSI*4.236
QDN=QQEF-ATRRSI*4.236
QQES=0.0
QQES:=QUP<nz(QQES[1]) ? QUP : QQEF>nz(QQES[1]) and QQEF[1]<nz(QQES[1]) ? QDN :  QDN>nz(QQES[1]) ? QDN : QQEF<nz(QQES[1]) and QQEF[1]>nz(QQES[1]) ? QUP : nz(QQES[1])
//QQF=plot(QQEF,"FAST",color.maroon,2)
//QQS=plot(QQES,"SLOW",color=color.blue, linewidth=1)
buySignalr = crossover(QQEF, QQES)
sellSignalr = crossunder(QQEF, QQES)
buyr = QQEF > QQES


////QQE////////////////QQE/////////////////QQE/////////////////

//////////////LSMA//////////////////////////


//  LSMA 1 Settings & Plot
lsma1Length = input(100, minval=1, title="LSMA 1")
lsma1Offset = input(title="LSMA 1 Offset", type=input.integer, defval=0)
lsma1Source = input(close, title="LSMA 1 Source")
lsma1 = linreg(lsma1Source, lsma1Length, lsma1Offset)
lsma1_std_dev = stdev(abs(lsma1[1] - lsma1), lsma1Length)
//plot(lsma1, color=(lsma1 > lsma1[1] ? color.yellow : color.blue), title="LSMA 1", linewidth=2, transp=0)

////////////LSMA///////////////////


//////////////////ADX////////////////////

len = input(14)
th = input(20)

TrueRange = max(max(high-low, abs(high-nz(close[1]))), abs(low-nz(close[1])))
DirectionalMovementPlus = high-nz(high[1]) > nz(low[1])-low ? max(high-nz(high[1]), 0): 0
DirectionalMovementMinus = nz(low[1])-low > high-nz(high[1]) ? max(nz(low[1])-low, 0): 0

SmoothedTrueRange = 0.0
SmoothedTrueRange := nz(SmoothedTrueRange[1]) - (nz(SmoothedTrueRange[1])/len) + TrueRange

SmoothedDirectionalMovementPlus = 0.0
SmoothedDirectionalMovementPlus := nz(SmoothedDirectionalMovementPlus[1]) - (nz(SmoothedDirectionalMovementPlus[1])/len) + DirectionalMovementPlus

SmoothedDirectionalMovementMinus = 0.0
SmoothedDirectionalMovementMinus := nz(SmoothedDirectionalMovementMinus[1]) - (nz(SmoothedDirectionalMovementMinus[1])/len) + DirectionalMovementMinus

DIPlus = SmoothedDirectionalMovementPlus / SmoothedTrueRange * 100
DIMinus = SmoothedDirectionalMovementMinus / SmoothedTrueRange * 100
DX = abs(DIPlus-DIMinus) / (DIPlus+DIMinus)*100
ADX = sma(DX, len)

///////////////////ADX/////////////////////


/////////////sqz momentum/////////////////////////

//
// @author LazyBear & ChrisMoody complied by GIS_ABC
//
lengthBB = input(20, title="BB Length")
mult = input(2.0,title="BB MultFactor")
lengthKC=input(20, title="KC Length")
multKC = input(1.5, title="KC MultFactor")

useTrueRange = input(true, title="Use TrueRange (KC)")

// Calculate BB
sourceBB = close
basis = sma(sourceBB, lengthBB)
dev = multKC * stdev(source, lengthBB)
upperBB = basis + dev
lowerBB = basis - dev

// Calculate KC
maKC = sma(sourceBB, lengthKC)
rangeKC = useTrueRange ? tr : (high - low)
rangema = sma(rangeKC, lengthKC)
upperKC = maKC + rangema * multKC
lowerKC = maKC - rangema * multKC

sqzOn  = (lowerBB > lowerKC) and (upperBB < upperKC)
sqzOff = (lowerBB < lowerKC) and (upperBB > upperKC)
noSqz  = (sqzOn == false) and (sqzOff == false)

val = linreg(source  -  avg(avg(highest(high, lengthKC), lowest(low, lengthKC)),sma(close,lengthKC)),lengthKC,0)


////////////////////////////

/////// RSI on EMA/////////////////

lenrsi = input(13, minval=1, title="Length")
srcrsi = linreg(hlc3,100,0)
up = rma(max(change(srcrsi), 0), lenrsi)
down = rma(-min(change(srcrsi), 0), lenrsi)
rsi = down == 0 ? 100 : up == 0 ? 0 : 100 - (100 / (1 + up / down))
rsicolor = rsi > rsi[1] ? color.green : color.red
//plot(rsi,color = rsicolor)
//hline(20,color=color.green)
//hline(80,color=color.red)
vwaprsi = rsi(vwap(hlc3),13)
vwaprsicolor = vwaprsi > vwaprsi[1] ? color.blue : color.yellow
emarsi = ema(rsi,13)
emarsicolor = emarsi > emarsi[1] ? color.green : color.red
//plot(emarsi,color=emarsicolor)
//plot(vwaprsi,color=vwaprsicolor)

/////// RSI on VWMA/////////////////

lenrsiv = input(23, minval=1, title="Length RSI VWMA")
srcrsiv = vwma(linreg(close,23,0),23)
upv = rma(max(change(srcrsiv), 0), lenrsiv)
downv = rma(-min(change(srcrsiv), 0), lenrsiv)
rsiv = downv == 0 ? 100 : upv == 0 ? 0 : 100 - (100 / (1 + upv / downv))
rsicolorv = rsiv > rsiv[1] ? color.green : color.red

/////////////////////////////////////

/////////////////////////////////////

////////////////coral trend////////////////////
//
// @author LazyBear
// List of all my indicators:
// https://docs.google.com/document/d/15AGCufJZ8CIUvwFJ9W-IKns88gkWOKBCvByMEvm5MLo/edit?usp=sharing
//
//study(title="Coral Trend Indicator [LazyBear]", shorttitle="CTI_LB", overlay=true)
srcCT=close
i1 = 1.0
i2 = 1.0
i3 = 1.0
i4 = 1.0
i5 = 1.0
i6 = 1.0

sm =input(21, title="Smoothing Period")
cd = input(0.4, title="Constant D")
ebc=input(false, title="Color Bars")
ribm=input(false, title="Ribbon Mode")
di = (sm - 1.0) / 2.0 + 1.0
c1 = 2 / (di + 1.0)
c2 = 1 - c1
c3 = 3.0 * (cd * cd + cd * cd * cd)
c4 = -3.0 * (2.0 * cd * cd + cd + cd * cd * cd)
c5 = 3.0 * cd + 1.0 + cd * cd * cd + 3.0 * cd * cd
i1 := c1*srcCT + c2*nz(i1[1])
i2 := c1*i1 + c2*nz(i2[1])
i3 := c1*i2 + c2*nz(i3[1])
i4 := c1*i3 + c2*nz(i4[1])
i5 := c1*i4 + c2*nz(i5[1])
i6 := c1*i5 + c2*nz(i6[1])

bfr = -cd*cd*cd*i6 + c3*(i5) + c4*(i4) + c5*(i3)
// --------------------------------------------------------------------------
// For the Pinescript coders: Determining trend based on the mintick step.
// --------------------------------------------------------------------------
//bfrC = bfr - nz(bfr[1]) > syminfo.mintick ? green : bfr - nz(bfr[1]) < syminfo.mintick ? red : blue
//bfrC = bfr > nz(bfr[1]) ? green : bfr < nz(bfr[1])  ? red : blue
//tc=ebc?gray:bfrC
//plot(ribm?na:bfr, title="Trend", linewidth=3)
//bgcolor(ribm?bfrC:na, transp=50)
//barcolor(ebc?bfrC:na)
////////////////////////////////////////////////////////////////

///////////////////VWAP///////////////////


//------------------------------------------------

//------------------------------------------------
NormalVwap=vwap(hlc3)
H = vwap(high)
L = vwap(low)
O = vwap(open)
C = vwap(close)

left = 30

left_low = lowest(left)
left_high = highest(left)
newlow = low <= left_low
newhigh = high >= left_high

q = barssince(newlow)
w = barssince(newhigh)
col2 = q < w ?  #8B3A3A : #9CBA7F
col2b=O > C?color.red:color.lime


AVGHL=avg(H,L)
AVGOC=avg(O,C)
col=AVGHL>AVGOC?color.lime:color.red
col3=open > AVGOC?color.lime:color.red
//plotcandle(O,H,L,C,color=col2b)
//plot(H, title="VWAP", color=red)
//plot(L, title="VWAP", color=lime)
//plot(O, title="VWAP", color=blue)
//plot(C, title="VWAP", color=black)

//plot(NormalVwap, color=col2b)


/////////////////////////////////////////////////////////////////////////////


///Trade Conditions///
t = time(timeframe.period, "0930-1500")

long = vwaprsi > vwaprsi[1] and rsi>rsi[1] and vwaprsi < 20 //vwaprsi > 98 and rsi > 50 and rsi[1] < rsi and rsi[1] < rsi[2] //crossover(rsi,20)//O<C  and O > linreg(hlc3,100,0) and linreg(hlc3,100,0) > linreg(hlc3,100,0)[1] and AVGHL>AVGOC and t //O < C  and close > vwap(hlc3) and ADX > ADX[1]  //and val > nz(val[1]) and close > vwap(hlc3) and open > sma(close,23) and close > vwap(hlc3)  and t  //and rsi > rsi[1] and open > ema(close,13) and open > bfr and bfr > bfr[1]
close_long = crossover(vwaprsi,99.8)  //C < O // linreg(hlc3,100,0) and linreg(hlc3,100,0) < linreg(hlc3,100,0)[1] //O > C and val < nz(val[1]) // and close < vwap(hlc3)
close_short = rsiv > rsiv[1] and rsiv[2] > rsiv[1]//vwaprsi > vwaprsi[1] or rsi > rsi[1] // vwaprsi > 99 and rsi > 99 and rsi > rsi[1] and vwaprsi > vwaprsi[1]//vwaprsi > vwaprsi[1] and rsi>rsi[1] and vwaprsi < 20 //vwaprsi > 98 and rsi > 50 and rsi[1] < rsi and rsi[1] < rsi[2] //crossover(rsi,20)//O<C  and O > linreg(hlc3,100,0) and linreg(hlc3,100,0) > linreg(hlc3,100,0)[1] and AVGHL>AVGOC and t //O < C  and close > vwap(hlc3) and ADX > ADX[1]  //and val > nz(val[1]) and close > vwap(hlc3) and open > sma(close,23) and close > vwap(hlc3)  and t  //and rsi > rsi[1] and open > ema(close,13) and open > bfr and bfr > bfr[1]
short = rsiv > 95 and rsiv < rsiv[1] and rsiv[2] < rsiv[1] //vwaprsi < 1 and rsi < 1 and rsi < rsi[1] and vwaprsi < vwaprsi[1] and t //crossover(vwaprsi,99.8)  //C < O // linreg(hlc3,100,0) and linreg(hlc3,100,0) < linreg(hlc3,100,0)[1] //O > C and val < nz(val[1]) // and close < vwap(hlc3)

//long = vwaprsi > vwaprsi[1] and emarsi > emarsi[1] and emarsi[2] > emarsi[1] and ADX > 25//O<C  and O > linreg(hlc3,100,0) and linreg(hlc3,100,0) > linreg(hlc3,100,0)[1] and AVGHL>AVGOC and t //O < C  and close > vwap(hlc3) and ADX > ADX[1]  //and val > nz(val[1]) and close > vwap(hlc3) and open > sma(close,23) and close > vwap(hlc3)  and t  //and rsi > rsi[1] and open > ema(close,13) and open > bfr and bfr > bfr[1]
//close_long = vwaprsi < vwaprsi[1] or emarsi < emarsi[1]//C < O // linreg(hlc3,100,0) and linreg(hlc3,100,0) < linreg(hlc3,100,0)[1] //O > C and val < nz(val[1]) // and close < vwap(hlc3)
//close_long = O>C  or lsma1 < H  //  or O > linreg(hlc3,100,0) //and linreg(hlc3,100,0) > linreg(hlc3,100,0)[1] and AVGHL>AVGOC and t //O < C  and close > vwap(hlc3) and ADX > ADX[1]  //and val > nz(val[1]) and close > vwap(hlc3) and open > sma(close,23) and close > vwap(hlc3)  and t  //and rsi > rsi[1] and open > ema(close,13) and open > bfr and bfr > bfr[1]
//long = rsi > rsi[1] and rsi[1] >rsi[2] and lsma1 > lsma1[1] and bfr > bfr[1] and O<C and lsma1 > L  and close > close[1] and ADX > ADX[1] and ADX[1] > ADX[2] and ADX > 20 and rsi > rsi[1] and t   // linreg(hlc3,100,0) and linreg(hlc3,100,0) < linreg(hlc3,100,0)[1] //O > C and val < nz(val[1]) // and close < vwap(hlc3)

//close_short = O<C  or lsma1 > H  //  or O > linreg(hlc3,100,0) //and linreg(hlc3,100,0) > linreg(hlc3,100,0)[1] and AVGHL>AVGOC and t //O < C  and close > vwap(hlc3) and ADX > ADX[1]  //and val > nz(val[1]) and close > vwap(hlc3) and open > sma(close,23) and close > vwap(hlc3)  and t  //and rsi > rsi[1] and open > ema(close,13) and open > bfr and bfr > bfr[1]
//short = rsi < rsi[1] and rsi[1] <rsi[2] and lsma1 < lsma1[1] and bfr < bfr[1] and O>C and lsma1 < L  and close < close[1] and ADX > ADX[1] and ADX[1] > ADX[2] and ADX > 20 and rsi < rsi[1] and t   // linreg(hlc3,100,0) and linreg(hlc3,100,0) < linreg(hlc3,100,0)[1] //O > C and val < nz(val[1]) // and close < vwap(hlc3)


/// Start date
startDate = input(title="Start Date", defval=1, minval=1, maxval=31)
startMonth = input(title="Start Month", defval=1, minval=1, maxval=12)
startYear = input(title="Start Year", defval=2021, minval=1800, maxval=2100)


// See if this bar's time happened on/after start date
afterStartDate = true


///Entries and Exits//
if (long and afterStartDate)
    strategy.entry("Long", strategy.long, comment = "Open Long")
//    strategy.close("Short", strategy.short,qty_percent=100, comment = "close Short")
if (short and afterStartDate)
    strategy.entry("Short", strategy.short, comment = "Open Short")


if (close_long and afterStartDate  )
    strategy.close("Long", strategy.long, qty_percent=100, comment="close Long")
//    strategy.entry("Short", strategy.short, comment="Open Short")

if (close_short and afterStartDate  )
    strategy.close("Short", strategy.short, qty_percent=100, comment="close Long")

if ( hour(time) == 15 and minute(time) > 15 )
    strategy.close_all()


//Submit exit orders based on take profit price
if (strategy.position_size > 0 and afterStartDate)
    strategy.exit(id="Long", qty_percent=tp, limit=longExitPrice)

if (strategy.position_size < 0 and afterStartDate)
    strategy.exit(id="Short", qty_percent=tp, limit=shortExitPrice)