Stratégie de suivi de tendance basée sur la rotation du momentum sur plusieurs périodes de temps
Aperçu
La stratégie utilise une combinaison de moyennes mobiles sur des périodes de temps, pour identifier les rotations de tendance sur le graphique horaire des grandes et moyennes heures, permettant de suivre les transactions de tendance à faible risque. La stratégie offre une flexibilité de configuration et des avantages de simplicité et d’efficacité financière élevés, adaptés aux traders qui détiennent des positions de suivi de tendance sur les longues et moyennes lignes.
Définition
La stratégie utilise trois moyennes mobiles de 5, 20 et 40 jours pour juger des combinaisons de tendances de différentes périodes. La période plurichrome est déterminée selon le principe de la cohérence des tendances des graphiques horaires grands et moyens.
Plus précisément, 5 jours sur la ligne rapide à travers 20 jours sur la ligne moyenne est considéré comme un signal court sur la ligne, et 20 jours sur la ligne moyenne à travers 40 jours sur la ligne lente est considéré comme un signal sur la ligne moyenne. Lorsque 3 lignes rapides et moyennes sont alignées correctement ([…] 5 jours> 20 jours> 40 jours), le jugement est un cycle à plusieurs têtes; lorsque 3 lignes rapides et moyennes sont alignées à l’envers ([…] 5 jours < 20 jours < 40 jours), le jugement est vide.
Ainsi, en fonction de la direction de la tendance à grande période, puis combiné avec la force de la petite période pour détecter l’entrée spécifique.
En outre, la stratégie utilise l’ATR Stop Loss pour contrôler les risques individuels et améliorer encore le taux de profit.
Analyse des avantages
La flexibilité de configuration permet aux utilisateurs de personnaliser les paramètres de la moyenne mobile en fonction de leur variété et de leurs préférences de trading
La mise en œuvre est simple et facile pour les débutants.
Utilisation efficace des fonds, avec un effet de levier maximal
Les risques sont maîtrisés et les mécanismes de prévention des pertes sont efficaces.
Une forte capacité à suivre la tendance et à maintenir les bénéfices après la détermination de la direction du grand cycle
Taux de victoire plus élevé, qualité des signaux de transaction, moins d’erreurs de changement de voie
Risques et améliorations
Les jugements à grande périodicité reposent sur des alignements de moyennes déplacées, avec un risque d’erreur de jugement en retard.
La détection d’intensité à petit cycle avec un seul fil K, peut être déclenchée à l’avance, peut être correctement relaxée
Stop-loss à amplitude fixe, optimisé pour un stop-loss dynamique
On peut envisager d’ajouter des conditions de filtrage supplémentaires, telles que le volume de transaction et l’énergie.
Vous pouvez essayer différentes combinaisons de paramètres de la moyenne mobile et optimiser les stratégies
Résumer
Cette stratégie intègre l’analyse de plusieurs périodes et la gestion des pertes, permettant des transactions de suivi de tendance à faible risque. En ajustant les paramètres, elle peut s’appliquer à différentes variétés pour répondre aux besoins des suiveurs de tendance.
Overview
This strategy uses a combination of moving averages across timeframes to identify trend rotations on the hourly, daily and weekly charts. It allows low-risk trend following trading. The strategy is flexible, simple to implement, capital efficient and suitable for medium-long term trend traders.
Trading Logic
The strategy employs 5, 20 and 40-day moving averages to determine the alignment of trends across different timeframes. Based on the consistency between larger and smaller timeframes, it identifies bullish and bearish cycles.
Specifically, the crossing of 5-day fast MA above 20-day medium MA indicates an uptrend in the short term. The crossing of 20-day medium MA above 40-day slow MA signals an uptrend in the medium term. When the fast, medium and slow MAs are positively aligned (5-day > 20-day > 40-day), it is a bull cycle. When they are negatively aligned (5-day < 20-day < 40-day), it is a bear cycle.
By determining direction from the larger cycles and confirming strength on the smaller cycles, this strategy opens positions only when major trend and minor momentum align. This effectively avoids false breakouts and achieves high win rate.
The strategy also utilizes ATR trailing stops to control single trade risks and further improve profitability.
Advantages
Flexible configurations to suit different instruments and trading styles
Simple to implement even for beginner traders
High capital efficiency to maximize leverage
Effective risk control to avoid significant losses
Strong trend following ability for sustained profits
High win rate due to robust signals and fewer whipsaws
Risks and Improvements
MA crossovers may lag and cause late trend detection
Single candle strength detection could trigger premature entry, relax condition
Fixed ATR stop loss, optimize to dynamic stops
Consider adding supplementary filters like volume
Explore different MA parameters for optimization
Conclusion
This strategy integrates multiple timeframe analysis and risk management for low-risk trend following trading. By adjusting parameters, it can be adapted to different instruments to suit trend traders. Compared to single timeframe systems, it makes more robust trading decisions and generates higher efficiency signals. In conclusion, this strategy has good market adaptiveness and development potential.
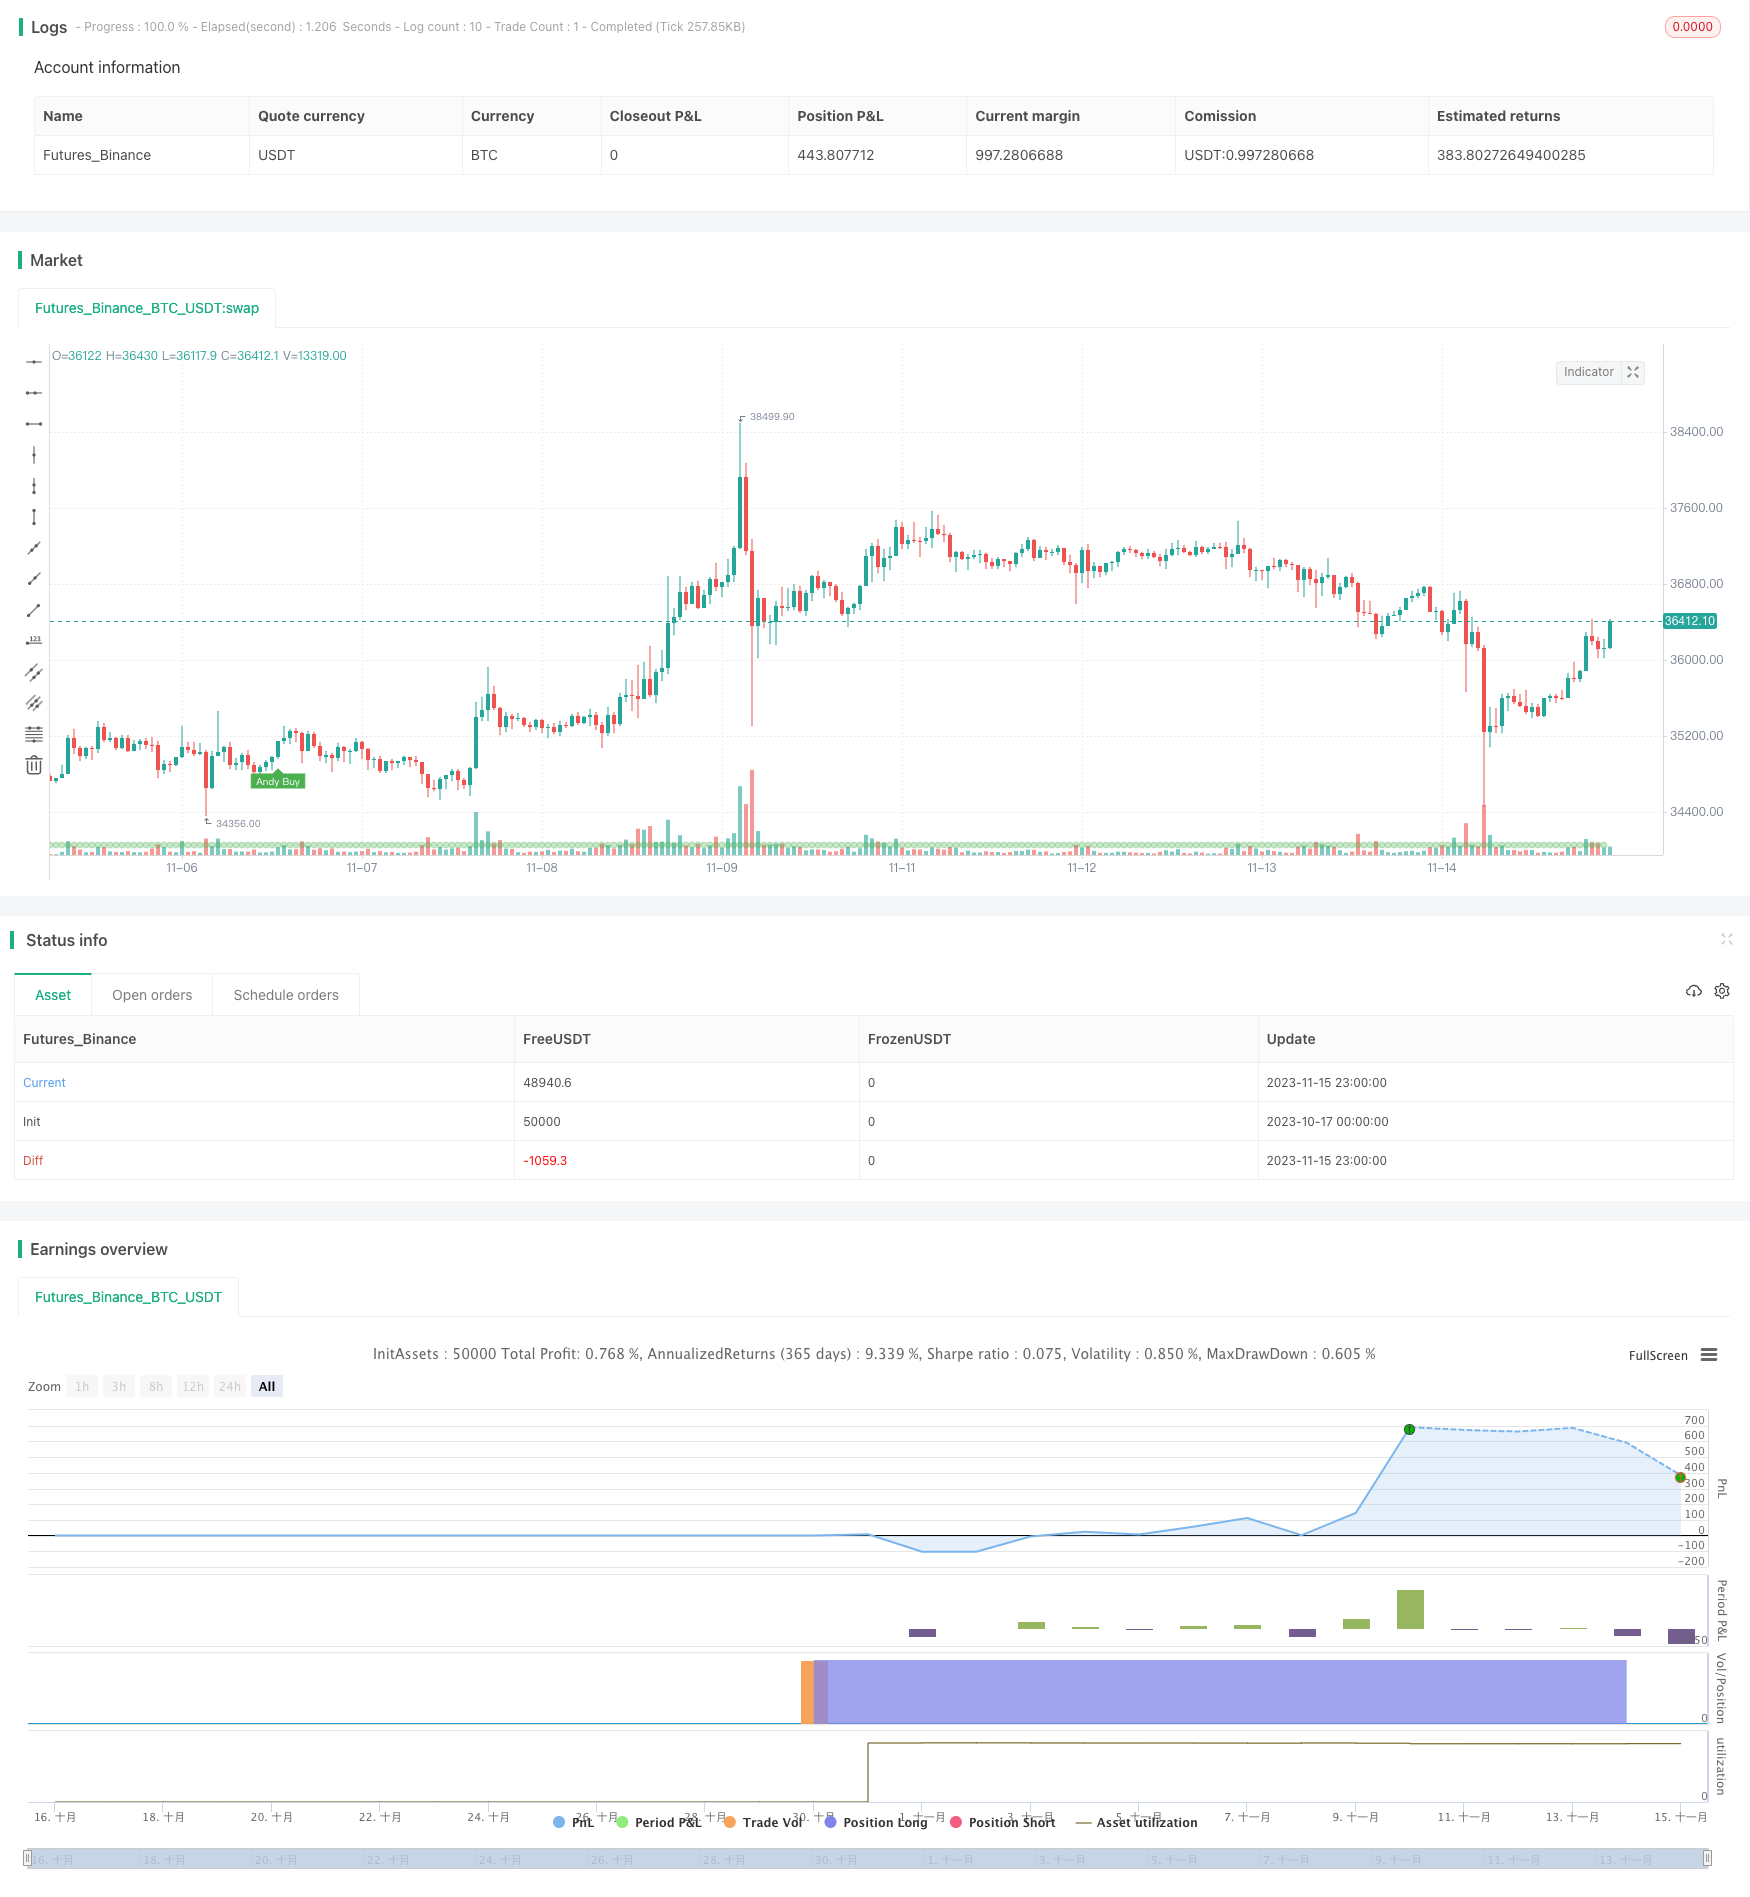
/*backtest
start: 2023-10-17 00:00:00
end: 2023-11-16 00:00:00
period: 1h
basePeriod: 15m
exchanges: [{"eid":"Futures_Binance","currency":"BTC_USDT"}]
*/

// This source code is subject to the terms of the Mozilla Public License 2.0 at https://mozilla.org/MPL/2.0/
// © kgynofomo

//@version=5
strategy(title="[Salavi] | Andy Advance Pro Strategy [BTC|M15]",overlay = true, pyramiding = 1,initial_capital = 10000, default_qty_type = strategy.cash,default_qty_value = 10000)

ema_short = ta.ema(close,5)
ema_middle = ta.ema(close,20)
ema_long = ta.ema(close,40)

cycle_1 = ema_short>ema_middle and ema_middle>ema_long
cycle_2 = ema_middle>ema_short and ema_short>ema_long
cycle_3 = ema_middle>ema_long and ema_long>ema_short
cycle_4 = ema_long>ema_middle and ema_middle>ema_short
cycle_5 = ema_long>ema_short and ema_short>ema_middle
cycle_6 = ema_short>ema_long and ema_long>ema_middle

bull_cycle = cycle_1 or cycle_2 or cycle_3
bear_cycle = cycle_4 or cycle_5 or cycle_6
// label.new("cycle_1")
// bgcolor(color=cycle_1?color.rgb(82, 255, 148, 60):na)
// bgcolor(color=cycle_2?color.rgb(82, 255, 148, 70):na)
// bgcolor(color=cycle_3?color.rgb(82, 255, 148, 80):na)
// bgcolor(color=cycle_4?color.rgb(255, 82, 82, 80):na)
// bgcolor(color=cycle_5?color.rgb(255, 82, 82, 70):na)
// bgcolor(color=cycle_6?color.rgb(255, 82, 82, 60):na)

// Inputs
a = input(2, title='Key Vaule. \'This changes the sensitivity\'')
c = input(7, title='ATR Period')
h = false

xATR = ta.atr(c)
nLoss = a * xATR

src = h ? request.security(ticker.heikinashi(syminfo.tickerid), timeframe.period, close, lookahead=barmerge.lookahead_off) : close

xATRTrailingStop = 0.0
iff_1 = src > nz(xATRTrailingStop[1], 0) ? src - nLoss : src + nLoss
iff_2 = src < nz(xATRTrailingStop[1], 0) and src[1] < nz(xATRTrailingStop[1], 0) ? math.min(nz(xATRTrailingStop[1]), src + nLoss) : iff_1
xATRTrailingStop := src > nz(xATRTrailingStop[1], 0) and src[1] > nz(xATRTrailingStop[1], 0) ? math.max(nz(xATRTrailingStop[1]), src - nLoss) : iff_2

pos = 0
iff_3 = src[1] > nz(xATRTrailingStop[1], 0) and src < nz(xATRTrailingStop[1], 0) ? -1 : nz(pos[1], 0)
pos := src[1] < nz(xATRTrailingStop[1], 0) and src > nz(xATRTrailingStop[1], 0) ? 1 : iff_3

xcolor = pos == -1 ? color.red : pos == 1 ? color.green : color.blue

ema = ta.ema(src, 1)
above = ta.crossover(ema, xATRTrailingStop)
below = ta.crossover(xATRTrailingStop, ema)

buy = src > xATRTrailingStop and above
sell = src < xATRTrailingStop and below

barbuy = src > xATRTrailingStop
barsell = src < xATRTrailingStop


atr = ta.atr(14)
atr_length = input.int(25)
atr_rsi = ta.rsi(atr,atr_length)
atr_valid = atr_rsi>50

long_condition =  buy and bull_cycle and atr_valid
short_condition =  sell and bear_cycle and atr_valid

Exit_long_condition = short_condition
Exit_short_condition = long_condition

if long_condition
    strategy.entry("Andy Buy",strategy.long, limit=close,comment="Andy Buy Here")

if Exit_long_condition
    strategy.close("Andy Buy",comment="Andy Buy Out")
    // strategy.entry("Andy fandan Short",strategy.short, limit=close,comment="Andy 翻單 short Here")
    // strategy.close("Andy fandan Buy",comment="Andy short Out")


if short_condition
    strategy.entry("Andy Short",strategy.short, limit=close,comment="Andy short Here")


// strategy.exit("STR","Long",stop=longstoploss)
if Exit_short_condition
    strategy.close("Andy Short",comment="Andy short Out")
    // strategy.entry("Andy fandan Buy",strategy.long, limit=close,comment="Andy 翻單 Buy Here")
    // strategy.close("Andy fandan Short",comment="Andy Buy Out")


inLongTrade = strategy.position_size > 0
inLongTradecolor = #58D68D
notInTrade = strategy.position_size == 0
inShortTrade = strategy.position_size < 0

// bgcolor(color = inLongTrade?color.rgb(76, 175, 79, 70):inShortTrade?color.rgb(255, 82, 82, 70):na)
plotshape(close!=0,location = location.bottom,color = inLongTrade?color.rgb(76, 175, 79, 70):inShortTrade?color.rgb(255, 82, 82, 70):na)


plotshape(long_condition, title='Buy', text='Andy Buy', style=shape.labelup, location=location.belowbar, color=color.new(color.green, 0), textcolor=color.new(color.white, 0), size=size.tiny)
plotshape(short_condition, title='Sell', text='Andy Sell', style=shape.labeldown, location=location.abovebar, color=color.new(color.red, 0), textcolor=color.new(color.white, 0), size=size.tiny)


//atr > close *0.01* parameter

// MONTHLY TABLE PERFORMANCE - Developed by @QuantNomad
// *************************************************************************************************************************************************************************************************************************************************************************
show_performance = input.bool(true, 'Show Monthly Performance ?', group='Performance - credits: @QuantNomad')
prec = input(2, 'Return Precision', group='Performance - credits: @QuantNomad')

if show_performance
    new_month = month(time) != month(time[1])
    new_year  = year(time)  != year(time[1])

    eq = strategy.equity

    bar_pnl = eq / eq[1] - 1

    cur_month_pnl = 0.0
    cur_year_pnl  = 0.0

    // Current Monthly P&L
    cur_month_pnl := new_month ? 0.0 :
                     (1 + cur_month_pnl[1]) * (1 + bar_pnl) - 1

    // Current Yearly P&L
    cur_year_pnl := new_year ? 0.0 :
                     (1 + cur_year_pnl[1]) * (1 + bar_pnl) - 1

    // Arrays to store Yearly and Monthly P&Ls
    var month_pnl  = array.new_float(0)
    var month_time = array.new_int(0)

    var year_pnl  = array.new_float(0)
    var year_time = array.new_int(0)

    last_computed = false

    if (not na(cur_month_pnl[1]) and (new_month or barstate.islastconfirmedhistory))
        if (last_computed[1])
            array.pop(month_pnl)
            array.pop(month_time)

        array.push(month_pnl , cur_month_pnl[1])
        array.push(month_time, time[1])

    if (not na(cur_year_pnl[1]) and (new_year or barstate.islastconfirmedhistory))
        if (last_computed[1])
            array.pop(year_pnl)
            array.pop(year_time)

        array.push(year_pnl , cur_year_pnl[1])
        array.push(year_time, time[1])

    last_computed := barstate.islastconfirmedhistory ? true : nz(last_computed[1])

    // Monthly P&L Table
    var monthly_table = table(na)

    if (barstate.islastconfirmedhistory)
        monthly_table := table.new(position.bottom_center, columns = 14, rows = array.size(year_pnl) + 1, border_width = 1)

        table.cell(monthly_table, 0,  0, "",     bgcolor = #cccccc)
        table.cell(monthly_table, 1,  0, "Jan",  bgcolor = #cccccc)
        table.cell(monthly_table, 2,  0, "Feb",  bgcolor = #cccccc)
        table.cell(monthly_table, 3,  0, "Mar",  bgcolor = #cccccc)
        table.cell(monthly_table, 4,  0, "Apr",  bgcolor = #cccccc)
        table.cell(monthly_table, 5,  0, "May",  bgcolor = #cccccc)
        table.cell(monthly_table, 6,  0, "Jun",  bgcolor = #cccccc)
        table.cell(monthly_table, 7,  0, "Jul",  bgcolor = #cccccc)
        table.cell(monthly_table, 8,  0, "Aug",  bgcolor = #cccccc)
        table.cell(monthly_table, 9,  0, "Sep",  bgcolor = #cccccc)
        table.cell(monthly_table, 10, 0, "Oct",  bgcolor = #cccccc)
        table.cell(monthly_table, 11, 0, "Nov",  bgcolor = #cccccc)
        table.cell(monthly_table, 12, 0, "Dec",  bgcolor = #cccccc)
        table.cell(monthly_table, 13, 0, "Year", bgcolor = #999999)


        for yi = 0 to array.size(year_pnl) - 1
            table.cell(monthly_table, 0,  yi + 1, str.tostring(year(array.get(year_time, yi))), bgcolor = #cccccc)

            y_color = array.get(year_pnl, yi) > 0 ? color.new(color.teal, transp = 40) : color.new(color.gray, transp = 40)
            table.cell(monthly_table, 13, yi + 1, str.tostring(math.round(array.get(year_pnl, yi) * 100, prec)), bgcolor = y_color, text_color=color.new(color.white, 0))

        for mi = 0 to array.size(month_time) - 1
            m_row   = year(array.get(month_time, mi))  - year(array.get(year_time, 0)) + 1
            m_col   = month(array.get(month_time, mi))
            m_color = array.get(month_pnl, mi) > 0 ? color.new(color.teal, transp = 40) : color.new(color.gray, transp = 40)

            table.cell(monthly_table, m_col, m_row, str.tostring(math.round(array.get(month_pnl, mi) * 100, prec)), bgcolor = m_color, text_color=color.new(color.white, 0))