Stratégie de trading hybride de tortues de rupture de moyenne mobile
Aperçu
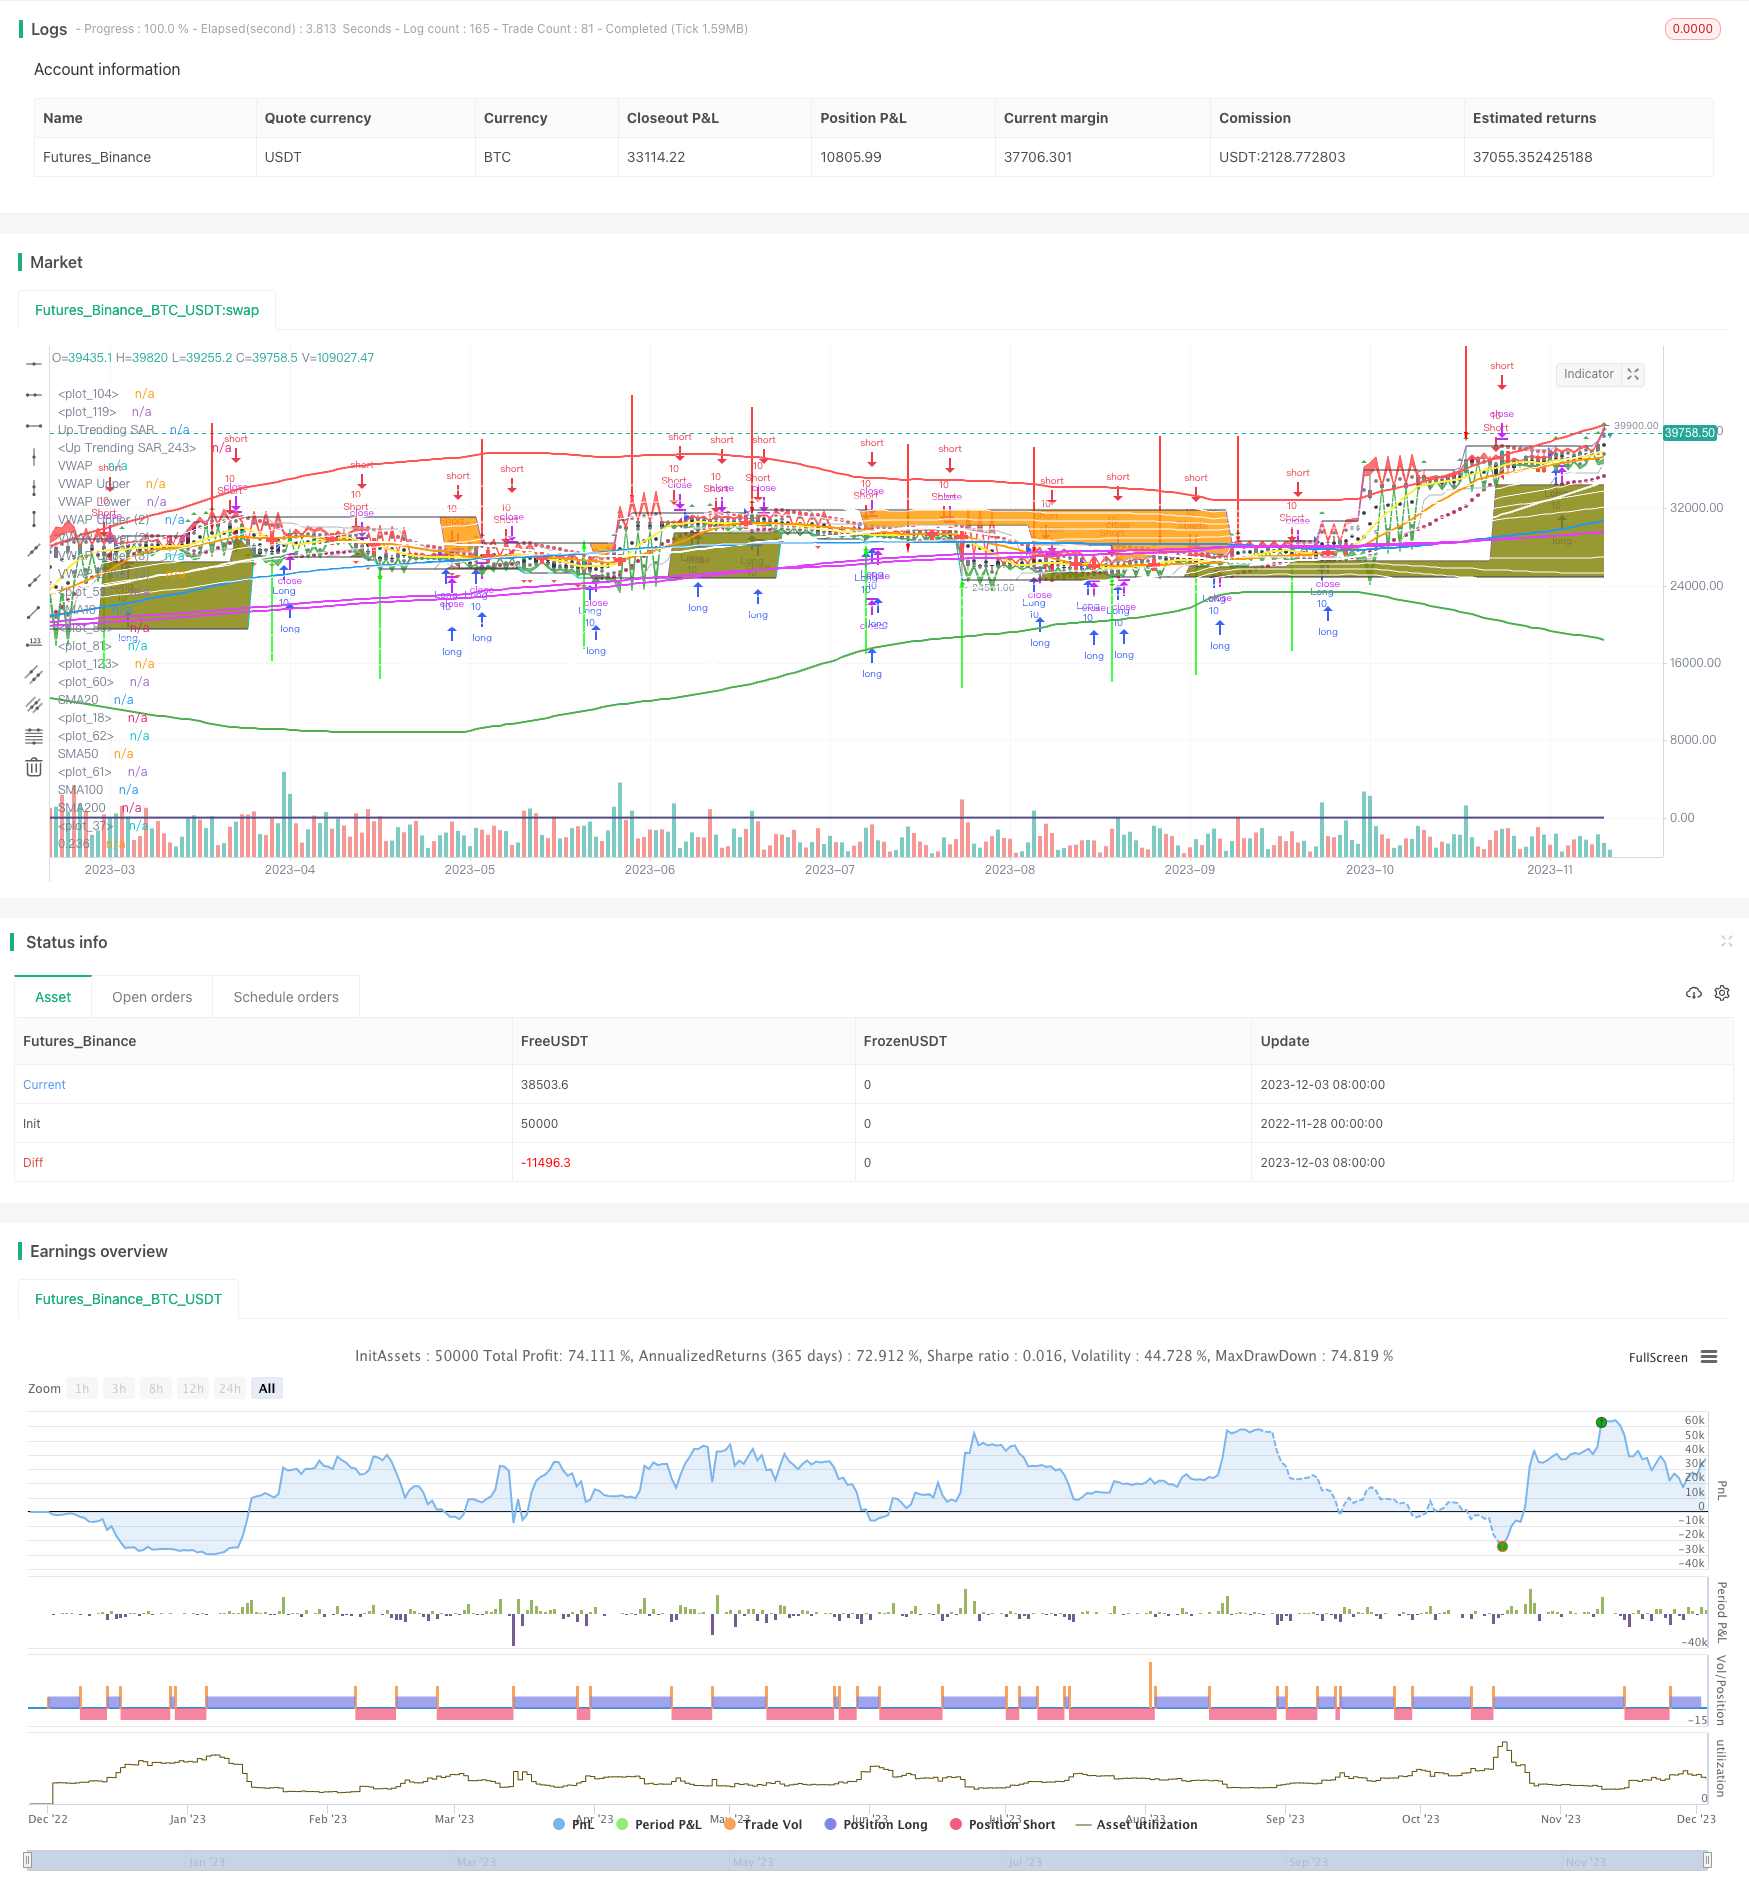
Cette stratégie utilise une combinaison d’outils d’analyse technique tels que les moyennes mobiles, les indicateurs de volatilité, les prix moyens pondérés en volume de transaction (VWAP) et les indicateurs de stop-loss parallèles pour réaliser une stratégie de trading Turtle hybride dotée d’une forte capacité de détection de rupture et de protection contre les pertes.
Principe de stratégie
- Utilisez une combinaison de SMA de différentes périodes pour déterminer la direction de la tendance et les points de rupture possibles
- Utilisation de l’indicateur de volatilité Brin pour juger de la survente à court terme
- Zone de prix équilibré de la ligne moyenne longue utilisant l’indicateur VWAP
- La SAR parabolique comme indicateur de stop loss et de réduction des pertes
- La loi de Turtle génère des signaux d’achat et de vente
Analyse des avantages
- Plus d’indicateurs, plus de jugement et plus de précision
- L’indicateur VWAP aide à déterminer la fourchette de prix raisonnable et à éviter la poursuite aveugle de prix plus élevés
- L’indicateur de stop-loss SAR contrôle efficacement la perte de chaque position
- La règle de Turtle assure le bon moment pour entrer en position
Analyse des risques
- Une mauvaise configuration des paramètres peut entraîner une fréquence de transaction trop élevée ou une erreur de signal
- La seule méthode de stop-loss limite l’espace de profit
- Les signaux de Turtle doivent être filtrés pour éviter les conflits
Direction d’optimisation
- Ajustez les paramètres de la période moyenne SMA pour optimiser la reconnaissance des ruptures
- Ajustement des paramètres de volatilité pour rapprocher la zone de Brin du prix
- Optimisation des paramètres de la parabole pour un arrêt plus précis
- Filtrage des signaux Turtle en combinaison avec d’autres indicateurs
Résumer
Cette stratégie est une combinaison organique de plusieurs indicateurs, formant un signal de négociation plus précis, une capacité d’arrêt plus forte et un espace d’ajustement des paramètres plus grand. La stratégie de type Turtle, une stratégie de rupture mixte. Une fois que les paramètres ont été correctement ajustés, sa capacité à identifier la rupture et à protéger la rupture sera améliorée.
/*backtest
start: 2022-11-28 00:00:00
end: 2023-12-04 00:00:00
period: 1d
basePeriod: 1h
exchanges: [{"eid":"Futures_Binance","currency":"BTC_USDT"}]
*/

//@version=4
strategy("Gui's Turtle", shorttitle = "Guis Turtles", overlay=true, pyramiding=0, default_qty_value = 10)

//This script has to be used with Heikin Ashi Caddles for the strategy to work well
//Thank you to all the ones that have their scripts public so we can make this everything one
//The colours and thicknesses have to be altered and messed with

sma1 = sma(close, 10)
sma2 = sma(close, 20)
plot(sma1, title="SMA10", color = yellow, linewidth = 2)
plot(sma2, title="SMA20", color = orange, linewidth = 2)
sma3 = sma(close, 50)
sma4 = sma(close, 100)
sma5 = sma(close, 200)
plot(sma3, title="SMA50", color = white, linewidth = 2)
plot(sma4, title="SMA100", color = blue, linewidth = 2)
plot(sma5, title="SMA200", color = fuchsia, linewidth = 2)
plot(cross(sma1, sma2) ? sma1 : na, style = cross, color = red, linewidth = 4)

length = input(200, minval=1)
src = input(hlc3, title="Source")
mult = input(3.0, minval=0.001, maxval=50)
basis = vwma(src, length)
dev = mult * stdev(src, length)
upper_1= basis + (0.236*dev)
upper_2= basis + (0.382*dev)
upper_3= basis + (0.5*dev)
upper_4= basis + (0.618*dev)
upper_5= basis + (0.764*dev)
upper_6= basis + (1*dev)
lower_1= basis - (0.236*dev)
lower_2= basis - (0.382*dev)
lower_3= basis - (0.5*dev)
lower_4= basis - (0.618*dev)
lower_5= basis - (0.764*dev)
lower_6= basis - (1*dev)
plot(basis, color=fuchsia, linewidth=2)
p1 = plot(upper_1, color=white, linewidth=1, title="0.236")
p2 = plot(upper_2, color=white, linewidth=1, title="0.382")
p3 = plot(upper_3, color=white, linewidth=1, title="0.5")
p4 = plot(upper_4, color=white, linewidth=1, title="0.618")
p5 = plot(upper_5, color=white, linewidth=1, title="0.764")
p6 = plot(upper_6, color=red, linewidth=2, title="1")
p13 = plot(lower_1, color=white, linewidth=1, title="0.236")
p14 = plot(lower_2, color=white, linewidth=1, title="0.382")
p15 = plot(lower_3, color=white, linewidth=1, title="0.5")
p16 = plot(lower_4, color=white, linewidth=1, title="0.618")
p17 = plot(lower_5, color=white, linewidth=1, title="0.764")
p18 = plot(lower_6, color=green, linewidth=2, title="1")

window1 = input(title='lookback window 1:',  defval=8)
window2 = input(title='lookback window 2:',  defval=21)

top1 = valuewhen(high >= highest(high, window1), high, 0)
bot1 = valuewhen(low <= lowest(low, window1), low, 0)
top2 = valuewhen(high >= highest(high, window2), high, 0)
bot2 = valuewhen(low <= lowest(low, window2), low, 0)

t1 = plot(top1, color=top1 != top1[1] ? na : black)
b1 = plot(bot1, color=bot1 != bot1[1] ? na : black)
t2 = plot(top2, color=top2 != top2[1] ? na : black)
b2 = plot(bot2, color=bot2 != bot2[1] ? na : black)

fill(t1, t2, color=orange, transp=80)
fill(b1, b2, color=olive, transp=80)

//inputs
h_left = input(title="H left",  defval=10)
h_right = input(title="H right",  defval=10)
sample_period = input(title="Sample bars for % TZ",  defval=5000)
show_ptz = input(title="Show PTZ", type=bool, defval=true)
show_channel = input(title="Show channel", type=bool, defval=true)

h_left_low = lowest(h_left)
h_left_high = highest(h_left)
newlow = low <= h_left_low
newhigh = high >= h_left_high
plotshape(newlow and show_ptz, style=shape.triangledown, location=location.belowbar, color=red)
plotshape(newhigh and show_ptz, style=shape.triangleup, location=location.abovebar, color=green)
channel_high = plot(show_channel ? h_left_low : 0, color=silver)
channel_low = plot (show_channel ? h_left_high : 0, color=silver)

central_bar_low = low[h_right + 1]
central_bar_high = high[h_right + 1]
full_zone_low = lowest(h_left + h_right + 1)
full_zone_high = highest(h_left + h_right + 1)
central_bar_is_highest = central_bar_high >= full_zone_high
central_bar_is_lowest = central_bar_low <= full_zone_low
plotarrow(central_bar_is_highest ? -1 : 0, offset=-h_right-1)
plotarrow(central_bar_is_lowest ? 1 : 0, offset=-h_right-1)

x = central_bar_is_highest ? 1 : 0
high_bar_tz_count = cum(x)

y = central_bar_is_lowest ? 1 : 0
low_bar_tz_count = cum(y)

total_tz = high_bar_tz_count + low_bar_tz_count
percent_tz_high = (high_bar_tz_count / sample_period) * 100
//plot(percent_tz_high, color = lime, transp=100)
percent_tz_low = (low_bar_tz_count / sample_period) * 100
//plot(low_bar_tz_count, color=red, transp=100)
percent_total_tz = (percent_tz_high + percent_tz_low)
plot(percent_total_tz, color=black, transp=100)

//PTZ probability calc
i = newhigh ? 1 : 0
high_bar_ptz_count = cum(i)

j = newlow ? 1 : 0
low_bar_ptz_count = cum(j)

total_ptz = high_bar_ptz_count + low_bar_ptz_count
percent_ptz_high = (high_bar_ptz_count / sample_period) * 100
//plot(percent_ptz_high, color=green, transp=100)
percent_ptz_low = (low_bar_ptz_count / sample_period) * 100
//plot(percent_ptz_low, color=maroon, transp=100)
percent_total_ptz = (percent_ptz_high + percent_ptz_low)
plot(percent_total_ptz, color=navy,  transp=100)

//PTZ resolving probability calc
percent_ptz_resolved = (1 - (total_tz / total_ptz)) * 100
plot(percent_ptz_resolved, color=gray,  transp=100)


devUp1 = input(1.28, title="Stdev above (1)")
devDn1 = input(1.28, title="Stdev below (1)")

devUp2 = input(2.01, title="Stdev above (2)")
devDn2 = input(2.01, title="Stdev below (2)")

devUp3 = input(2.51, title="Stdev above (3)")
devDn3 = input(2.51, title="Stdev below (3)")

devUp4 = input(3.09, title="Stdev above (4)")
devDn4 = input(3.09, title="Stdev below (4)")

devUp5 = input(4.01, title="Stdev above (5)")
devDn5 = input(4.01, title="Stdev below (5)")
showBcol = input(true, title="Turn Barcolor ON/OFF?")
showDv2 = input(true, type=bool, title="Show second group of bands?")
showDv3 = input(true, type=bool, title="Show third group of bands?")
showDv4 = input(false, type=bool, title="Show fourth group of bands?")
showDv5 = input(false, type=bool, title="Show fifth group of bands?")

showPrevVWAP = input(false, type=bool, title="Show previous VWAP close")
ColorSrc=input(close)
price=ColorSrc
start = request.security(syminfo.tickerid, "W", time)

newSession = iff(change(start), 1, 0)

vwapsum = iff(newSession, hl2*volume, vwapsum[1]+hl2*volume)
volumesum = iff(newSession, volume, volumesum[1]+volume)
v2sum = iff(newSession, volume*hl2*hl2, v2sum[1]+volume*hl2*hl2)
myvwap = vwapsum/volumesum
dev9 = sqrt(max(v2sum/volumesum - myvwap*myvwap, 0))

A=plot(myvwap,style=circles, title="VWAP", color=black)
U1=plot(myvwap + devUp1 * dev9,style=circles, title="VWAP Upper", color=gray)
D1=plot(myvwap - devDn1 * dev9, style=circles, title="VWAP Lower", color=gray)

myvwapu1= myvwap + devUp1 * dev9
myvwapd1= myvwap - devDn1 * dev9

U2=plot(showDv2 ? myvwap + devUp2 * dev9 : na, color=red, title="VWAP Upper (2)")
D2=plot(showDv2 ? myvwap - devDn2 * dev9 : na, color=green, title="VWAP Lower (2)")

myvwapu2= myvwap + devUp2 * dev9
myvwapu3= myvwap + devUp3 * dev9
myvwapd2= myvwap - devDn2 * dev9
myvwapd3= myvwap - devDn3 * dev9

U3=plot(showDv3 ? myvwap + devUp3 * dev9 : na, title="VWAP Upper (3)", color=red)
D3=plot(showDv3 ? myvwap - devDn3 * dev9 : na, title="VWAP Lower (3)", color=green)

myvwapu4= myvwap + devDn4 * dev9
myvwapd4= myvwap - devDn4 * dev9

U4=plot(showDv4 ? myvwap + devUp4 * dev9 : na, title="VWAP Upper (4)", color=red)
D4=plot(showDv4 ? myvwap - devDn4 * dev9 : na, title="VWAP Lower (4)", color=green)

U5=plot(showDv5 ? myvwap + devUp5 * dev9 : na, title="VWAP Upper (5)", color=red)
D5=plot(showDv5 ? myvwap - devDn5 * dev9 : na, title="VWAP Lower (5)", color=green)

prevwap = iff(newSession, myvwap[1], prevwap[1])

plot(showPrevVWAP ? prevwap : na, style=circles, color=close > prevwap ? green : red)

ColorMiddleU = price > myvwap and price < myvwapu2 ? white:na
ColorMiddleD = price > myvwapd1 and price < myvwap ? black:na

ColorDv1d = price > myvwapd2 and price < myvwapd1 ? gray:na
ColorDv1u = price > myvwapu1 and price < myvwapu2 ? gray:na

ColorDv2d = price > myvwapd3 and price < myvwapd2 ? green:na
ColorDv2u = price > myvwapu2 and price < myvwapu3 ? maroon:na

ColorDv3d = price > myvwapd4 and price < myvwapd3 ? lime:na
ColorDv3u = price > myvwapu3 and price < myvwapu4 ? red:na

barcolor(showBcol?ColorMiddleD:na, title="BarColor vwap-1 Lower")
barcolor(showBcol?ColorMiddleU:na, title="BarColorColor vwap-1 upper")
barcolor(showBcol?ColorDv1d:na, title="BarColor 1-2 Lower")
barcolor(showBcol?ColorDv1u:na, title="BarColorColor 1-2 upper")
barcolor(showBcol?ColorDv2d:na, title="BarColor 2-3 Lower")
barcolor(showBcol?ColorDv2u:na, title="BarColorColor 2-3 upper")
barcolor(showBcol?ColorDv3d:na, title="BarColor 3-4 Lower")
barcolor(showBcol?ColorDv3u:na, title="BarColorColor 3-4 upper")

fill(U1, U2, color=red, transp=90, title="Over Bought Fill 1")
fill(D1, D2, color=green, transp=90, title="Over Sold Fill 1")
fill(U2, U3, color=red, transp=90, title="Over Bought Fill 2")
fill(D2, D3, color=green, transp=90, title="Over Sold Fill 2")
fill(U3, U4, color=red, transp=90, title="Over Bought Fill 3")
fill(D3, D4, color=green, transp=90, title="Over Sold Fill 3")
fill(U4, U5, color=red, transp=90, title="Over Bought Fill 4")
fill(D4, D5, color=green, transp=90, title="Over Sold Fill 4")
fill(A, U1, color=gray, transp=90, title="Middle Fill Up")
fill(A, D1, color=gray, transp=90, title="Middle Fill Down")

//Created By ChrisMoody on 7/25/2014
//Simply Enhances Default Parabolic SAR by creating Two Color Options, One for UpTrend, Other for DownTrend
//Ability To Turn On/Off The Up Trending Parabolic SAR, And The Down Trending Parabolic SARstudy(title="CM_Parabolic SAR", shorttitle="CM_P-SAR", overlay=true)
start1 = input(2, minval=0, maxval=10, title="Start1 - Default = 2 - Multiplied by .01")
increment = input(2, minval=0, maxval=10, title="Step Setting (Sensitivity) - Default = 2 - Multiplied by .01" )
maximum = input(2, minval=1, maxval=10, title="Maximum Step (Sensitivity) - Default = 2 - Multiplied by .10")
sus = input(true, "Show Up Trending Parabolic Sar")
sds = input(true, "Show Down Trending Parabolic Sar")
disc = input(false, title="Start1 and Step settings are *.01 so 2 = .02 etc, Maximum Step is *.10 so 2 = .2")

startCalc = start1 * .01
incrementCalc = increment * .01
maximumCalc = maximum * .10

sarUp = sar(startCalc, incrementCalc, maximumCalc)
sarDown = sar(startCalc, incrementCalc, maximumCalc)

colUp = close >= sarDown ? lime : na
colDown = close <= sarUp ? red : na

plot(sus and sarUp ? sarUp : na, title="Up Trending SAR", style=circles, linewidth=4,color=colUp)
plot(sds and sarDown ? sarDown : na, title="Up Trending SAR", style=circles, linewidth=4,color=colDown)

TurtleSpeed = input(6, minval=1)

FastSpeed = highest(TurtleSpeed)
SlowSpeed = lowest(TurtleSpeed)

enterLong = high > FastSpeed[1]
enterShort = low < SlowSpeed[1]

strategy.entry("Long", strategy.long, when = enterLong)
strategy.entry("Short", strategy.short, when = enterShort)