Stratégie de suivi de tendance basée sur des bandes de support et de résistance dynamiques

Aperçu
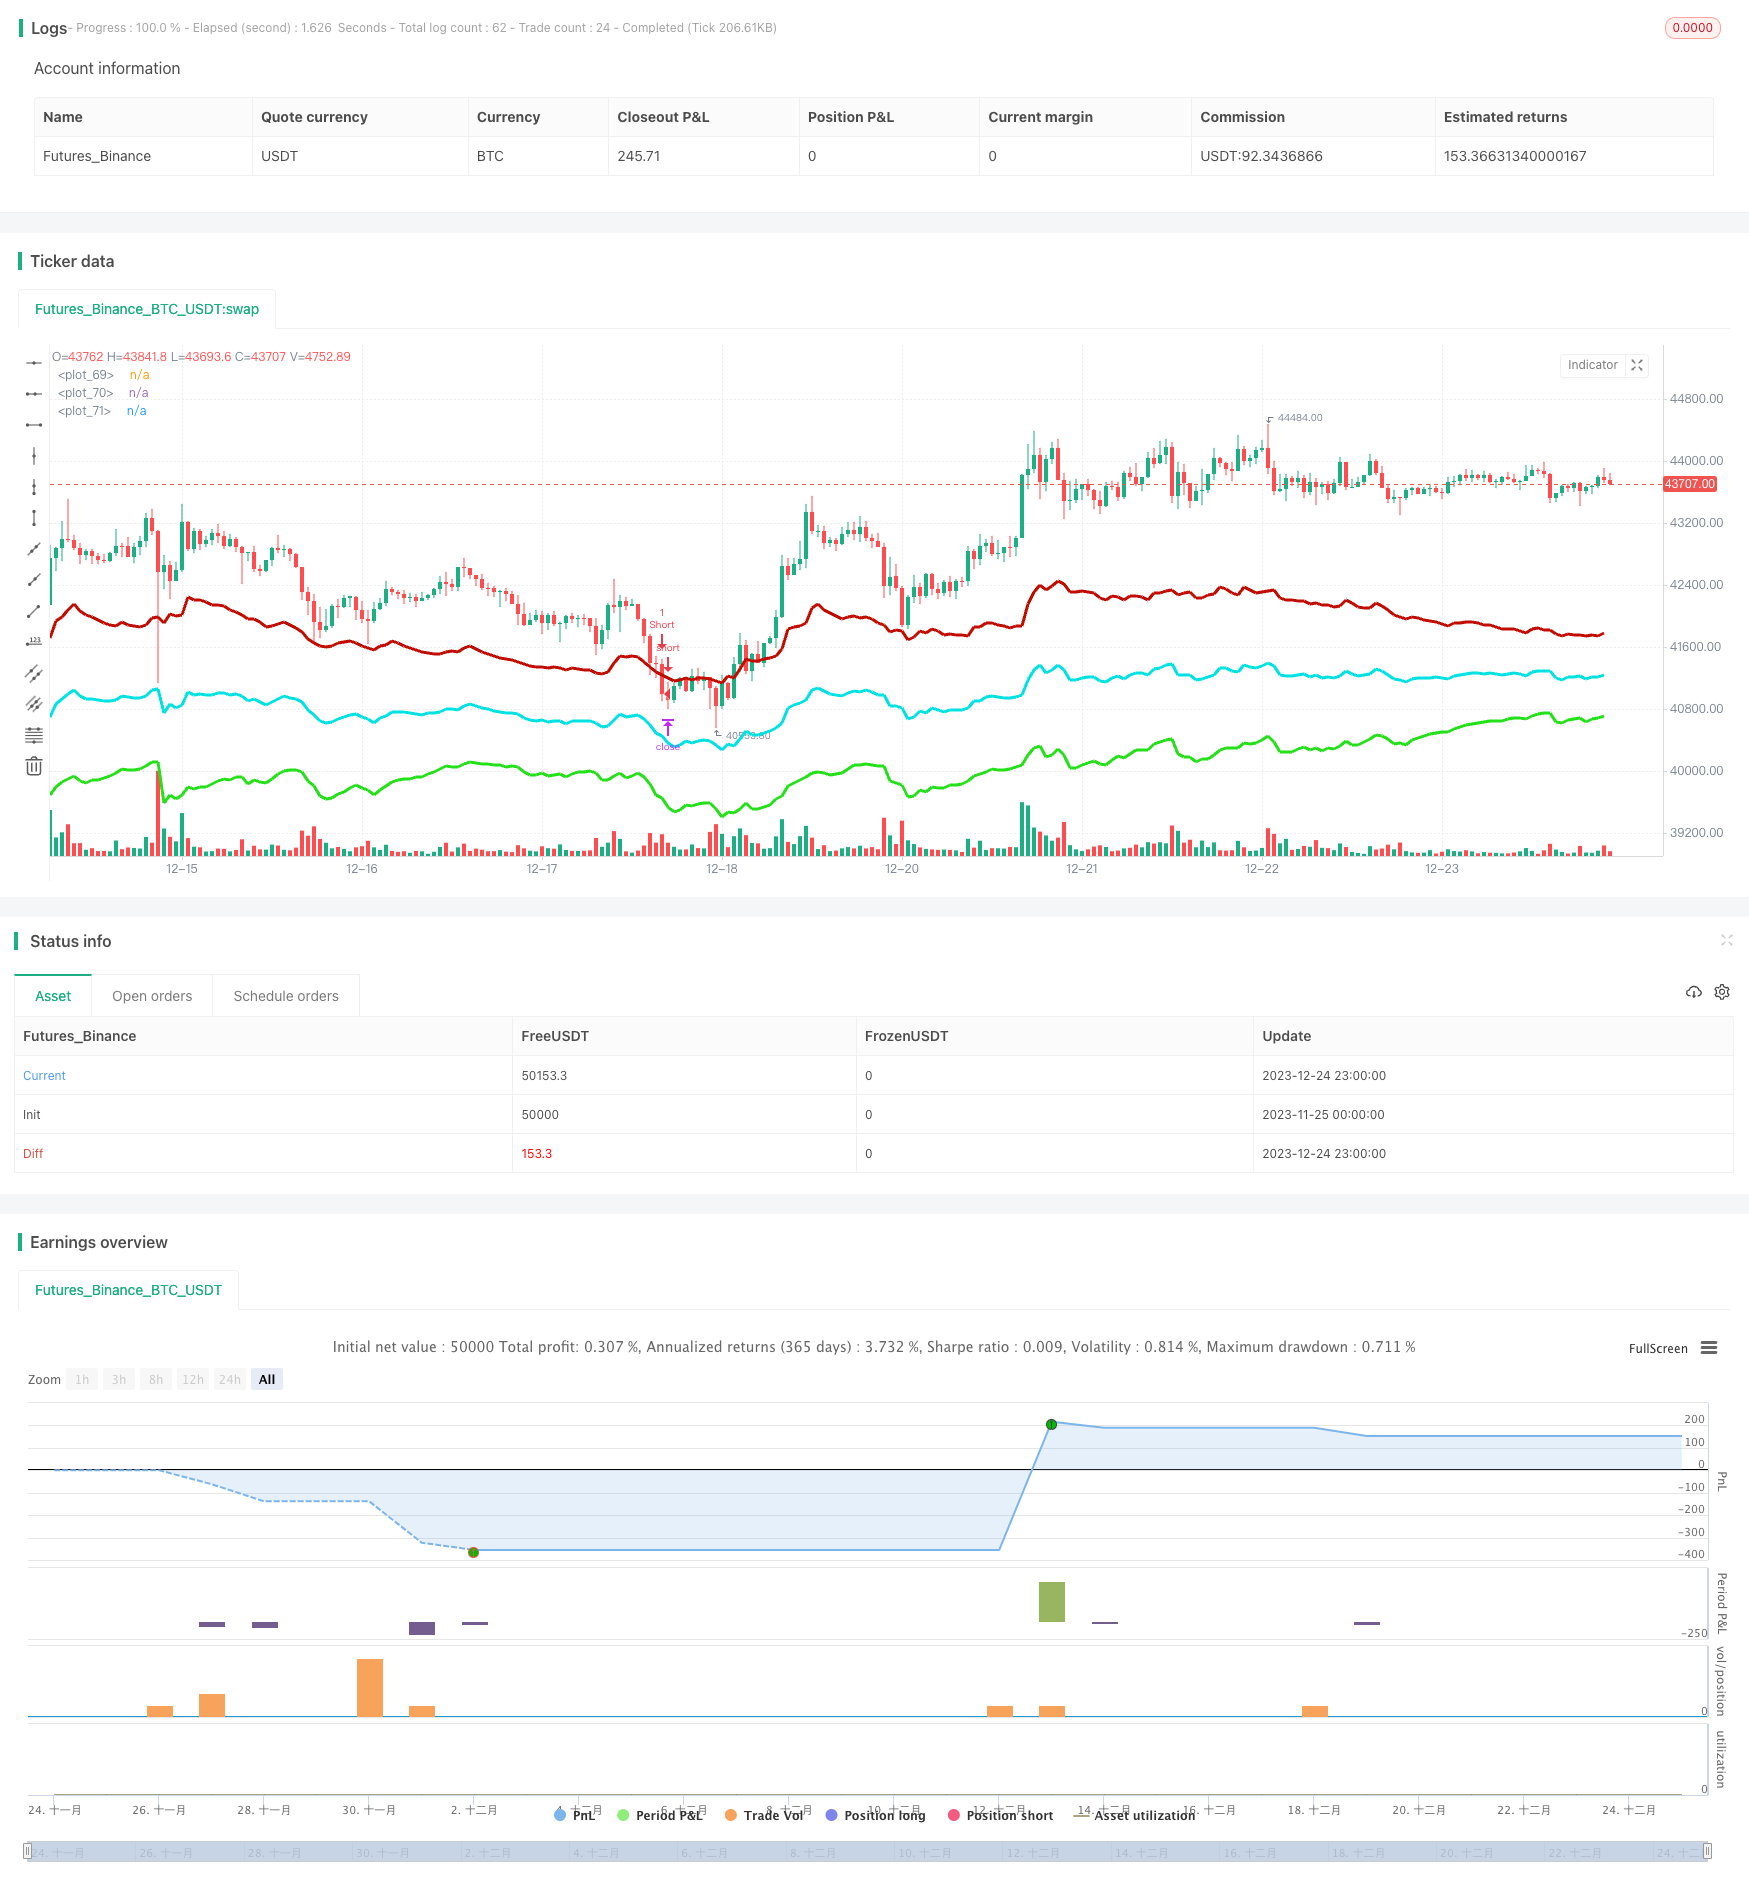
La stratégie crée un axe central dynamique en calculant les prix les plus élevés et les plus bas des dernières périodes de temps, combinés avec les prix actuels. Ensuite, en fonction des fluctuations les plus récentes, des canaux descendants rouges et des canaux ascendants verts sont générés. Ces trois canaux constituent une plage négociable.
Principe de stratégie
- Calculer le prix le plus élevé et le prix le plus bas de la dernière période N, combiné avec le prix de clôture actuel pour former un axe central dynamique
- Bandes de passages dynamiques générées en fonction de l’ATR et de la multiplicité, les variations de la bande passante avec les fluctuations du marché
- Faire plus lorsque le prix rebondit de la ligne du canal inférieur, faire moins lorsque le prix rebondit de la ligne du canal supérieur
- Avec une logique d’arrêt et d’arrêt de perte, l’objectif est de revenir à l’arrêt de l’axe central
- Calculer l’indice de tendance pour filtrer les transactions qui ne sont pas en cours
Analyse des avantages
- La dynamique de changement de position de la ligne de passage permet de capturer les fluctuations du marché en temps réel
- La probabilité d’une transaction en cours est plus élevée, ce qui permet de saisir la tendance.
- Logique de contrôle des pertes individuelles avec stop-loss
Analyse des risques
- Une mauvaise optimisation des paramètres peut conduire à des transactions excessives
- La tendance à la hausse ne peut pas éliminer complètement les transactions négatives
- Les lignes de pénétration unilatérales pourraient être maintenues
Direction d’optimisation
- Adaptation des paramètres de la ligne de passage pour les rendre plus adaptés aux caractéristiques des différentes variétés
- Ajustement des paramètres de l’indice de tendance pour améliorer la probabilité de reprise
- Ajout d’éléments d’apprentissage automatique pour optimiser la dynamique des paramètres
Résumer
La stratégie repose principalement sur les caractéristiques de choc du marché. La stratégie capture les points de retournement des prix via des canaux dynamiques et, combinée à un filtrage de tendance, permet d’utiliser efficacement les transactions de retournement pour profiter, tout en contrôlant les risques. La clé est la régulation des paramètres, qui nécessite que la ligne de canal puisse suivre les prix en temps réel et ne soit pas trop sensible.
/*backtest
start: 2023-11-25 00:00:00
end: 2023-12-25 00:00:00
period: 1h
basePeriod: 15m
exchanges: [{"eid":"Futures_Binance","currency":"BTC_USDT"}]
*/

//@version=4
strategy(title="Strategy - Bobo PAPATR", overlay=true, default_qty_type = strategy.fixed, default_qty_value = 1, initial_capital = 10000)

// === STRATEGY RELATED INPUTS AND LOGIC ===
len = input(24, minval=1, title="Pivot Length, defines lookback for highs and lows to make pivots")
length = input(title="ATR lookback (Lower = bands more responsive to recent price action)", type=input.integer, defval=22)
myatr = atr(length)
dailyatr = myatr[1]
atrmult = input(title="ATR multiplier (Lower = wider bands)", type=input.float, defval=3)
pivot0 = (high[1] + low[1]  + close[1]) / 3

// PIVOT CALC
h = highest(len)
h1 = dev(h, len) ? na : h
hpivot = fixnan(h1)
l = lowest(len)
l1 = dev(l, len) ? na : l
lpivot = fixnan(l1)
pivot = (lpivot + hpivot + pivot0) / 3
upperband1 = (dailyatr * atrmult) + pivot
lowerband1 = pivot - (dailyatr * atrmult)
middleband = pivot

// == TREND CALC ===
i1=input(2, "Momentum Period", minval=1) //Keep at 2 usually
i2=input(20, "Slow Period", minval=1)
i3=input(5, "Fast Period", minval=1)
i4=input(3, "Smoothing Period", minval=1)
i5=input(4, "Signal Period", minval=1)
i6=input(50, "Extreme Value", minval=1)
hiDif = high - high[1]
loDif = low[1] - low
uDM = hiDif > loDif and hiDif > 0 ? hiDif : 0
dDM =  loDif > hiDif and loDif > 0 ? loDif : 0
ATR = rma(tr(true), i1)
DIu = 100 * rma(uDM, i1) / ATR
DId = 100 * rma(dDM, i1) / ATR
HLM2 =  DIu - DId
DTI = (100 * ema(ema(ema(HLM2, i2), i3), i4)) /  ema(ema(ema(abs(HLM2), i2), i3), i4)
signal = ema(DTI, i5)


// === RISK MANAGEMENT INPUTS ===
inpTakeProfit   = input(defval = 0, title = "Take Profit (In Market MinTick Value)", minval = 0)
inpStopLoss     = input(defval = 100, title = "Stop Loss (In Market MinTick Value)", minval = 0)

// === RISK MANAGEMENT VALUE PREP ===
// if an input is less than 1, assuming not wanted so we assign 'na' value to disable it.
useTakeProfit   = inpTakeProfit  >= 1 ? inpTakeProfit  : na
useStopLoss     = inpStopLoss    >= 1 ? inpStopLoss    : na

// === STRATEGY - LONG POSITION EXECUTION ===
enterLong = (((low<=lowerband1) and (close >lowerband1)) or ((open <= lowerband1) and (close > lowerband1))) and (strategy.opentrades <1) and (atr(3) > atr(50)) and (signal>signal[3])
exitLong = (high > middleband)
strategy.entry(id = "Long", long = true, when = enterLong)
strategy.close(id = "Long", when = exitLong)

// === STRATEGY - SHORT POSITION EXECUTION ===
enterShort = (((high>=upperband1) and (close < upperband1)) or ((open >= upperband1) and (close < upperband1))) and (strategy.opentrades <1) and (atr(3) > atr(50)) and (signal<signal[3])
exitShort = (low < middleband)
strategy.entry(id = "Short", long = false, when = enterShort)
strategy.close(id = "Short", when = exitShort)

// === STRATEGY RISK MANAGEMENT EXECUTION ===
strategy.exit("Exit Long", from_entry = "Long", profit = useTakeProfit, loss = useStopLoss)
strategy.exit("Exit Short", from_entry = "Short", profit = useTakeProfit, loss = useStopLoss)

// === CHART OVERLAY ===
plot(upperband1, color=#C10C00, linewidth=3)
plot(lowerband1, color=#23E019, linewidth=3)
plot(middleband, color=#00E2E2, linewidth=3)
//plot(strategy.equity, title="equity", color=red, linewidth=2, style=areabr)