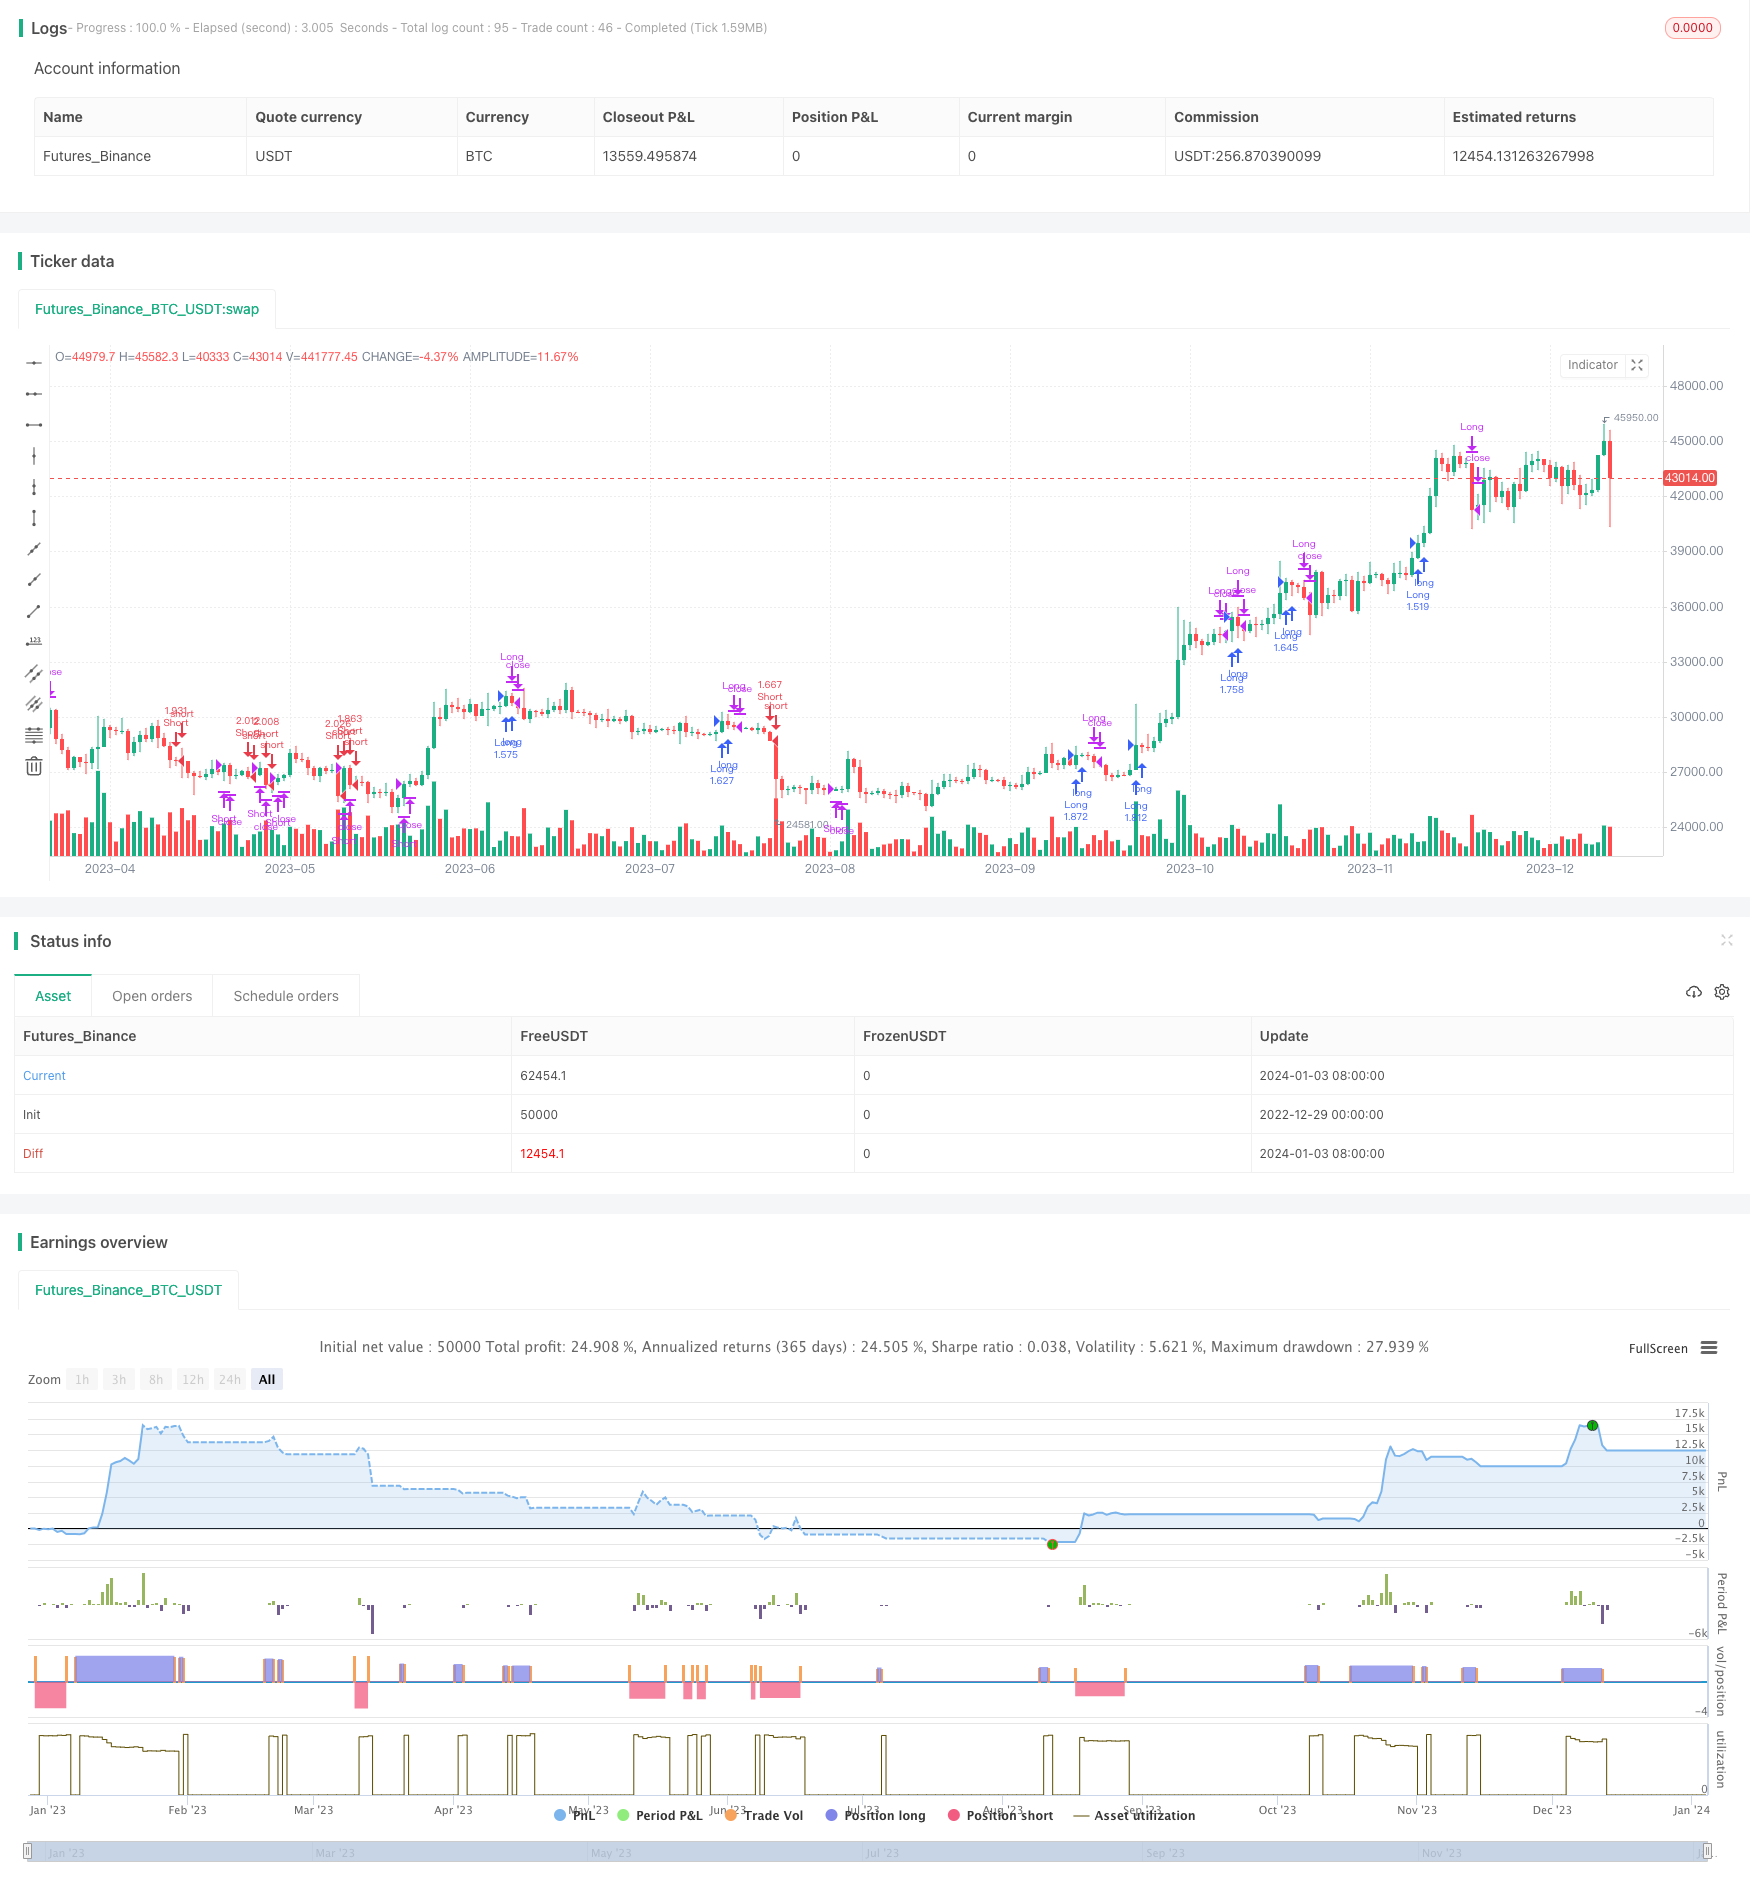
Stratégie de trading quantitatif Ichimoku Cloud

Aperçu
Cette stratégie utilise une courbe, une ligne K, une moyenne mobile de Hull, l’indicateur MACD, et d’autres indicateurs pour construire un mécanisme de décision à long terme et à long terme, permettant des transactions automatiques.
Principe de stratégie
Les lignes de conversion et les lignes de retard sont construites sur la bande de nuage d’Ichimoku pour construire un signal de négociation polyvalent. La direction de la tendance est déterminée par la combinaison de la moyenne mobile de Hull. Le MACD est utilisé pour déterminer le rythme long et court.
La ligne de conversion est la moyenne des prix moyens sur près de 9 jours. La ligne de retardation est la moyenne des prix moyens sur près de 26 jours. Lorsque vous traversez la ligne de retardation sur la ligne de conversion, faites plus. Lorsque vous traversez la ligne de retardation sous la ligne de conversion, faites moins.
Les moyennes mobiles de Hull sont jugées à la hausse quand elles traversent les moyennes doubles. Les moyennes rapides sont jugées à la baisse quand elles traversent les moyennes lentes.
Le MACD prend les moyennes mobiles des indices 12 et 26 et détermine la marge de manœuvre en utilisant l’axe zéro et la fourche dorée de la moyenne.
La ligne K à l’intérieur de la journée a été utilisée comme une opportunité d’entrée.
Avantages stratégiques
- Les résultats de l’étude ont été publiés dans le journal Le Monde.
- Le choix doit être précis et éviter les échanges inutiles.
- Le risque est maîtrisé et le système de freinage est arrêté.
Risque stratégique
- Une mauvaise configuration des paramètres peut entraîner une entrée excessive dans le champ.
- La combinaison de plusieurs indicateurs augmente la complexité de la stratégie.
- Les opérations de raccourcissement ne sont pas évitées.
Optimisation de la stratégie
- Adaptation de la combinaison de paramètres pour plus de variétés et de cycles.
- Ajout d’un module d’apprentissage automatique pour l’adaptation des paramètres.
- Optimiser les paramètres d’entrée et augmenter le taux de victoires.
Résumer
Cette stratégie combine plusieurs signaux d’indicateurs tels que les bandes de nuages d’Ichimoku pour construire un système complet de prise de décision quantitative. Un mécanisme d’arrêt-stop strict pour contrôler le risque de transaction.
/*backtest
start: 2022-12-29 00:00:00
end: 2024-01-04 00:00:00
period: 1d
basePeriod: 1h
exchanges: [{"eid":"Futures_Binance","currency":"BTC_USDT"}]
*/

//@version=2
// Any timeFrame ok but good on 15 minute & 60 minute , Ichimoku + Daily-Candle_cross(DT) + HULL-MA_cross + MacD combination 420 special blend
strategy("Ichimoku + Daily-Candle_X + HULL-MA_X + MacD", shorttitle="٩(̾●̮̮̃̾•̃̾)۶", overlay=true, default_qty_type=strategy.percent_of_equity, max_bars_back=720, default_qty_value=100, calc_on_order_fills= true, calc_on_every_tick=true, pyramiding=0)
keh=input(title="Double HullMA",defval=14, minval=1)
dt = input(defval=0.0010, title="Decision Threshold (0.001)", type=float, step=0.0001)
SL = input(defval=-500.00, title="Stop Loss in $", type=float, step=1)
TP = input(defval=25000.00, title="Target Point in $", type=float, step=1)
ot=1
n2ma=2*wma(close,round(keh/2))
nma=wma(close,keh)
diff=n2ma-nma
sqn=round(sqrt(keh))
n2ma1=2*wma(close[1],round(keh/2))
nma1=wma(close[1],keh)
diff1=n2ma1-nma1
sqn1=round(sqrt(keh))
n1=wma(diff,sqn)
n2=wma(diff1,sqn)
b=n1>n2?lime:red
c=n1>n2?green:red
d=n1>n2?red:green
confidence=(request.security(syminfo.tickerid, 'D', close)-request.security(syminfo.tickerid, 'D', close[1]))/request.security(syminfo.tickerid, 'D', close[1])
conversionPeriods = input(9, minval=1, title="Conversion Line Periods")
basePeriods = input(26, minval=1, title="Base Line Periods")
laggingSpan2Periods = input(52, minval=1, title="Lagging Span 2 Periods")
displacement = input(26, minval=1, title="Displacement")
donchian(len) => avg(lowest(len), highest(len))
conversionLine = donchian(conversionPeriods)
baseLine = donchian(basePeriods)
leadLine1 = avg(conversionLine, baseLine)
leadLine2 = donchian(laggingSpan2Periods)
LS=close, offset = -displacement
MACD_Length = input(9)
MACD_fastLength = input(12)
MACD_slowLength = input(26)
MACD = ema(close, MACD_fastLength) - ema(close, MACD_slowLength)
aMACD = ema(MACD, MACD_Length)
closelong = n1<n2 and close<n2 and confidence<dt or strategy.openprofit<SL or strategy.openprofit>TP
if (closelong)
    strategy.close("Long")
closeshort = n1>n2 and close>n2 and confidence>dt or strategy.openprofit<SL or strategy.openprofit>TP
if (closeshort)
    strategy.close("Short")
longCondition = n1>n2 and strategy.opentrades<ot and confidence>dt and close>n2 and leadLine1>leadLine2 and open<LS and MACD>aMACD
if (longCondition)
    strategy.entry("Long",strategy.long)
shortCondition = n1<n2 and strategy.opentrades<ot and confidence<dt and close<n2 and leadLine1<leadLine2 and open>LS and MACD<aMACD
if (shortCondition)
    strategy.entry("Short",strategy.short)//                         /L'-,
//                               ,'-.           /MM . .             /  L '-,
//     .                    _,--dMMMM\         /MMM  `..           /       '-,
//     :             _,--,  )MMMMMMMMM),.      `QMM   ,<>         /_      '-,'
//     ;     ___,--. \MM(    `-'   )M//MM\       `  ,',.;      .-'* ;     .'
//     |     \MMMMMM) \MM\       ,dM//MMM/     ___ < ,; `.      )`--'    /
//     |      \MM()M   MMM)__   /MM(/MP'  ___, \  \ `  `. `.   /__,    ,'
//     |       MMMM/   MMMMMM( /MMMMP'__, \     | /      `. `-,_\     /
//     |       MM     /MMM---' `--'_ \     |-'  |/         `./ .\----.___
//     |      /MM'   `--' __,-  \""   |-'  |_,               `.__) . .F. )-.
//     |     `--'       \   \    |-'  |_,     _,-/            J . . . J-'-. `-.,
//     |         __  \`. |   |   |         \    / _           |. . . . \   `-.  F
//     |   ___  /  \  | `|   '      __  \   |  /-'            F . . . . \     '`
//     |   \  \ \  /  |        __  /  \  |  |,-'        __,- J . . . . . \
//     |    | /  |/     __,-  \  ) \  /  |_,-     __,--'     |. .__.----,'
//     |    |/    ___     \    |'.  |/      __,--'           `.-;;;;;;;;;\
//     |     ___  \  \     |   |  `   __,--'                  /;;;;;;;;;;;;.
//     |     \  \  |-'\    '    __,--'                       /;;;;;;;;;;;;;;\
// \   |      | /  |      __,--'                             `--;;/     \;-'\
//  \  |      |/    __,--'                                   /  /         \  \
//   \ |      __,--'                                        /  /           \  \
//    \|__,--'                                          _,-;M-K,           ,;-;\
//                                                     <;;;;;;;;           '-;;;;
//a1=plot(n1,color=c)
//a2=plot(n2,color=c)
//plot(cross(n1, n2) ? n1 : na, style = circles, color=b, linewidth = 4)
//plot(cross(n1, n2) ? n1 : na, style = line, color=d, linewidth = 4)
//plot(conversionLine, color=#0496ff, title="Conversion Line")
//plot(baseLine, color=#991515, title="Base Line")
//plot(close, offset = -displacement, color=#459915, title="Lagging Span")
//p1=plot (leadLine1, offset = displacement, color=green,  title="Lead 1")
//p2=plot (leadLine2, offset = displacement, color=red,  title="Lead 2")
//fill(p1, p2, color = leadLine1 > leadLine2 ? green : red)
// remove the "//" from before the plot script if want to see the indicators on chart