Stratégie solide de suivi des tendances
Aperçu
L’idée principale de cette stratégie est de combiner 123 formes inversées et l’indicateur de flux de trésorerie intelligent (SMI) pour réaliser une transaction de suivi de tendance stable. La stratégie crée une position de tête multiple ou vide correspondante lorsque deux signaux émettent simultanément un signal d’achat ou de vente.
Principe de stratégie
La stratégie est composée de deux volets:
Stratégie inverse: la stratégie est basée sur le prix de clôture d’une action et l’indicateur de Stoch du 9ème jour pour réaliser une transaction inverse. Plus précisément, lorsque la relation de prix de clôture de deux jours consécutifs est inverse (c’est-à-dire que le prix de clôture du jour précédent est supérieur à celui des deux jours précédents et le prix de clôture du jour suivant est inférieur à celui du jour précédent), et que la ligne rapide de Stoch est supérieure à la ligne lente, faites un vide.
Stratégie SMI: Cette stratégie est basée sur l’indice de flux de trésorerie intelligent pour réaliser le suivi des tendances. L’indice SMI peut refléter le jeu des fonds institutionnels et des fonds de détail.
La stratégie prend une position de tête multiple lorsque la forme inverse 123 et l’indice SMI émettent simultanément un signal d’achat; la stratégie prend une position de tête vide lorsque les deux émettent simultanément un signal de vente.
Avantages stratégiques
Cette stratégie, combinée à des modèles de retournement et à des indicateurs de suivi de la tendance, permet d’identifier efficacement les retournements de marché et de suivre la tendance pour réaliser des bénéfices stables. Les avantages spécifiques sont les suivants:
Les formes de retournement 123 ont un taux de gain et de profit élevé et permettent d’identifier efficacement les opportunités de retournement à court terme.
L’indicateur SMI peut refléter les flux de fonds des institutions et suivre les fonds des institutions pour obtenir des bénéfices plus stables.
L’utilisation d’indicateurs de suivi de tendance et de rétrogradation peut améliorer la qualité des signaux, réduire les transactions inutiles et contrôler efficacement les risques.
Risque stratégique
Cette stratégie comporte également des risques, principalement liés aux aspects suivants:
123 Il existe un certain risque de faux signaux dans la forme inversée, et les transactions à perte ne peuvent pas être complètement évitées. Les paramètres peuvent être optimisés de manière appropriée pour améliorer la qualité du signal.
L’indicateur SMI présente un certain retard et ne peut pas refléter entièrement les flux de fonds en temps réel. Il peut être vérifié en combinaison avec d’autres indicateurs pour améliorer l’exactitude.
Les doubles signaux posent le problème d’être trop conservateurs et de rater une tendance unilatérale plus forte. Les conditions de signal peuvent être assouplies de manière appropriée et les critères de filtrage peuvent être réduits.
Direction d’optimisation
Cette stratégie peut être optimisée dans les domaines suivants:
Optimiser les paramètres, trouver les combinaisons optimales de paramètres et améliorer la rentabilité de la stratégie.
L’augmentation des mécanismes de prévention des pertes permet de contrôler efficacement les pertes individuelles.
En combinaison avec d’autres indicateurs ou formes, pour vérifier davantage la qualité du signal et améliorer la précision du signal.
Optimiser les paramètres pour les différentes variétés et améliorer l’adaptabilité des stratégies.
Résumer
L’idée générale de la stratégie est claire et efficace, combinée à des indicateurs de suivi des tendances et des modèles de retournement, permettant d’identifier de manière stable les opportunités de retournement à court terme et de suivre les tendances à moyen et long terme. Par l’optimisation des paramètres et l’amélioration de la conception des mécanismes, la rentabilité et la capacité de contrôle des risques de la stratégie peuvent être encore améliorées.
Overview
The main idea of this strategy is to combine the 123 reversal pattern and the Smart Money Index (SMI) indicator to achieve stable trend tracking trading. The strategy will only establish corresponding long or short positions when both signals issue buy or sell signals at the same time.
Strategy Principle
The strategy consists of two parts:
123 reversal strategy: This strategy implements reversal trading based on the closing price of the stock and the 9-day Stoch indicator. Specifically, go short when the closing price relationship reverses for two consecutive days (i.e. the previous closing price is higher than the one before the previous day, and the next closing price is lower than the previous day), and Stoch fast line is above slow line; go long when the closing price relationship reverses for two consecutive days (i.e. the previous closing price is lower than the one before the previous day, and the next closing price is higher than the previous day), and Stoch fast line is below slow line.
SMI strategy: This strategy implements trend tracking based on the Smart Money Index. The SMI indicator can reflect the game between institutional funds and retail funds. The rise of SMI indicates that institutional funds are absorbing funds, while the fall indicates that institutional funds are selling out. Go long when SMI rises and go short when SMI falls.
The strategy will only take a long position when both the 123 reversal pattern and the SMI indicator issue a buy signal at the same time. It will only take a short position when both issue a sell signal at the same time.
Strategy Advantages
The strategy combines reversal patterns and trend tracking indicators to effectively identify market reversal points and track trends for steady profits. The specific advantages are as follows:
The 123 reversal pattern has a relatively high win rate and profit rate, which can effectively identify short-term reversal opportunities.
The SMI indicator can reflect the direction of institutional funds. Tracking institutional funds can obtain more steady profits.
The combined use of reversal patterns and trend tracking indicators can improve the quality of signals, reduce unnecessary trading, and effectively control risks.
Strategy Risks
The strategy also has some risks, mainly concentrated in the following areas:
The 123 reversal pattern has a certain risk of false signals and cannot completely avoid losing trades. Parameters can be optimized appropriately to improve signal quality.
The SMI indicator has a certain lag and cannot completely reflect the direction of funds in real time. Other indicators can be combined for verification to improve accuracy.
Double signals can lead to over-conservative problems, possibly missing stronger one-sided trending opportunities. Signal conditions can be appropriately relaxed to reduce filtering criteria.
Optimization Directions
The strategy can also be further optimized in the following aspects:
Optimize parameters to find the optimal parameter combination and improve the profitability of the strategy.
Add stop loss mechanisms to effectively control single loss.
Combine other indicators or patterns to further verify signal quality and improve signal accuracy.
Optimize parameters separately for different varieties to improve the adaptability of the strategy.
Summary
The overall idea of the strategy is clear, effectively combining reversal patterns and trend tracking indicators to steadily identify short-term reversal opportunities and track medium-to-long term trends. By improving parameters optimization and mechanism design, the profitability and risk control capabilities of the strategy can be further enhanced.
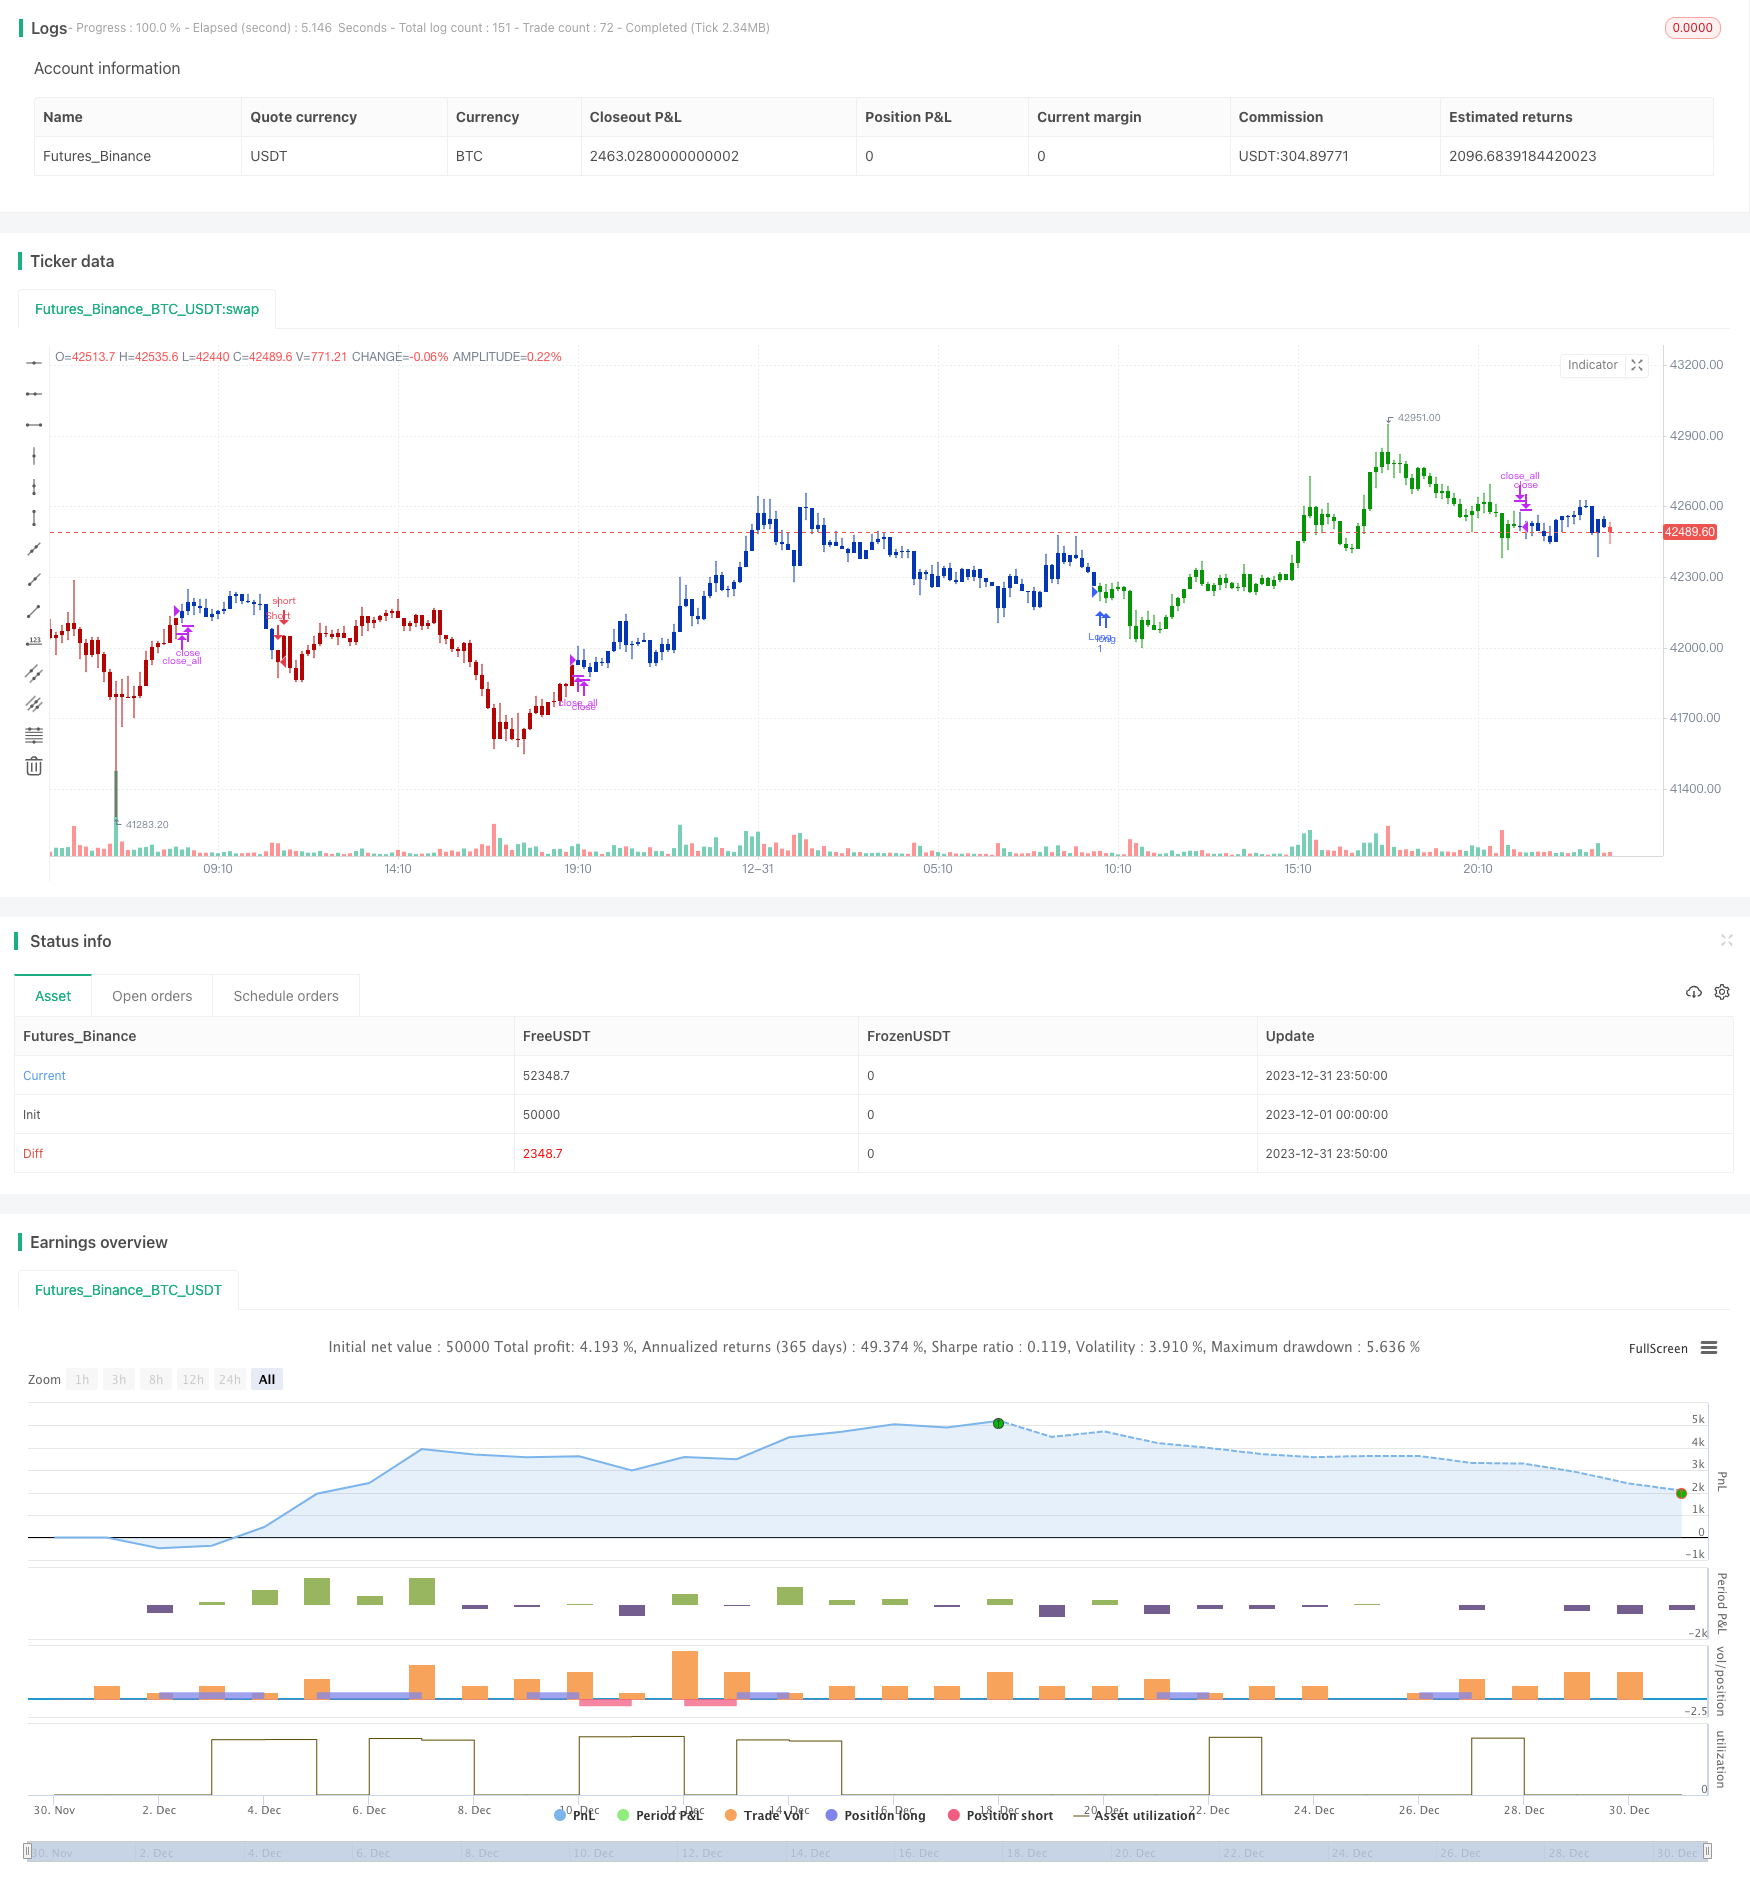
/*backtest
start: 2023-12-01 00:00:00
end: 2023-12-31 23:59:59
period: 10m
basePeriod: 1m
exchanges: [{"eid":"Futures_Binance","currency":"BTC_USDT"}]
*/

//@version=4
////////////////////////////////////////////////////////////
//  Copyright by HPotter v1.0 10/07/2021
// This is combo strategies for get a cumulative signal.
//
// First strategy
// This System was created from the Book "How I Tripled My Money In The
// Futures Market" by Ulf Jensen, Page 183. This is reverse type of strategies.
// The strategy buys at market, if close price is higher than the previous close
// during 2 days and the meaning of 9-days Stochastic Slow Oscillator is lower than 50.
// The strategy sells at market, if close price is lower than the previous close price
// during 2 days and the meaning of 9-days Stochastic Fast Oscillator is higher than 50.
//
// Second strategy
// Smart money index (SMI) or smart money flow index is a technical analysis indicator demonstrating investors sentiment.
// The index was invented and popularized by money manager Don Hays.[1] The indicator is based on intra-day price patterns.
// The main idea is that the majority of traders (emotional, news-driven) overreact at the beginning of the trading day
// because of the overnight news and economic data. There is also a lot of buying on market orders and short covering at the opening.
// Smart, experienced investors start trading closer to the end of the day having the opportunity to evaluate market performance.
// Therefore, the basic strategy is to bet against the morning price trend and bet with the evening price trend. The SMI may be calculated
// for many markets and market indices (S&P 500, DJIA, etc.)
//
// The SMI sends no clear signal whether the market is bullish or bearish. There are also no fixed absolute or relative readings signaling
// about the trend. Traders need to look at the SMI dynamics relative to that of the market. If, for example, SMI rises sharply when the
// market falls, this fact would mean that smart money is buying, and the market is to revert to an uptrend soon. The opposite situation
// is also true. A rapidly falling SMI during a bullish market means that smart money is selling and that market is to revert to a downtrend
// soon. The SMI is, therefore, a trend-based indicator.
// Some analysts use the smart money index to claim that precious metals such as gold will continually maintain value in the future.
//
// WARNING:
// - For purpose educate only
// - This script to change bars colors.
////////////////////////////////////////////////////////////
Reversal123(Length, KSmoothing, DLength, Level) =>
    vFast = sma(stoch(close, high, low, Length), KSmoothing)
    vSlow = sma(vFast, DLength)
    pos = 0.0
    pos := iff(close[2] < close[1] and close > close[1] and vFast < vSlow and vFast > Level, 1,
	         iff(close[2] > close[1] and close < close[1] and vFast > vSlow and vFast < Level, -1, nz(pos[1], 0)))
	pos


SMI(Length, tf) =>
    pos = 0.0
    nRes = 0.0
    xcloseH1 = security(syminfo.tickerid, tf, close[1])
    xopenH1 =  security(syminfo.tickerid, tf, open[1])
    nRes := nz(nRes[1], 1) - (open - close) + (xopenH1 - xcloseH1)
    xSmaRes = sma(nRes, Length)
    pos:= iff(xSmaRes > nRes, 1,
           iff(xSmaRes < nRes, -1, nz(pos[1], 0)))
    pos

strategy(title="Combo Backtest 123 Reversal & Smart Money Index (SMI)", shorttitle="Combo", overlay = true)
line1 = input(true, "---- 123 Reversal ----")
Length = input(14, minval=1)
KSmoothing = input(1, minval=1)
DLength = input(3, minval=1)
Level = input(50, minval=1)
//-------------------------
line2 = input(true, "---- Smart Money Index (SMI) ----")
LengthSMI = input(18, minval=1)
res = input(title="Resolution", type=input.resolution, defval="D")
reverse = input(false, title="Trade reverse")
posReversal123 = Reversal123(Length, KSmoothing, DLength, Level)
posSMI = SMI(LengthSMI, res)
pos = iff(posReversal123 == 1 and posSMI == 1 , 1,
	   iff(posReversal123 == -1 and posSMI == -1, -1, 0))
possig = iff(reverse and pos == 1, -1,
          iff(reverse and pos == -1 , 1, pos))
if (possig == 1 )
    strategy.entry("Long", strategy.long)
if (possig == -1 )
    strategy.entry("Short", strategy.short)
if (possig == 0)
    strategy.close_all()
barcolor(possig == -1 ? #b50404: possig == 1 ? #079605 : #0536b3 )