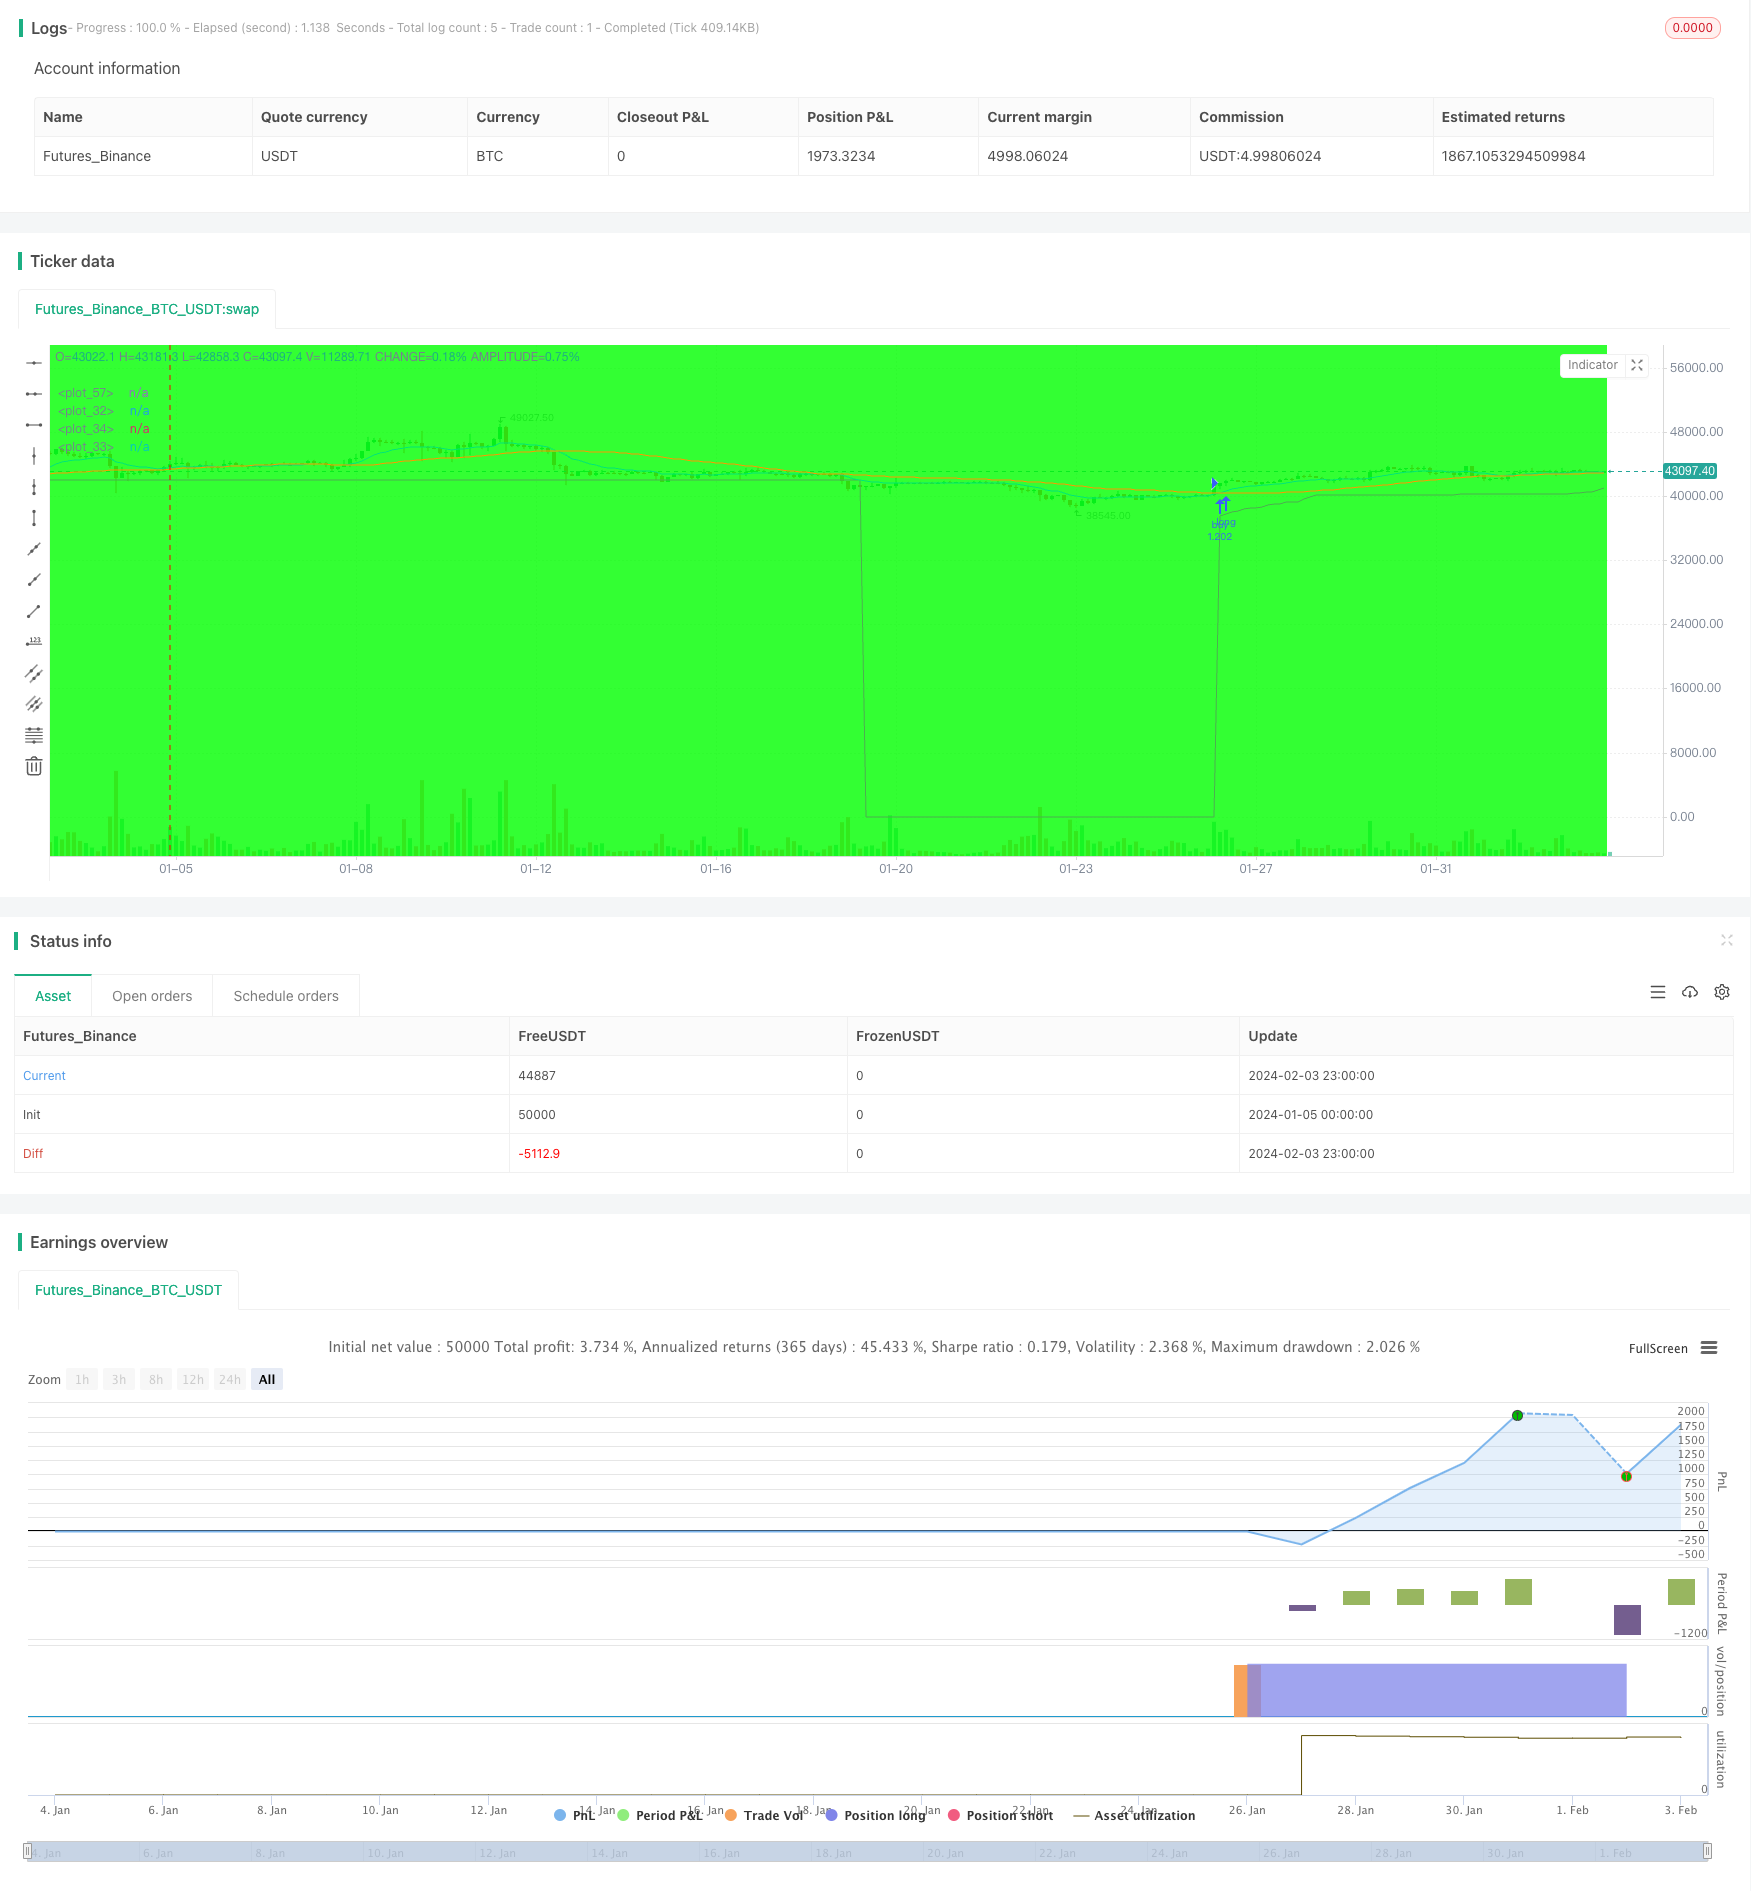
Stratégie de stop loss suiveur à double moyenne mobile

Aperçu
Cette stratégie permet de suivre efficacement les tendances du marché et de faire des arrêts en temps opportun après un profit.
Principe de stratégie
- Moyenne mobile rapide ((EMA): paramètre de la moyenne mobile indicielle à 12 jours, permettant une réponse rapide aux variations de prix.
- Moyenne mobile lente ((SMA): paramètre de la moyenne mobile simple à 45 jours, représentant une tendance à long terme.
- Un signal d’achat est généré lorsque la moyenne mobile rapide traverse la moyenne mobile lente.
- Le taux de volatilité réelle moyen sur 15 jours (ATR) est utilisé comme référence de stop loss.
- Le suivi du stop-loss est basé sur la valeur ATR (par exemple, 6 fois ATR) et le prix de stop-loss est mis à jour en temps réel.
- Un signal de vente est généré lorsque le prix est en dessous du prix d’arrêt.
Cette stratégie combine le suivi de la tendance et la gestion des pertes, permettant de suivre la direction de la ligne médiane et de contrôler les pertes individuelles par des arrêts.
Analyse des avantages
- Les combinaisons de moyennes mobiles permettent d’identifier efficacement les tendances et augmentent la fiabilité du signal.
- Le suivi dynamique des pertes permet de les arrêter en temps opportun et d’éviter les frappes financières.
- La combinaison de l’ATR avec le stop rend le prix de stop raisonnable et prévient la sursensibilité.
- Les stratégies sont claires et compréhensibles, et les paramètres sont flexibles.
Analyse des risques
- Les moyennes mobiles sont en retard et risquent de manquer une occasion de raccourcir la ligne.
- Le stop loss trop loyal peut nuire à la rentabilité.
- Un stop loss trop sensible entraîne une augmentation de la fréquence des transactions et du fardeau des frais.
- Les variations du taux de volatilité des actions peuvent affecter la stabilité des paramètres ATR.
Les paramètres des moyennes mobiles peuvent être optimisés de manière appropriée, ou le multiplicateur ATR peut être ajusté pour équilibrer le stop loss. Il peut également être combiné avec d’autres indicateurs comme conditions de filtrage pour améliorer le timing d’entrée.
Direction d’optimisation
- Tester plus de combinaisons de paramètres pour sélectionner la meilleure moyenne mobile.
- Ajustez les paramètres de multiples de stop loss ATR en fonction des caractéristiques des différentes actions.
- Il a ajouté des conditions de filtrage telles que des indices de quantité et de prix pour éviter des transactions inutiles.
- L’accumulation de plus de données historiques pour tester la stabilité des paramètres.
Résumer
Cette stratégie a réussi à intégrer le suivi de la tendance des moyennes mobiles et l’arrêt dynamique ATR, en optimisant les paramètres pour s’adapter aux différentes caractéristiques des actions. La stratégie a formé une limite claire d’achat et d’arrêt, ce qui rend la logique de négociation simple et claire.
/*backtest
start: 2024-01-05 00:00:00
end: 2024-02-04 00:00:00
period: 3h
basePeriod: 15m
exchanges: [{"eid":"Futures_Binance","currency":"BTC_USDT"}]
*/

//@version=2
//created by XPloRR 24-02-2018

strategy("XPloRR MA-Buy ATR-MA-Trailing-Stop Strategy",overlay=true, initial_capital=1000,default_qty_type=strategy.percent_of_equity,default_qty_value=100)

testStartYear = input(2005, "Start Year")
testStartMonth = input(1, "Start Month")
testStartDay = input(1, "Start Day")
testPeriodStart = timestamp(testStartYear,testStartMonth,testStartDay,0,0)

testStopYear = input(2050, "Stop Year")
testStopMonth = input(12, "Stop Month")
testStopDay = input(31, "Stop Day")
testPeriodStop = timestamp(testStopYear,testStopMonth,testStopDay,0,0)

testPeriodBackground = input(title="Background", type=bool, defval=true)
testPeriodBackgroundColor = testPeriodBackground and (time >= testPeriodStart) and (time <= testPeriodStop) ? #00FF00 : na
bgcolor(testPeriodBackgroundColor, transp=97)

emaPeriod = input(12, "Exponential MA")
smaPeriod = input(45, "Simple MA")
stopPeriod = input(12, "Stop EMA")
delta = input(6, "Trailing Stop #ATR")

testPeriod() => true

emaval=ema(close,emaPeriod)
smaval=sma(close,smaPeriod)
stopval=ema(close,stopPeriod)
atr=sma((high-low),15)

plot(emaval, color=blue,linewidth=1)
plot(smaval, color=orange,linewidth=1)
plot(stopval, color=lime,linewidth=1)

long=crossover(emaval,smaval)
short=crossunder(emaval,smaval)

//buy-sell signal
stop=0
inlong=0
if testPeriod()
    if (long and (not inlong[1]))
        strategy.entry("buy",strategy.long)
        inlong:=1
        stop:=emaval-delta*atr
    else
        stop:=iff((nz(emaval)>(nz(stop[1])+delta*atr))and(inlong[1]),emaval-delta*atr,nz(stop[1]))
        inlong:=nz(inlong[1])
        if ((stopval<stop) and (inlong[1]))
            strategy.close("buy")
            inlong:=0
            stop:=0
else
    inlong:=0
    stop:=0
plot(stop,color=green,linewidth=1)